Professional Backtesting,
Zero Code Required

Visual Strategy Replay
70+ Performance Metrics
Monte Carlo Simulation
Tax-Aware Analysis

Time-travel to any moment in your backtest. Inspect every indicator, every order, every decision. Understand the reasoning. Refine your approach.
This is backtesting you can actually understand.

「 All-in-One Solution 」

The Full Picture,
Not Just The Summary

Everything you need to know how your Strategy really performs—without juggling multiple tools or spreadsheets.

Walk Forward Analysis

Prevent overfitting and prove your strategy works on unseen data—not just in hindsight.

Fold 1: [—— IS ——][OOS]
Fold 2:      [—— IS ——][OOS]
Fold 3:            [—— IS ——][OOS]
Fold 4:                [—— IS ——][OOS]
  • Rolling & anchored window modes
  • Walk Forward Efficiency & Consistency Ratio
  • Per-fold degradation analysis & parameter stability

70+ Performance Metrics

Every ratio the pros use

SharpeSortinoCalmarVaRCVaROmegaKellySQNWin RateProfit FactorMAEMFE

Tax-Aware Analysis

After-tax equity curves & wash sales

  • Wash sale rule tracking
  • Section 1256 (60/40) treatment
  • After-tax equity curves
  • Capital gains optimization

Multi-Asset, Multi-timeframe

20,000+ instruments across 10 asset classes, all modeled with institutional-grade accuracy

Stocks
Crypto
Futures
Options
Forex

Plus ETFs, indices, commodities, and more—all modeled correctly.

Splits, Corporate Actions

Mergers, spin-offs, dividends, splits, and more all handled automatically. View performance before and after events.

÷ Split⊕ Merger$ Dividend↗ Spin-off

Monte Carlo Simulation

Understand strategy robustness under varied conditions or find optimal parameters with parameter sweeps

Parameter perturbation to detect curve fitting
Trade resampling with bootstrap
5th–95th percentile confidence bands
「 Strategy Replay 」

See Every Decision. Master Your Strategy.

Jump to any moment in history and see exactly what your algorithm saw. Inspect indicator values. Understand entry and exit reasoning. Gain complete transparency into your strategy's behavior.
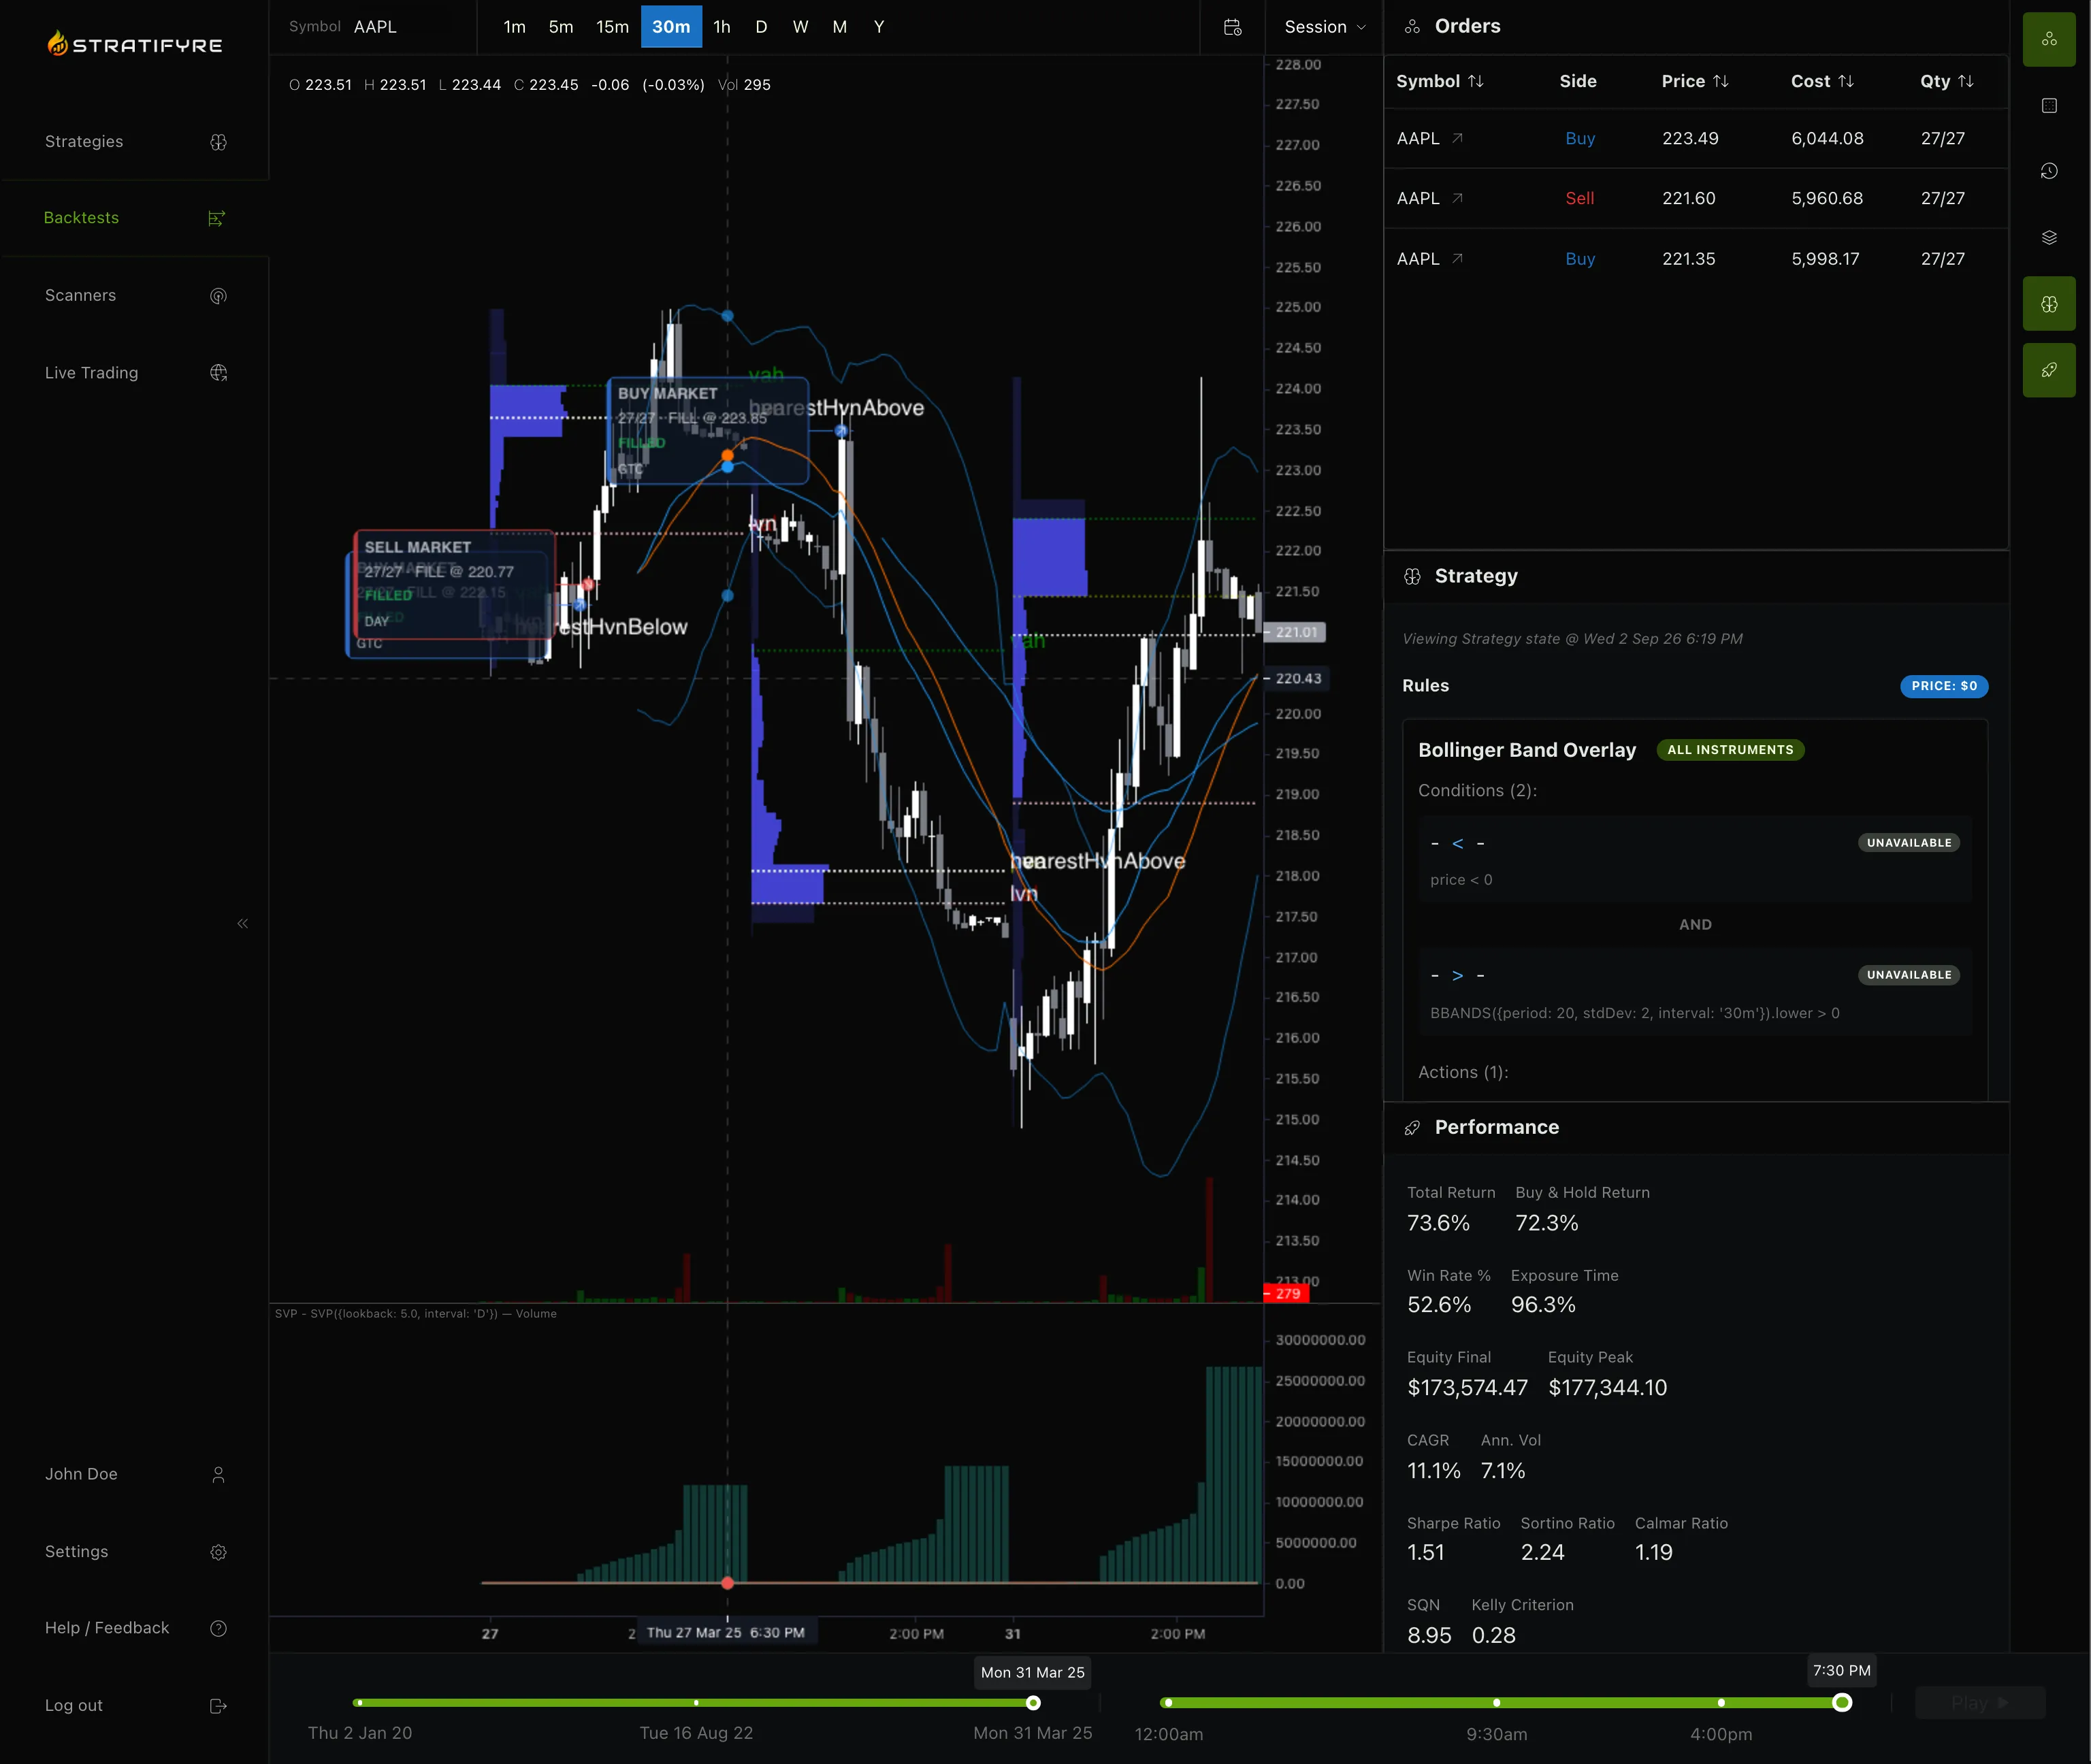
Market Crash Chart
01. INVESTIGATE

Pinpoint Any Moment in Time

When your strategy behaves unexpectedly, you need answers—not just numbers. Most platforms show outcomes without context. Stratifyre reveals the why.

02. TIME TRAVEL

Jump to the Exact Moment

Click any moment. Stratifyre rewinds the entire simulation to that millisecond—the state, the data, the market conditions—all restored exactly as they were.
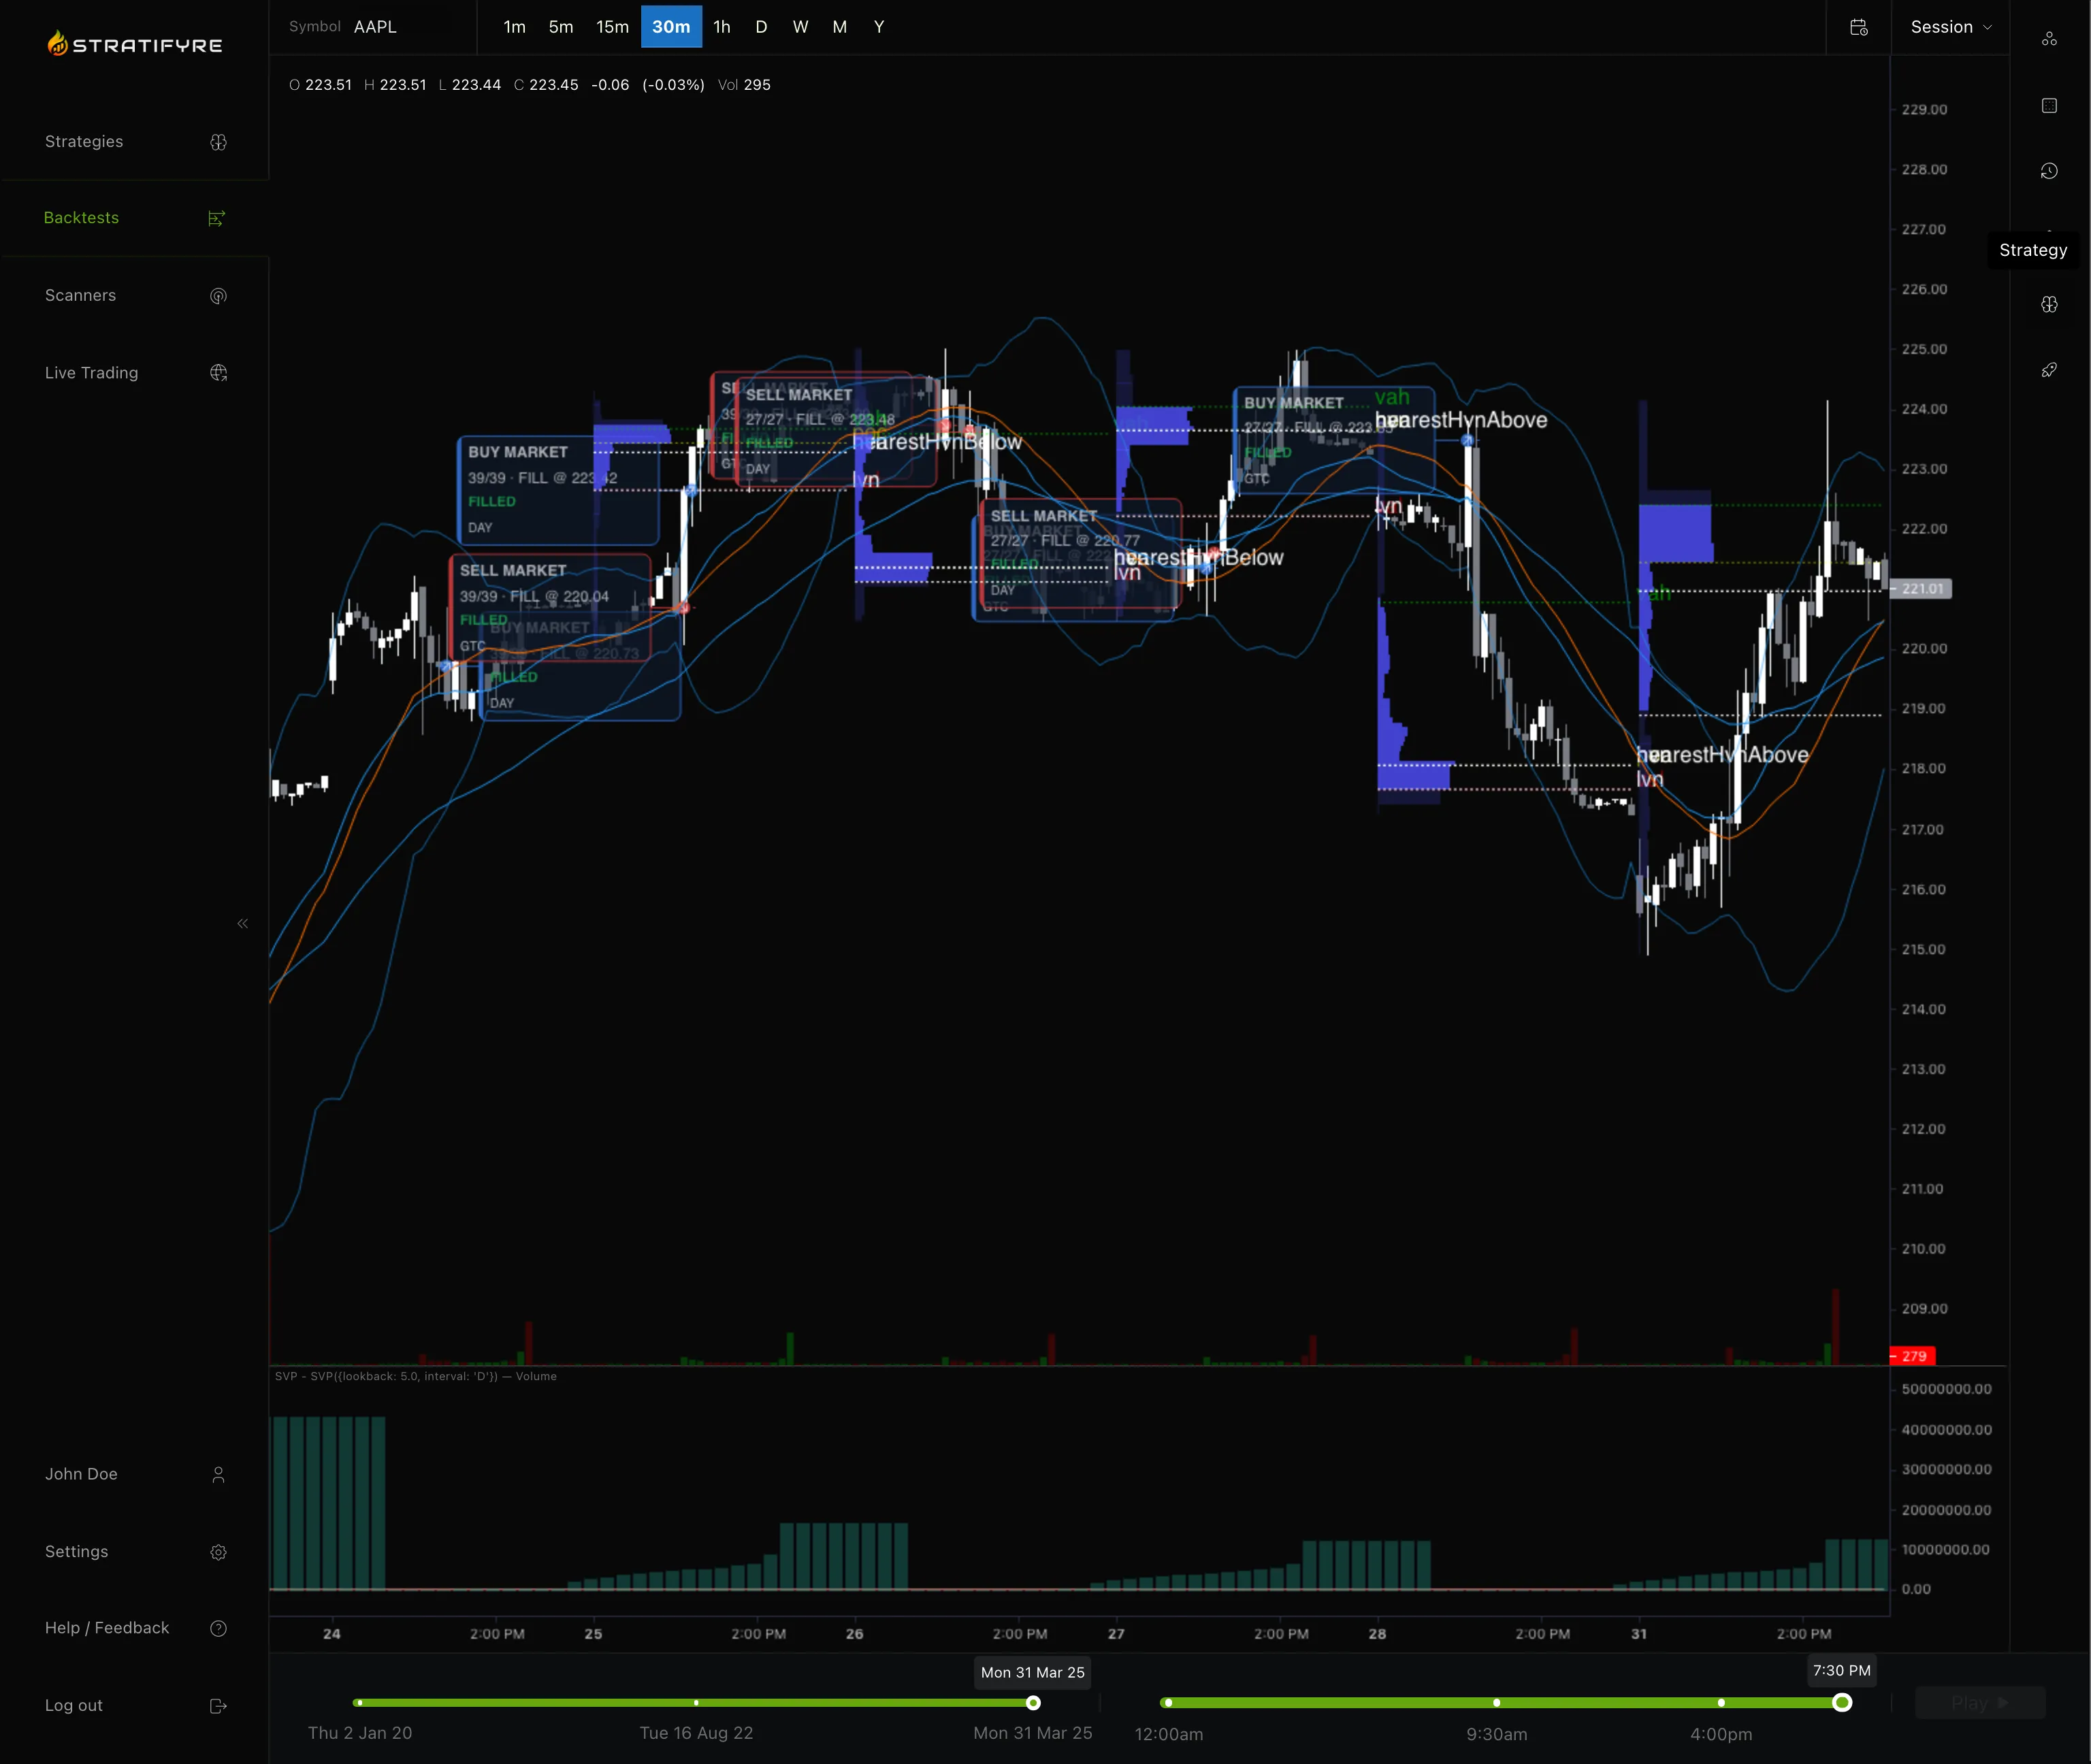
Code and State Inspection
03. INSPECT STATE

See What Your Bot Saw

Discover it wasn't bad luck—it was a logic bug. See exactly why:RSI (29.9) > 30 failed. Inspect variable state, pending orders, bid/ask spread, and more.
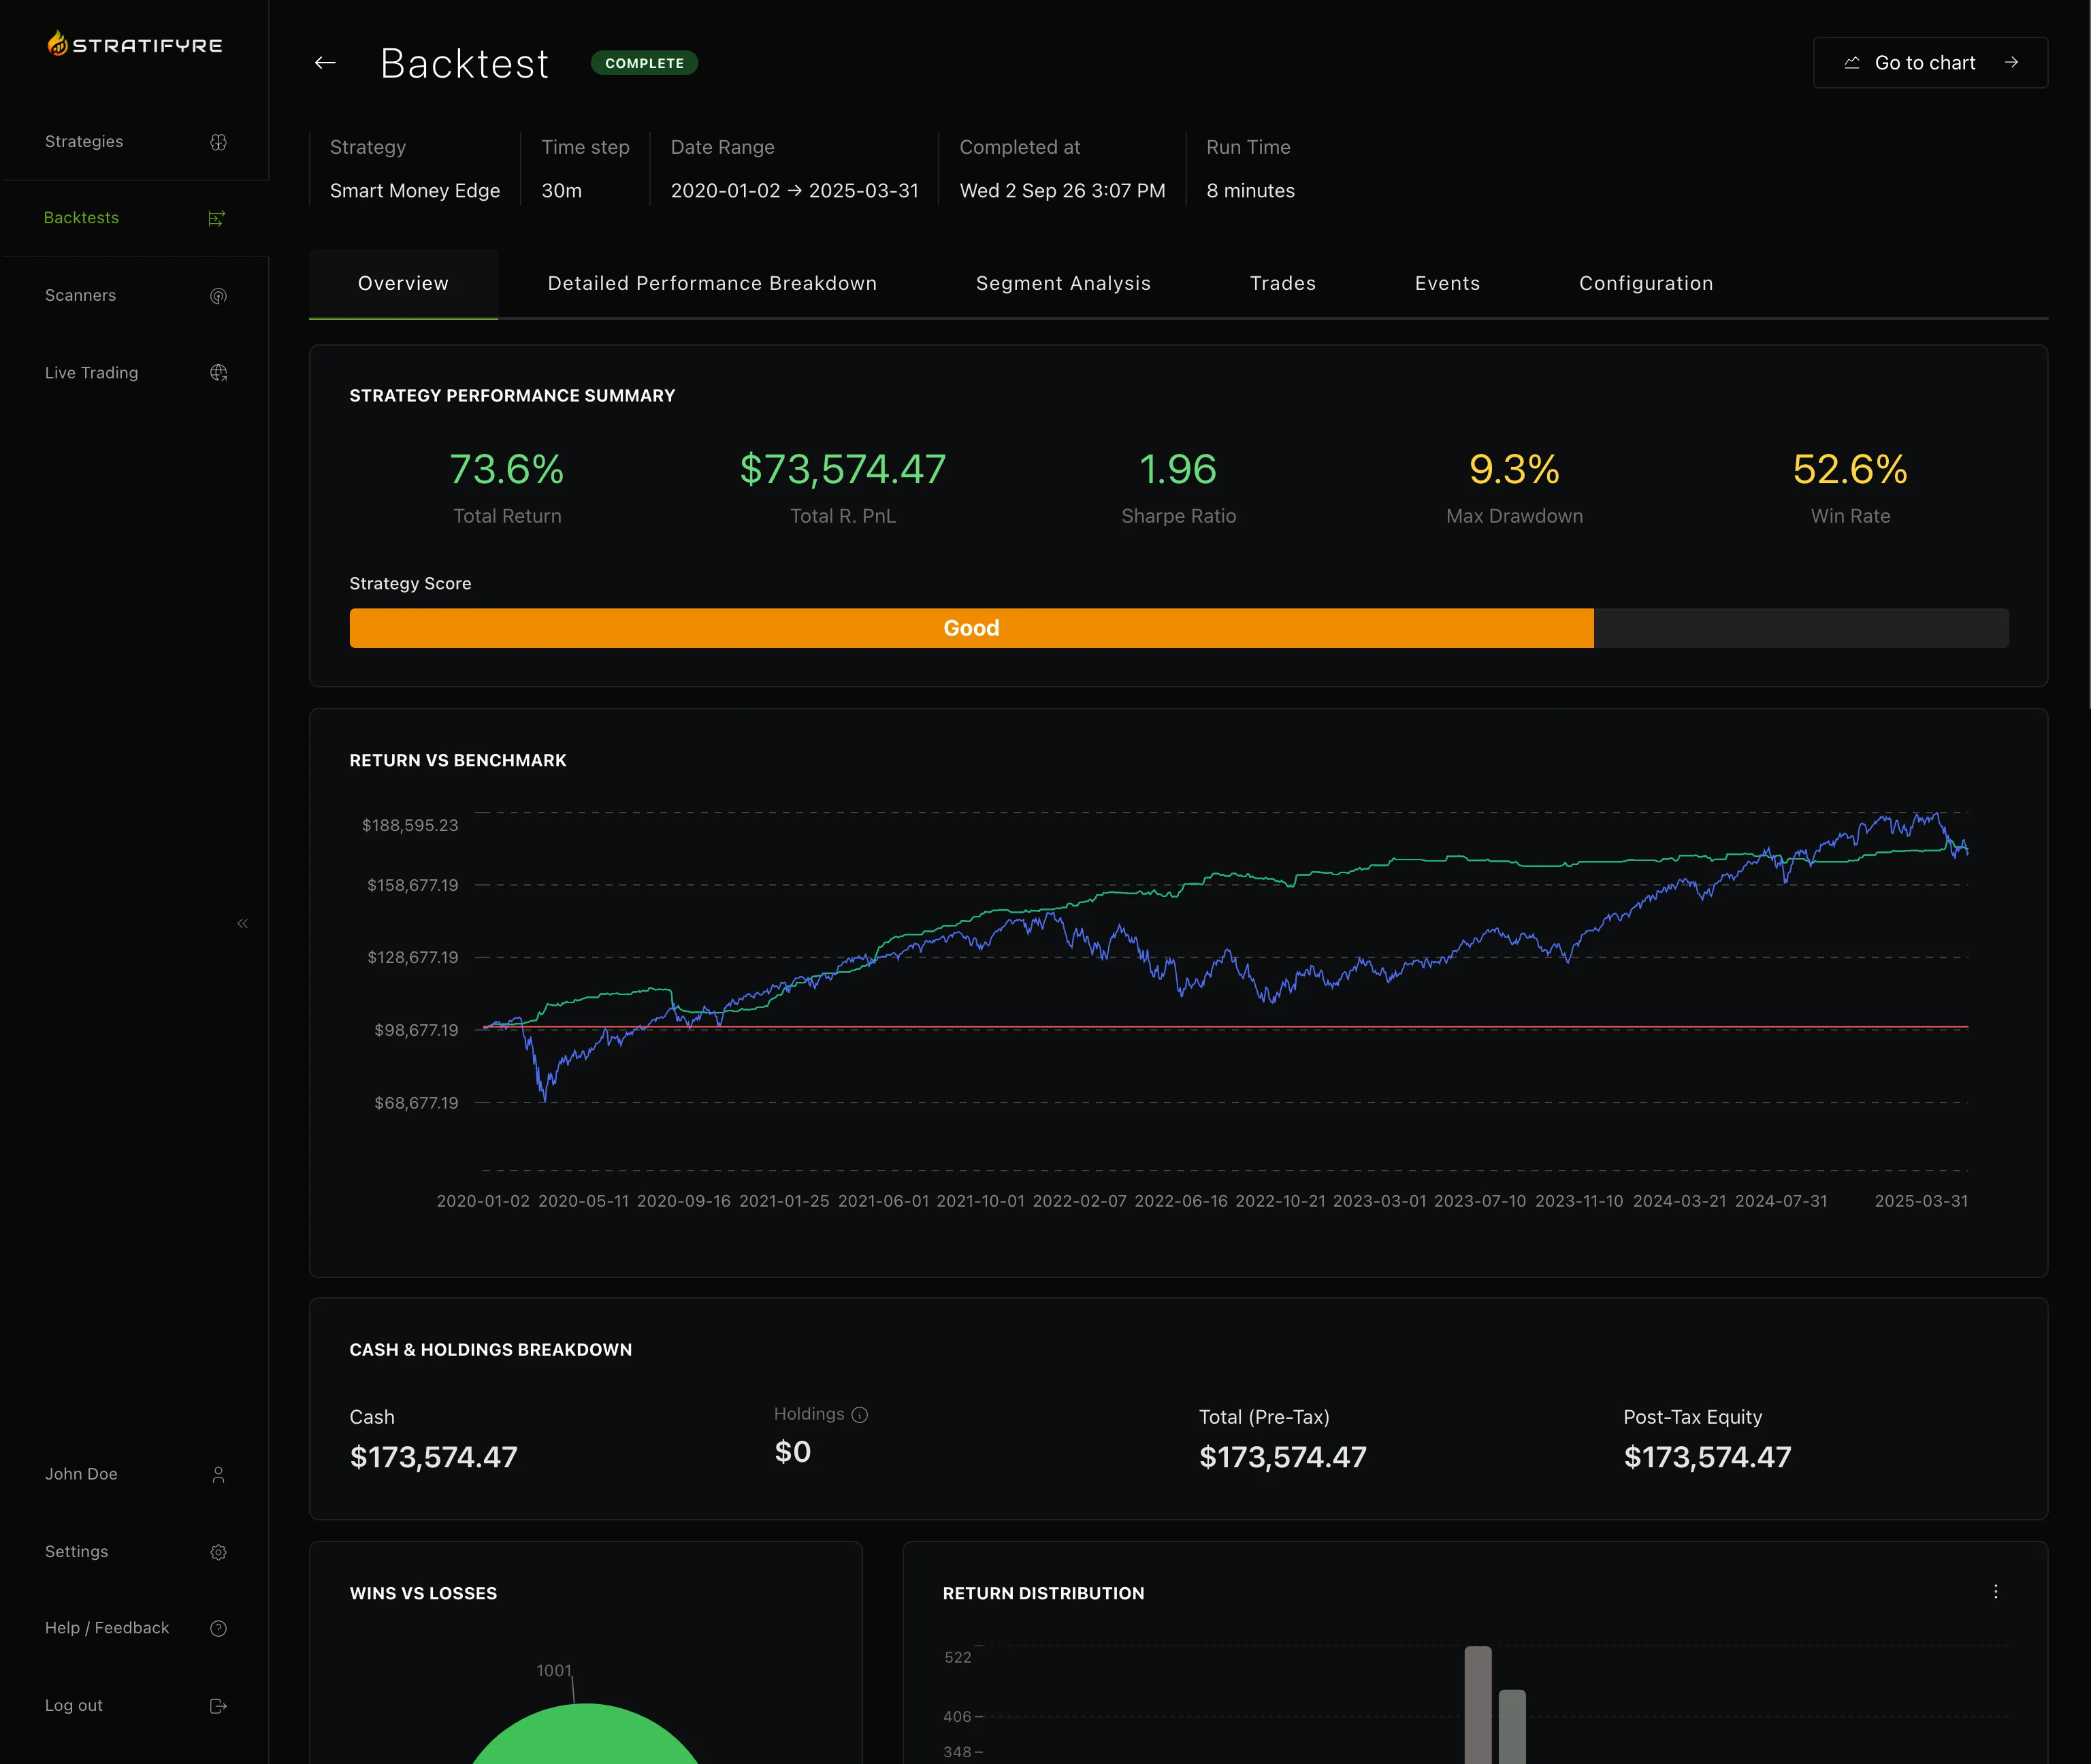
Fixed Strategy Chart
04. FIX & VERIFY

Refine & Improve

Update your logic and re-run the backtest instantly. See the improvement across iterations. With full visibility into every decision, you're not just tweaking parameters—you're building a strategy you truly understand.


「 Realistic Execution 」

Real Markets Have Slippage.
Your Backtest Should Too.

Stratifyre models the friction of the real world—slippage, liquidity, and fees—
so your live results match your expectations.

Typical Backtest

BACKTEST_LOG.txt
14:02:01SUBMIT ORDER: BUY 5000 @ 150.00
14:02:01FILLED 5000 @ 150.00

"Perfect liquidity." Instant fills at exact candle prices.
The result? False confidence.

Stratifyre

Audit Log & Events
5 events
Time
Event
Instr.
Message
14:02:01.234
Order Submitted
AAPL
Order submitted: BUY 5000 LIMIT
View on Chart
14:02:02.891
Partially Filled
AAPL
Order partially filled: 1240 @ 150.00
fillQuantity: 1240, remaining: 3760, venue: NASDAQ
View on Chart
14:02:03.445
Partially Filled
AAPL
Order partially filled: 2500 @ 150.05
fillQuantity: 2500, remaining: 1260, venue: ARCA
View on Chart
14:02:45.103
Order Filled
AAPL
Order filled: 1260 @ 150.12
fillQuantity: 1260, totalFilled: 5000, avgPrice: 150.09, venue: BATS
View on Chart
14:02:45.107
Position Opened
AAPL
Position opened at 150.09
View on Chart

Real fills based on Depth of Market volumes, bid/ask spread, and fee tiers.
The result? Real-world accuracy.

「 The Stratifyre Difference 」

Built Different. Tested Better.

This isn't about features for feature's sake. It's about trust. About knowing your backtest results will survive contact with real markets.

Other Platforms
Stratifyre

Fills at exact quoted price

4 fill modes modeling real execution

Unlimited liquidity assumed

Volume-aware fills (10% default max)

No slippage modeling

Configurable slippage per asset class

Results only—no decision visibility

Strategy Replay shows every decision

Basic performance metrics

70+ metrics including risk-adjusted ratios

No tax impact calculation

After-tax equity curves & wash sales

Single run, single outcome

Monte Carlo simulation with confidence bands

Corporate actions ignored

70+ corporate action types handled

Limited asset class support

10 asset classes with proper specs

Stratifyre

Build Strategies You Can Trust.

Backtesting that respects your intelligence—and gives you complete visibility into every decision.

$50 in free credits.