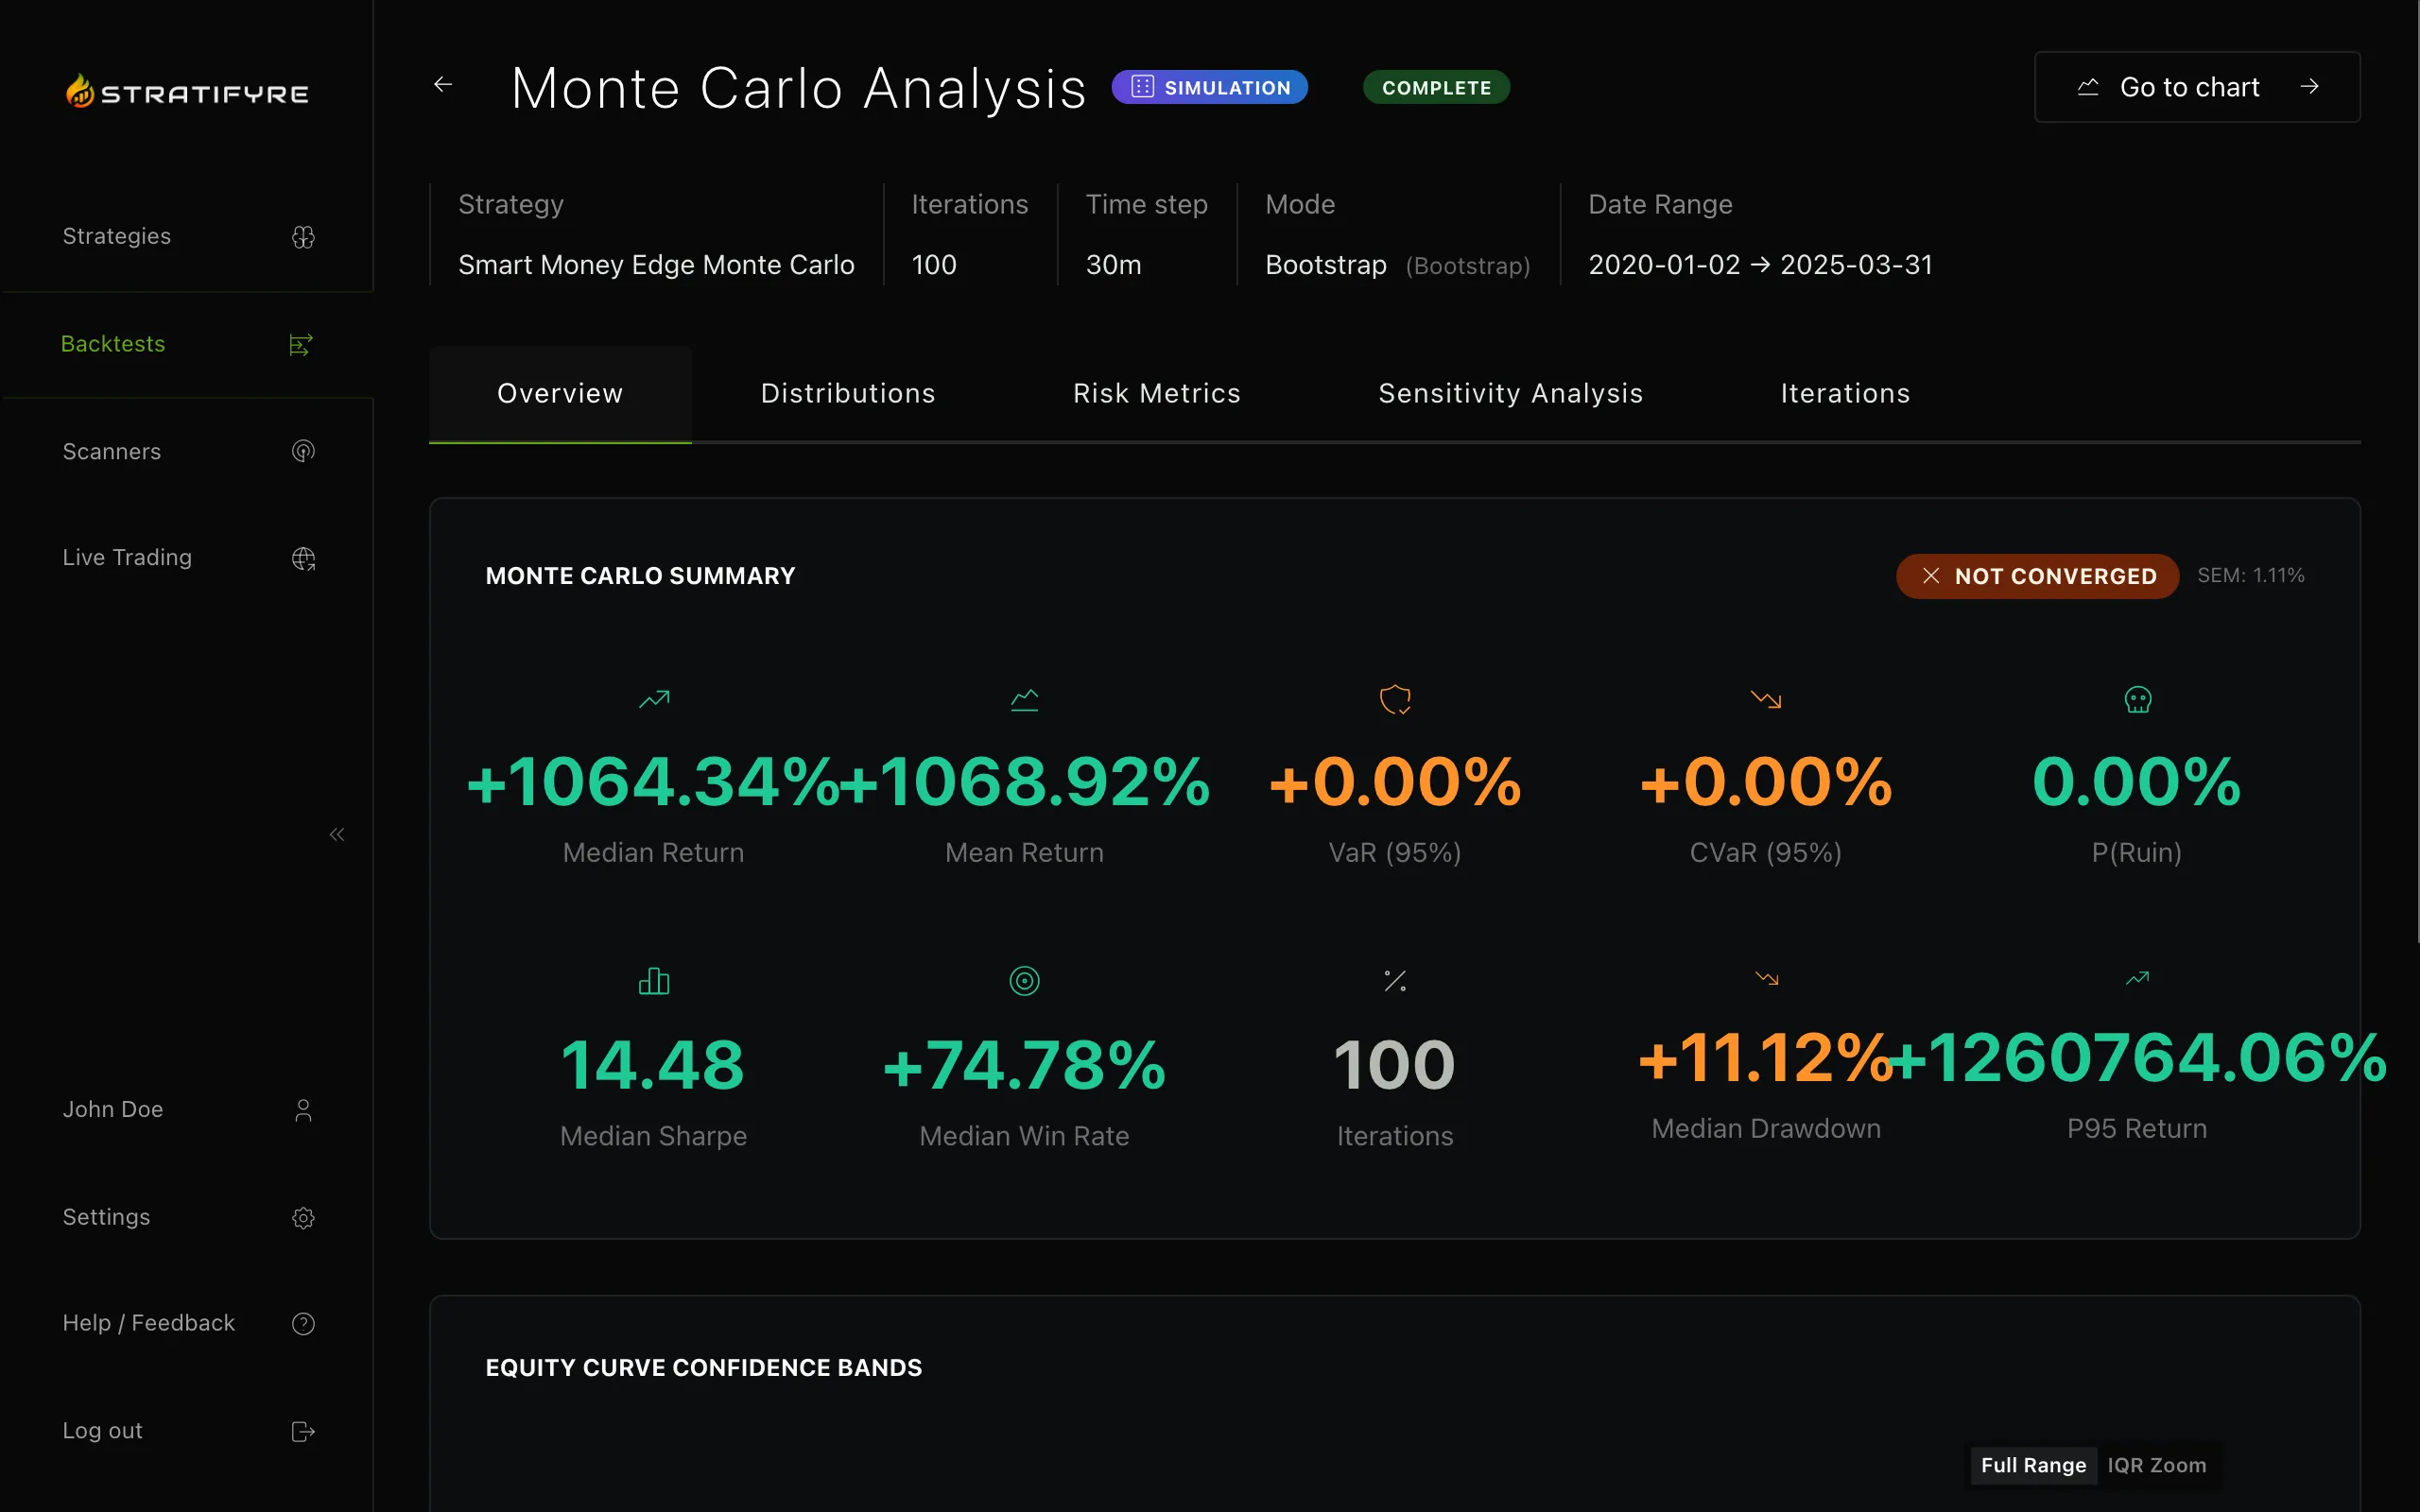
A strategy that returned 40% in your backtest could have just as easily lost 20% with slightly different timing. Use Stratifyre's Monte Carlo features to simulate thousands of random paths to know the true risk profile.
A single backtest is one possible timeline. Shuffle the trade order or tweak one parameter, and the results change dramatically. Monte Carlo simulates thousands of these alternate timelines so you can see the full picture.
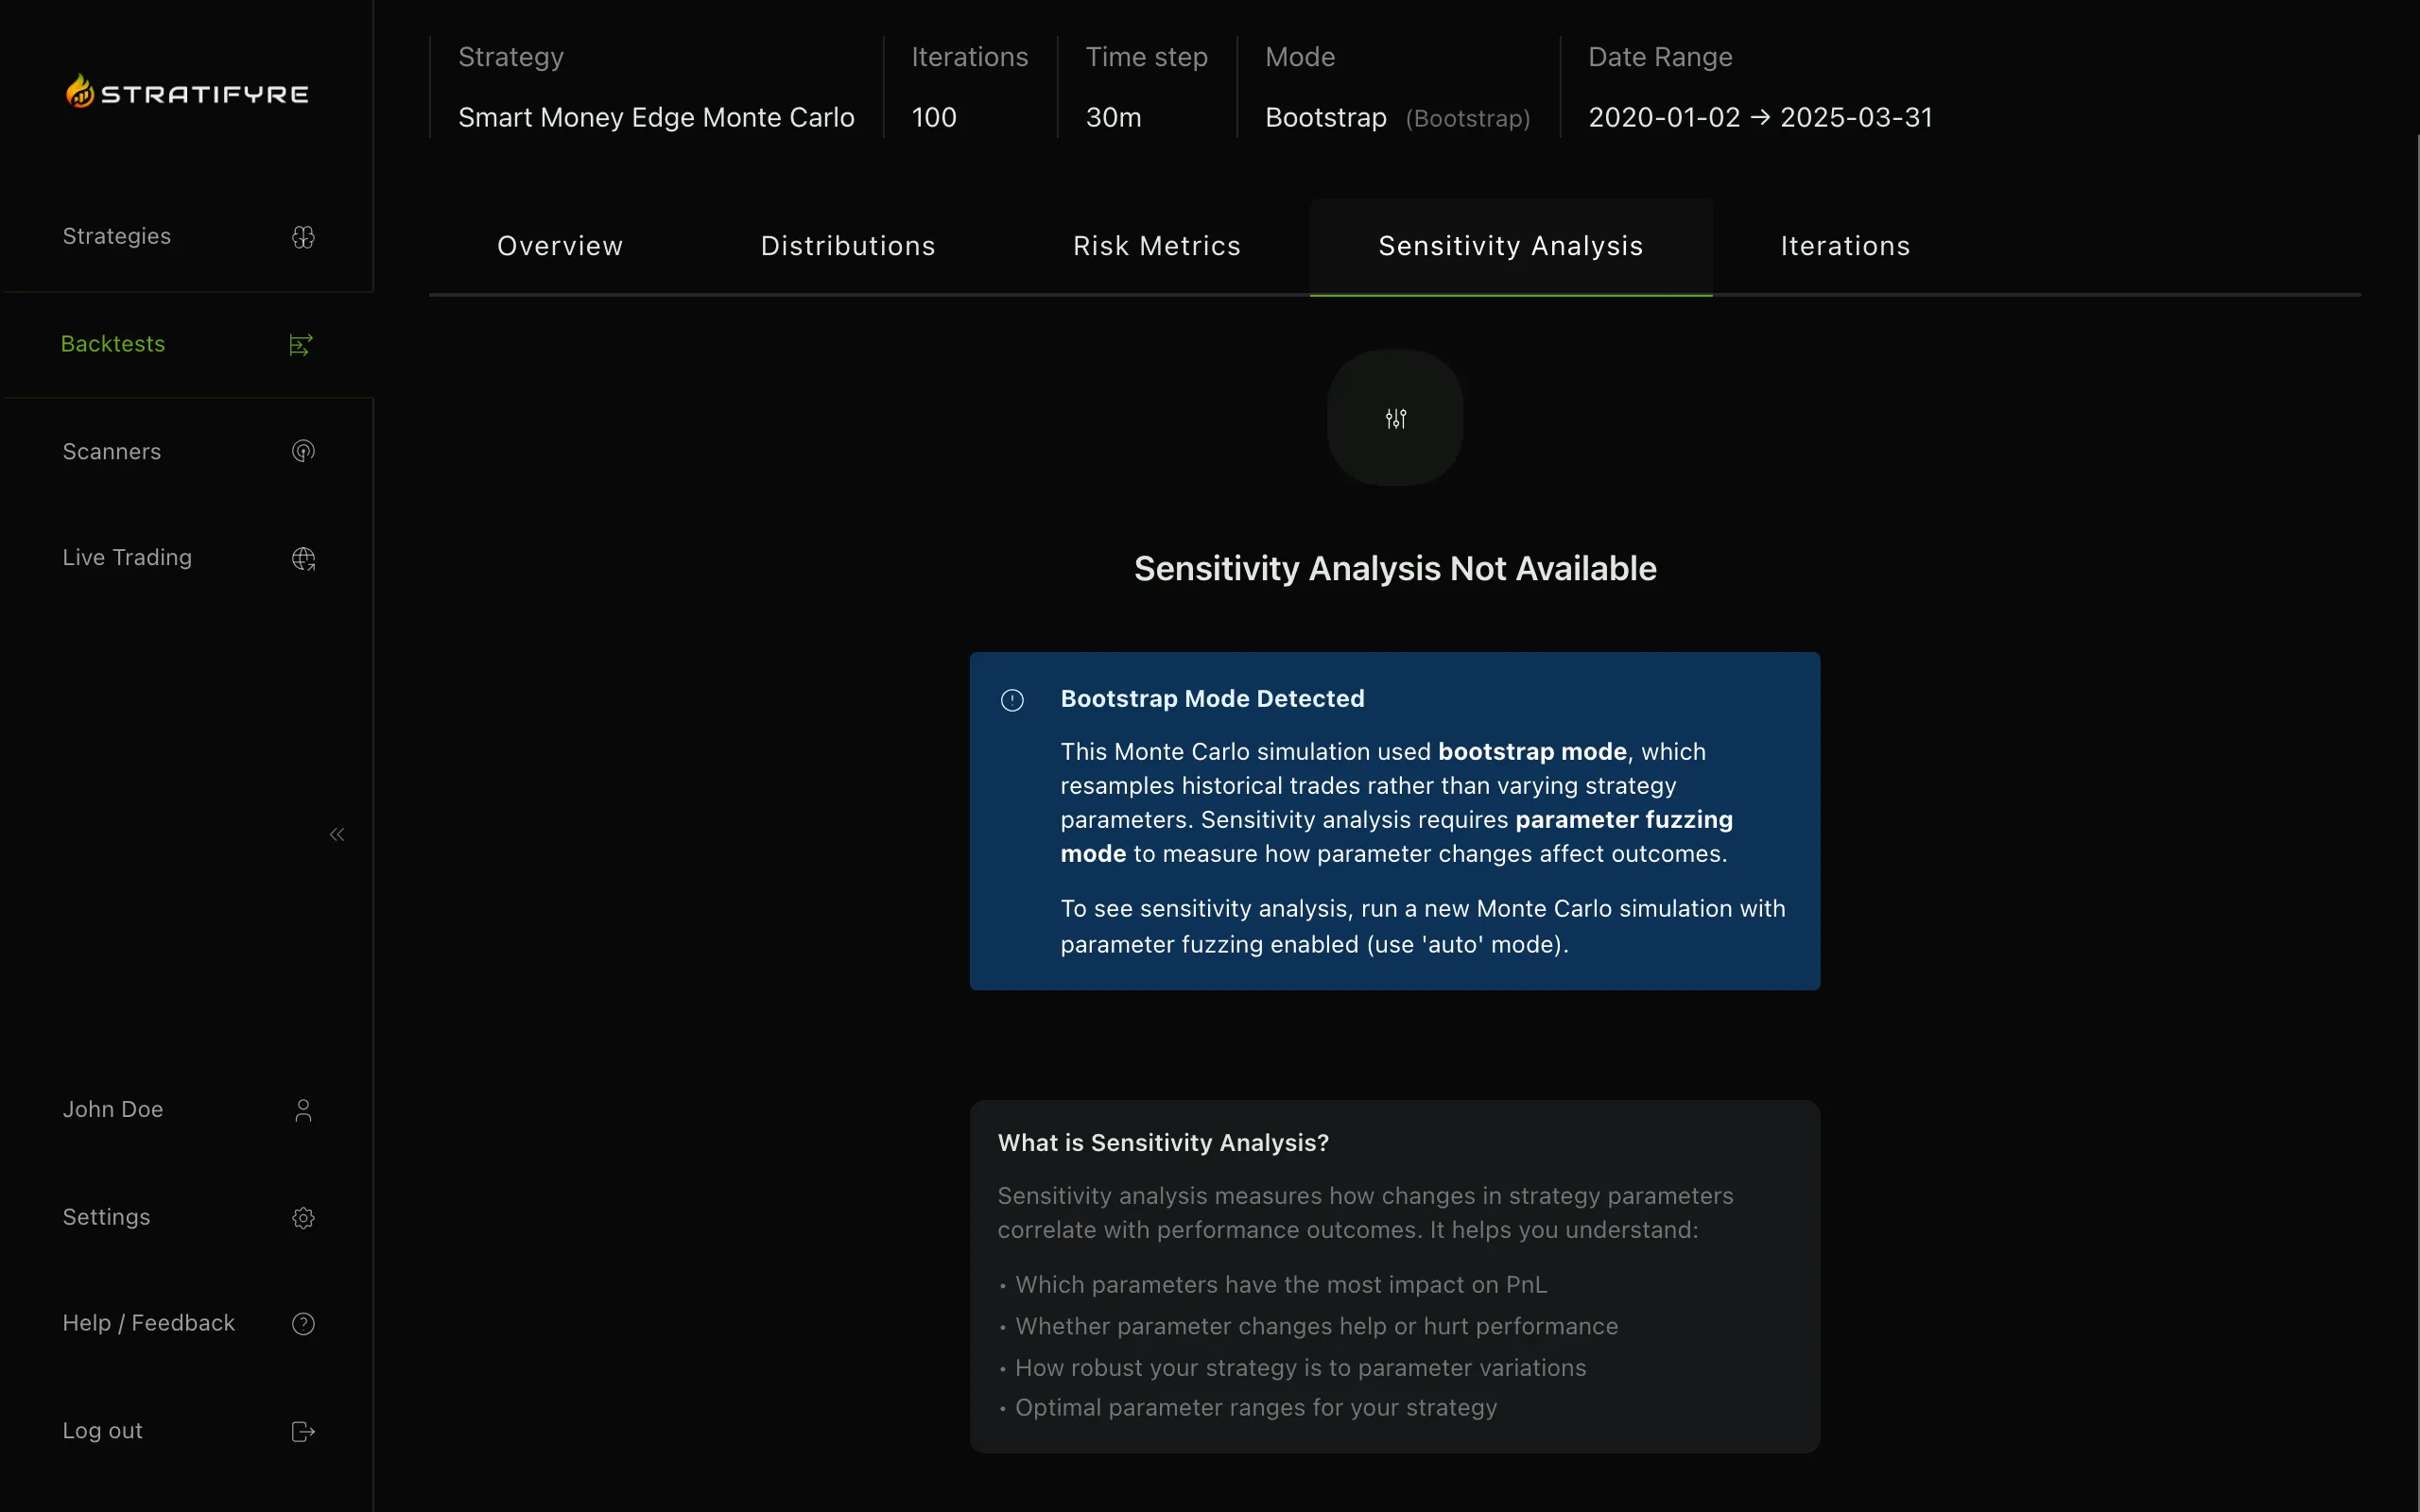
Every metric below is derived from thousands of simulated paths—not one lucky run. These are the numbers that tell you whether to go live, size up, or go back to the drawing board.
How Bad Can It Get?
In 95% of simulations, your worst loss stays above this number. This is the floor you plan around—not your average drawdown, but the bad day you need to survive.
Could It Blow Up Your Account?
The percentage of simulations where your strategy hit a drawdown large enough to wipe you out. If this number isn't near zero, your position sizing needs work.
How Much Should You Bet?
Your optimal position size—derived from your actual simulation results, not textbook theory. Kelly maximizes long-term growth while keeping ruin risk near zero, and recalculates automatically when your strategy changes.
Which strategy is actually more robust?
Two strategies both returned 40% in backtesting. One survives 95% of simulations. The other blows up in 30%. Backtest returns are a coin flip—Monte Carlo tells you which one you can actually trust with real money.
Was that run skill or luck?
Your backtest assumed one specific sequence of wins and losses. Monte Carlo reshuffles your actual trades thousands of ways to reveal how much of that great run was timing—and whether the same edge holds in a different order.
What should you realistically expect?
The range of outcomes across all simulated paths. Before you risk capital, know where you realistically land—not just the best-case scenario your backtest happened to produce.

Run Monte Carlo simulations and trade with confidence in what could happen—not just what happened to happen.