Live trading often underperforms backtests.
The gap usually comes from risk factors that standard metrics don't surface: tax drag, drawdown duration, exit inefficiency, and statistical variance. Stratifyre quantifies these factors so you can make informed decisions before deploying capital.
Standard backtest reports show returns, win rate, and max drawdown. These four factors explain much of the gap between backtest and live performance.
Most backtesting platforms provide solid core metrics. Stratifyre adds the extended analysis that institutional traders expect.

Pre-tax returns
Pre-tax + after-tax equity curves
Max drawdown depth
Drawdown depth + duration + recovery time
Win rate, profit factor
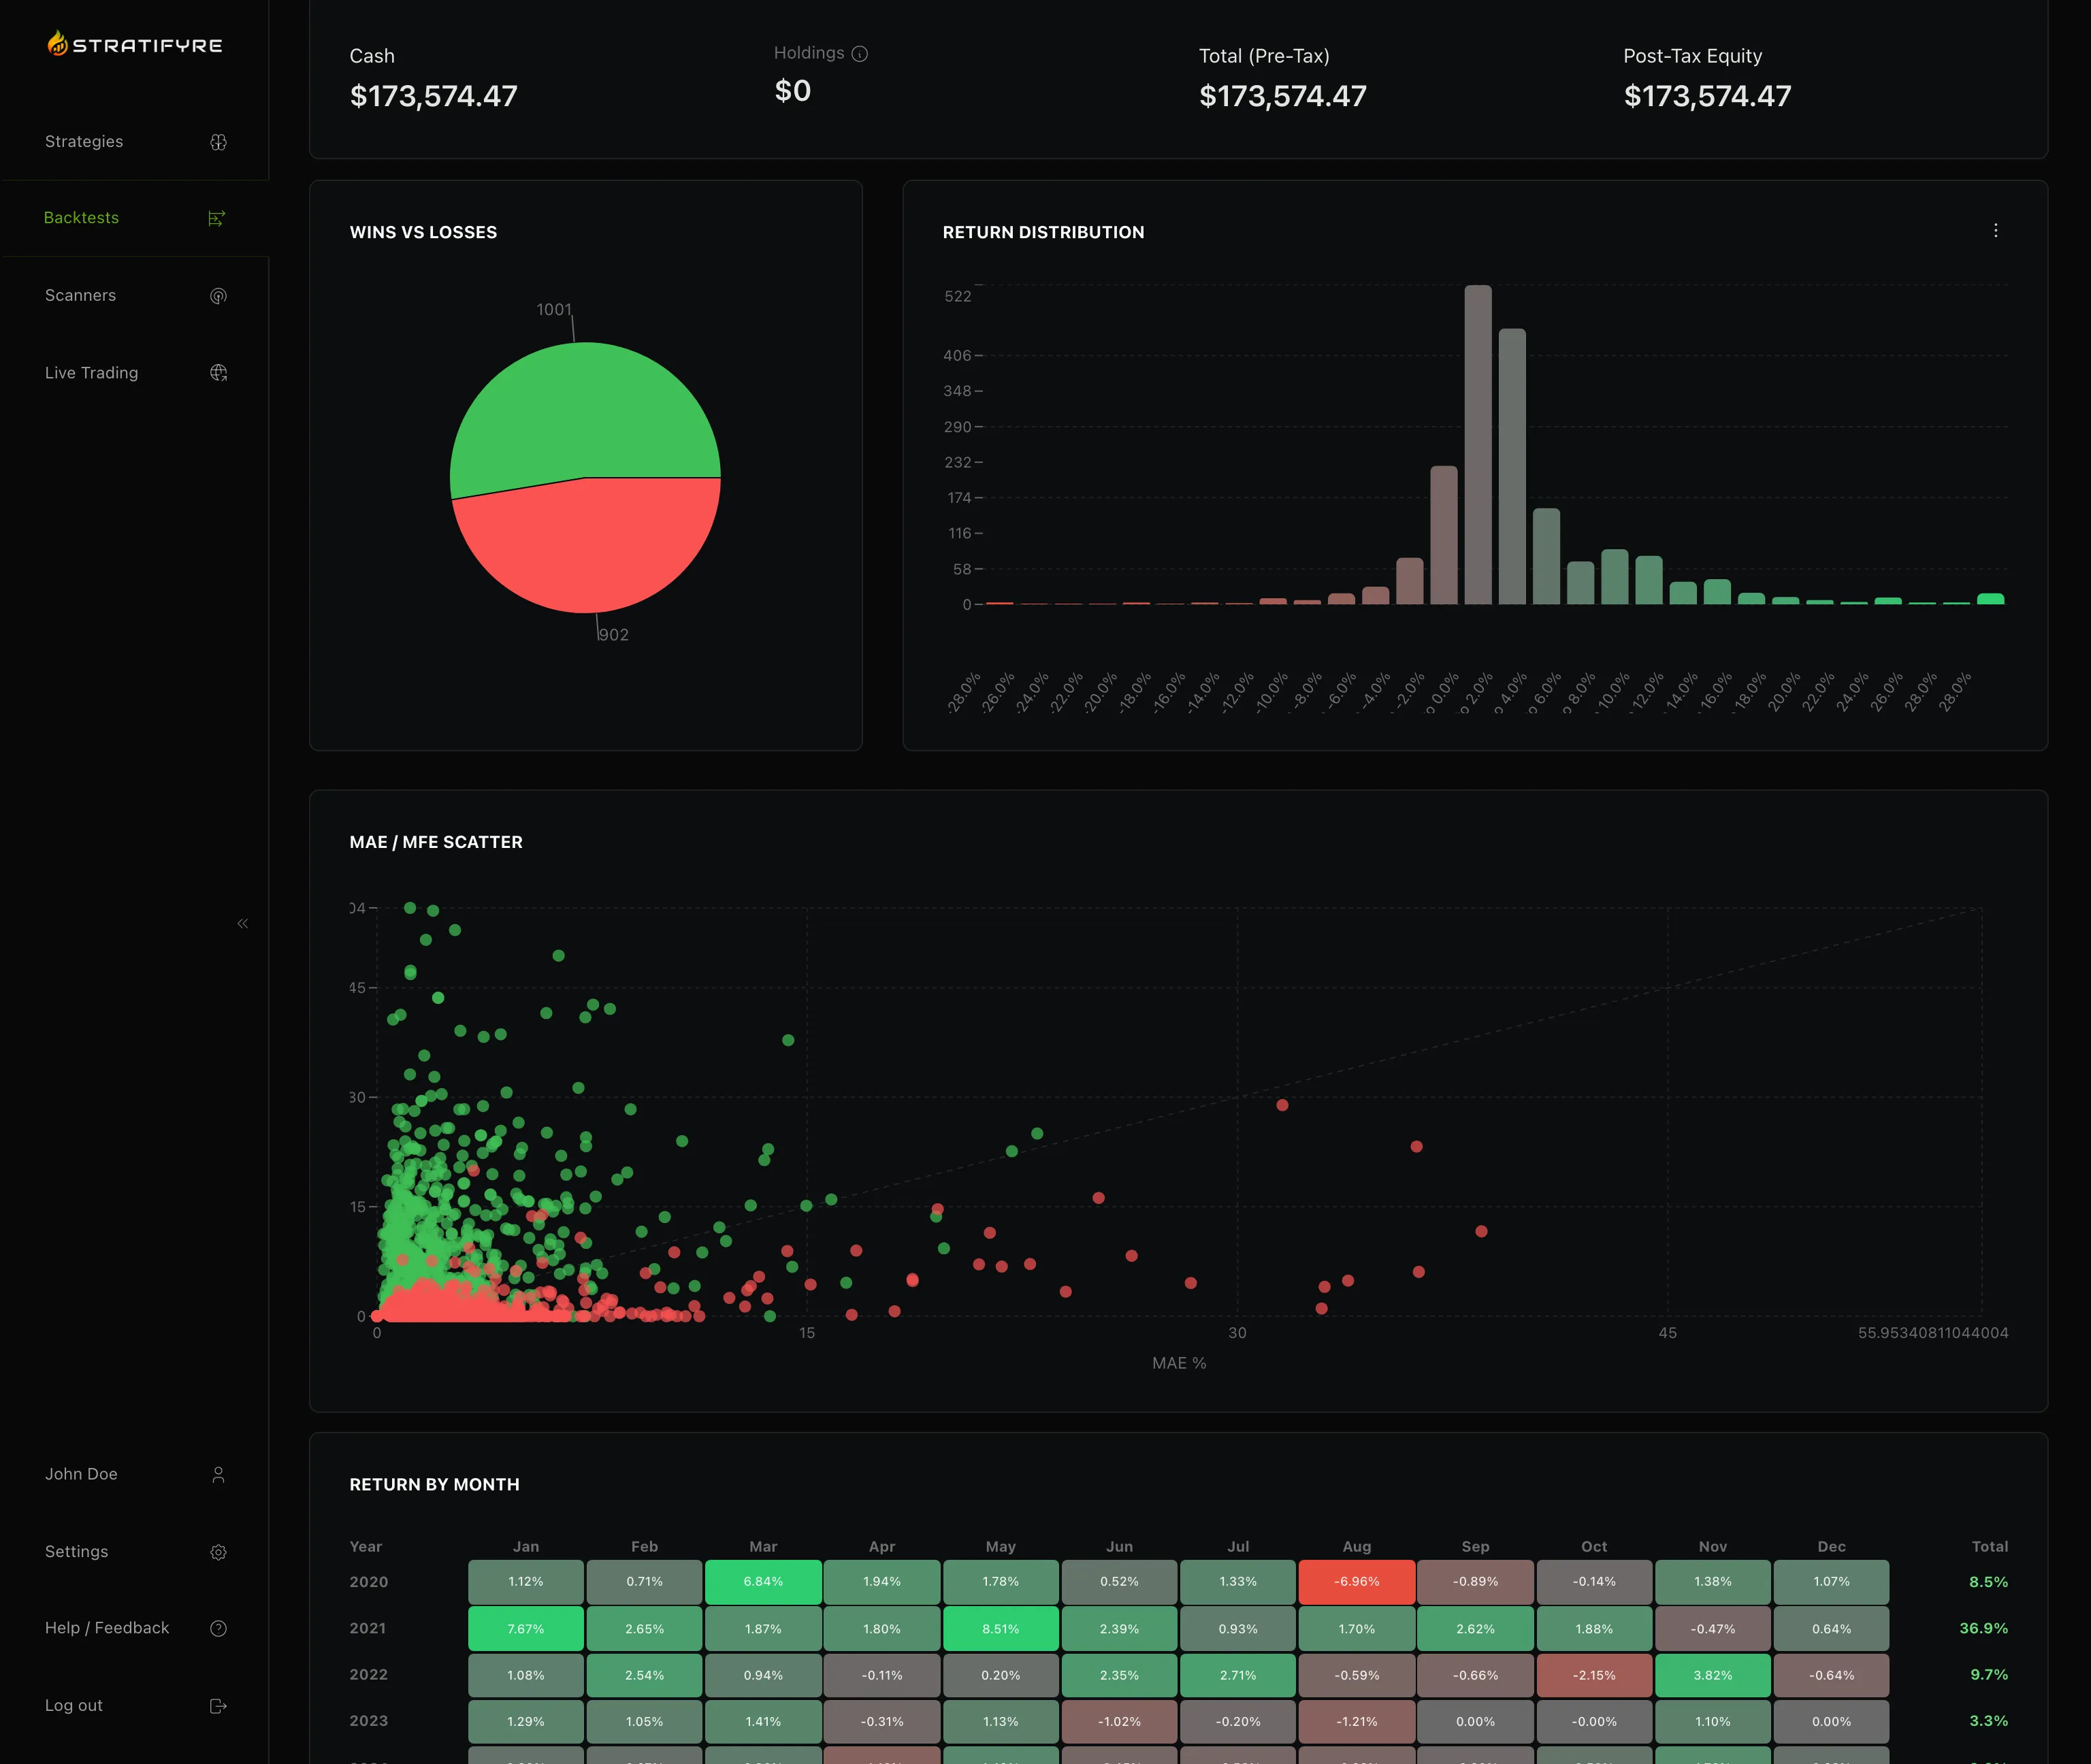
Win rate + MAE/MFE trade quality analysis
Single backtest result
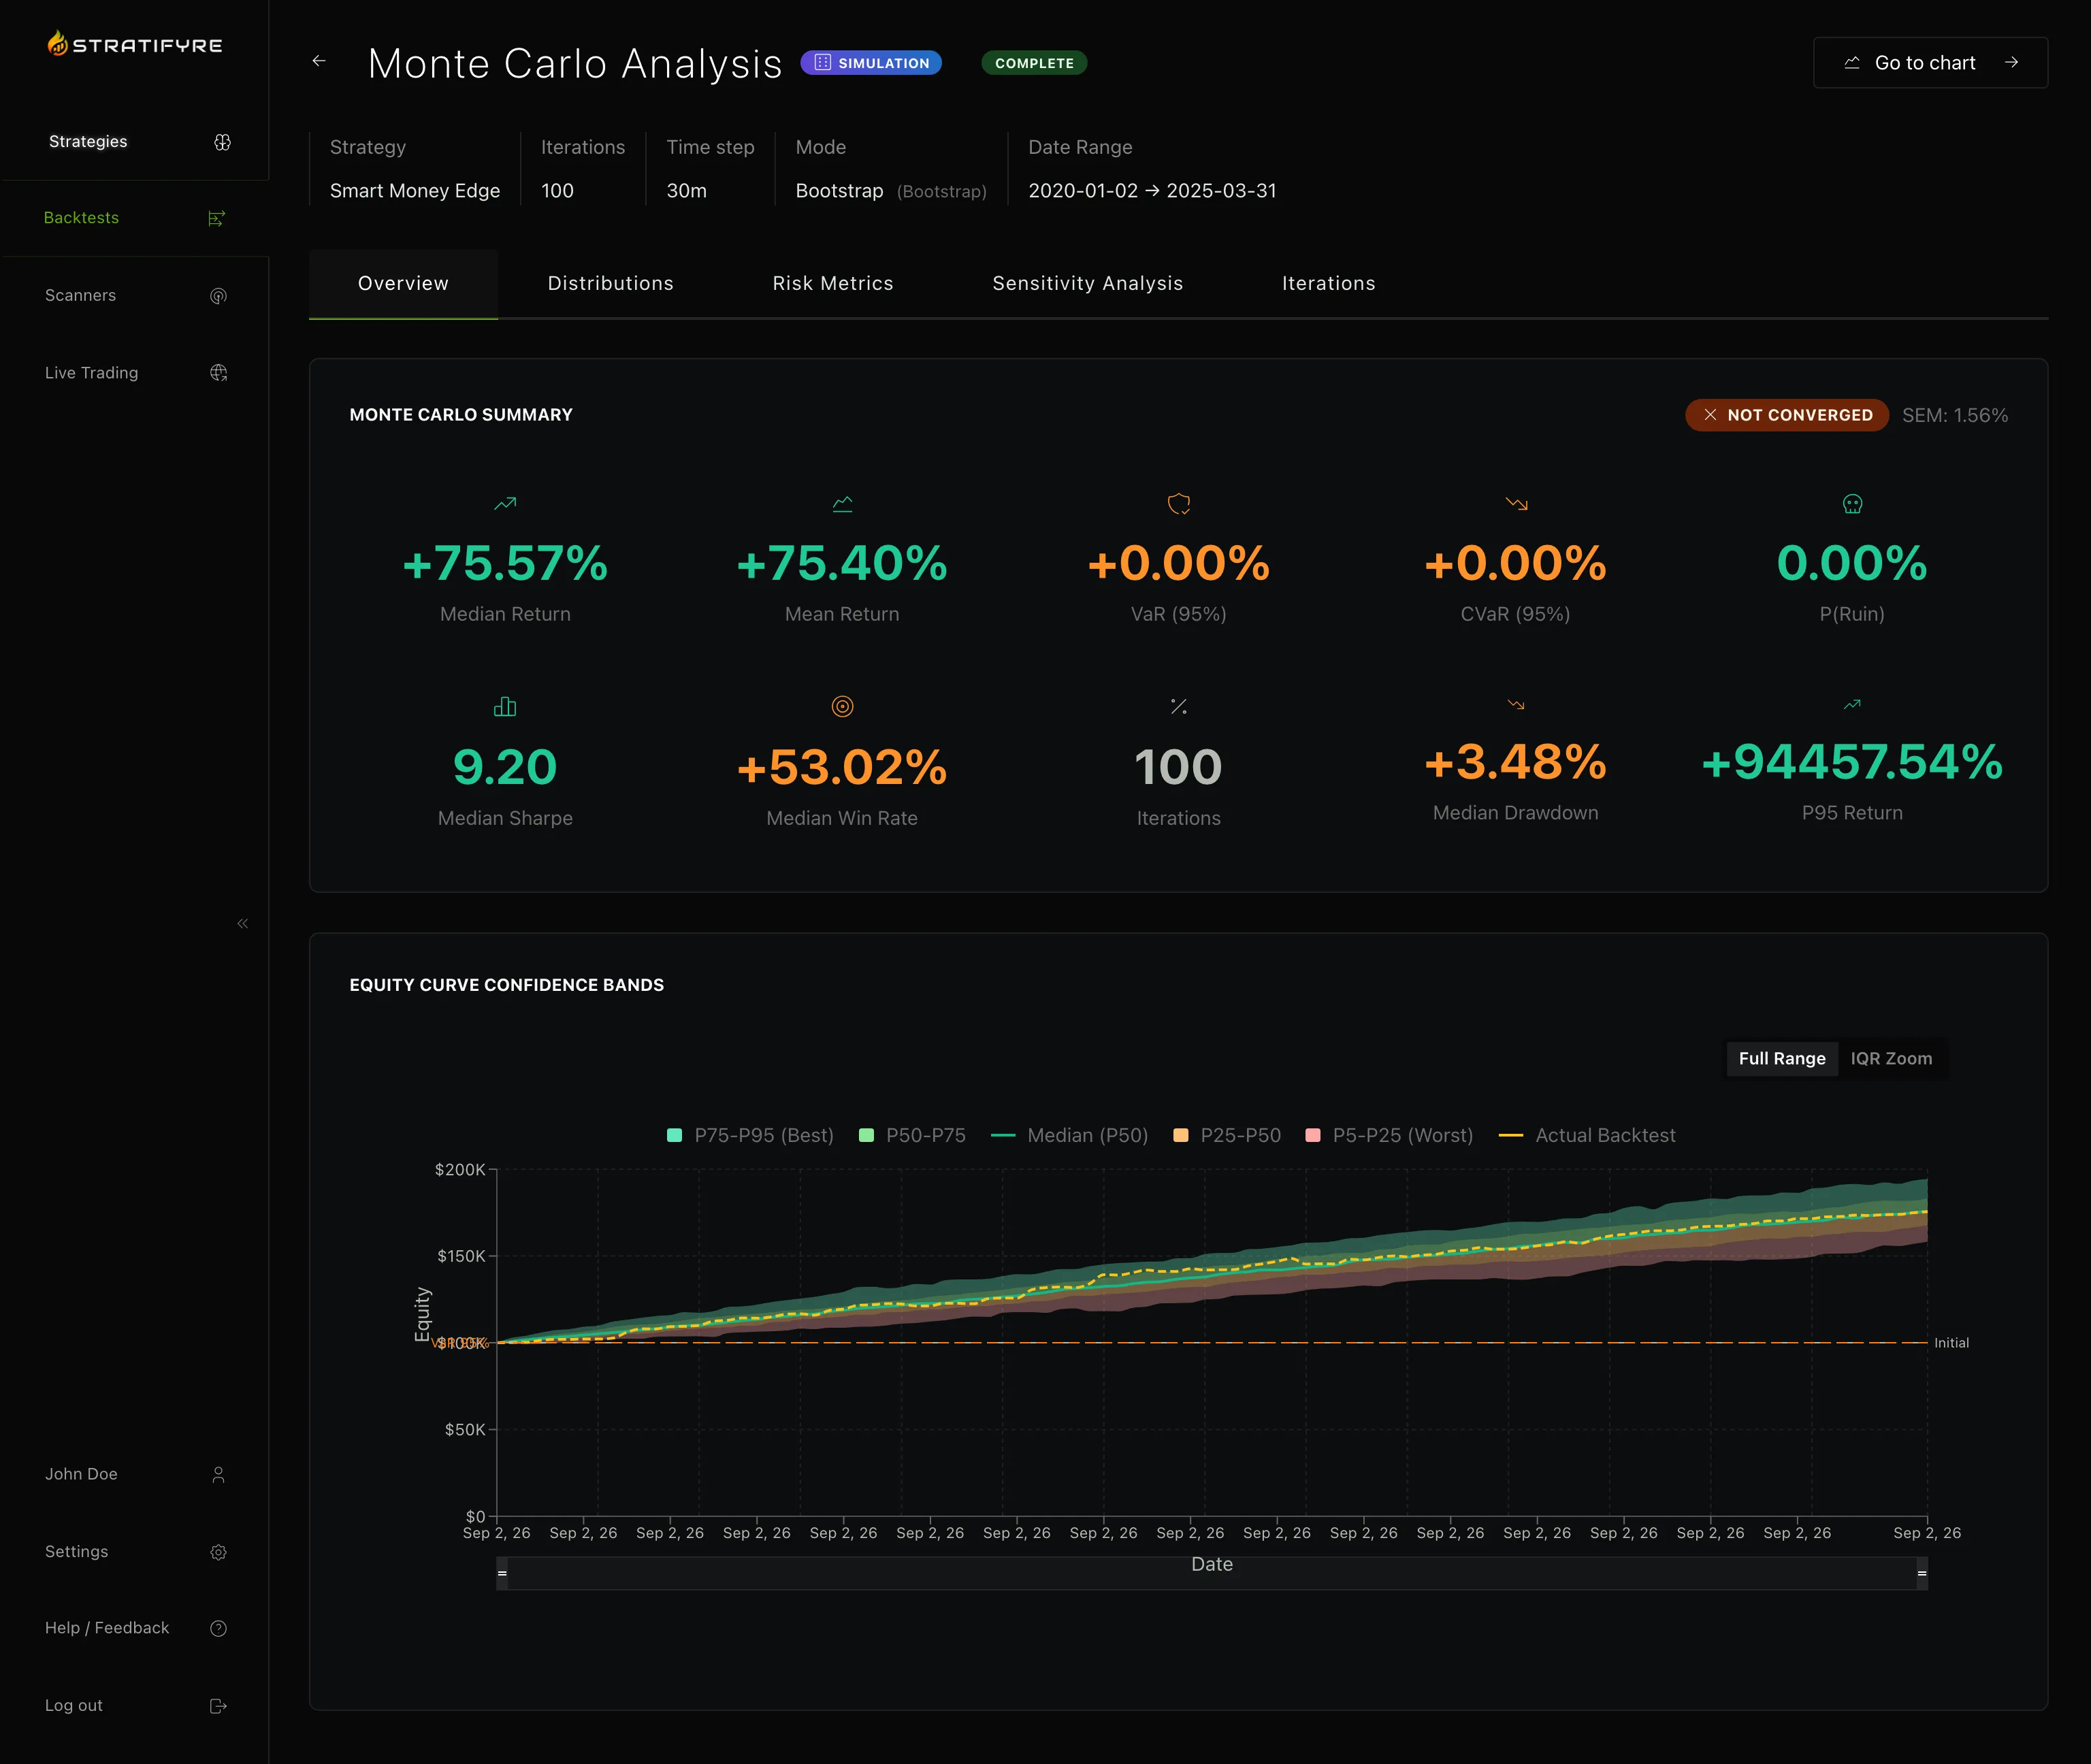
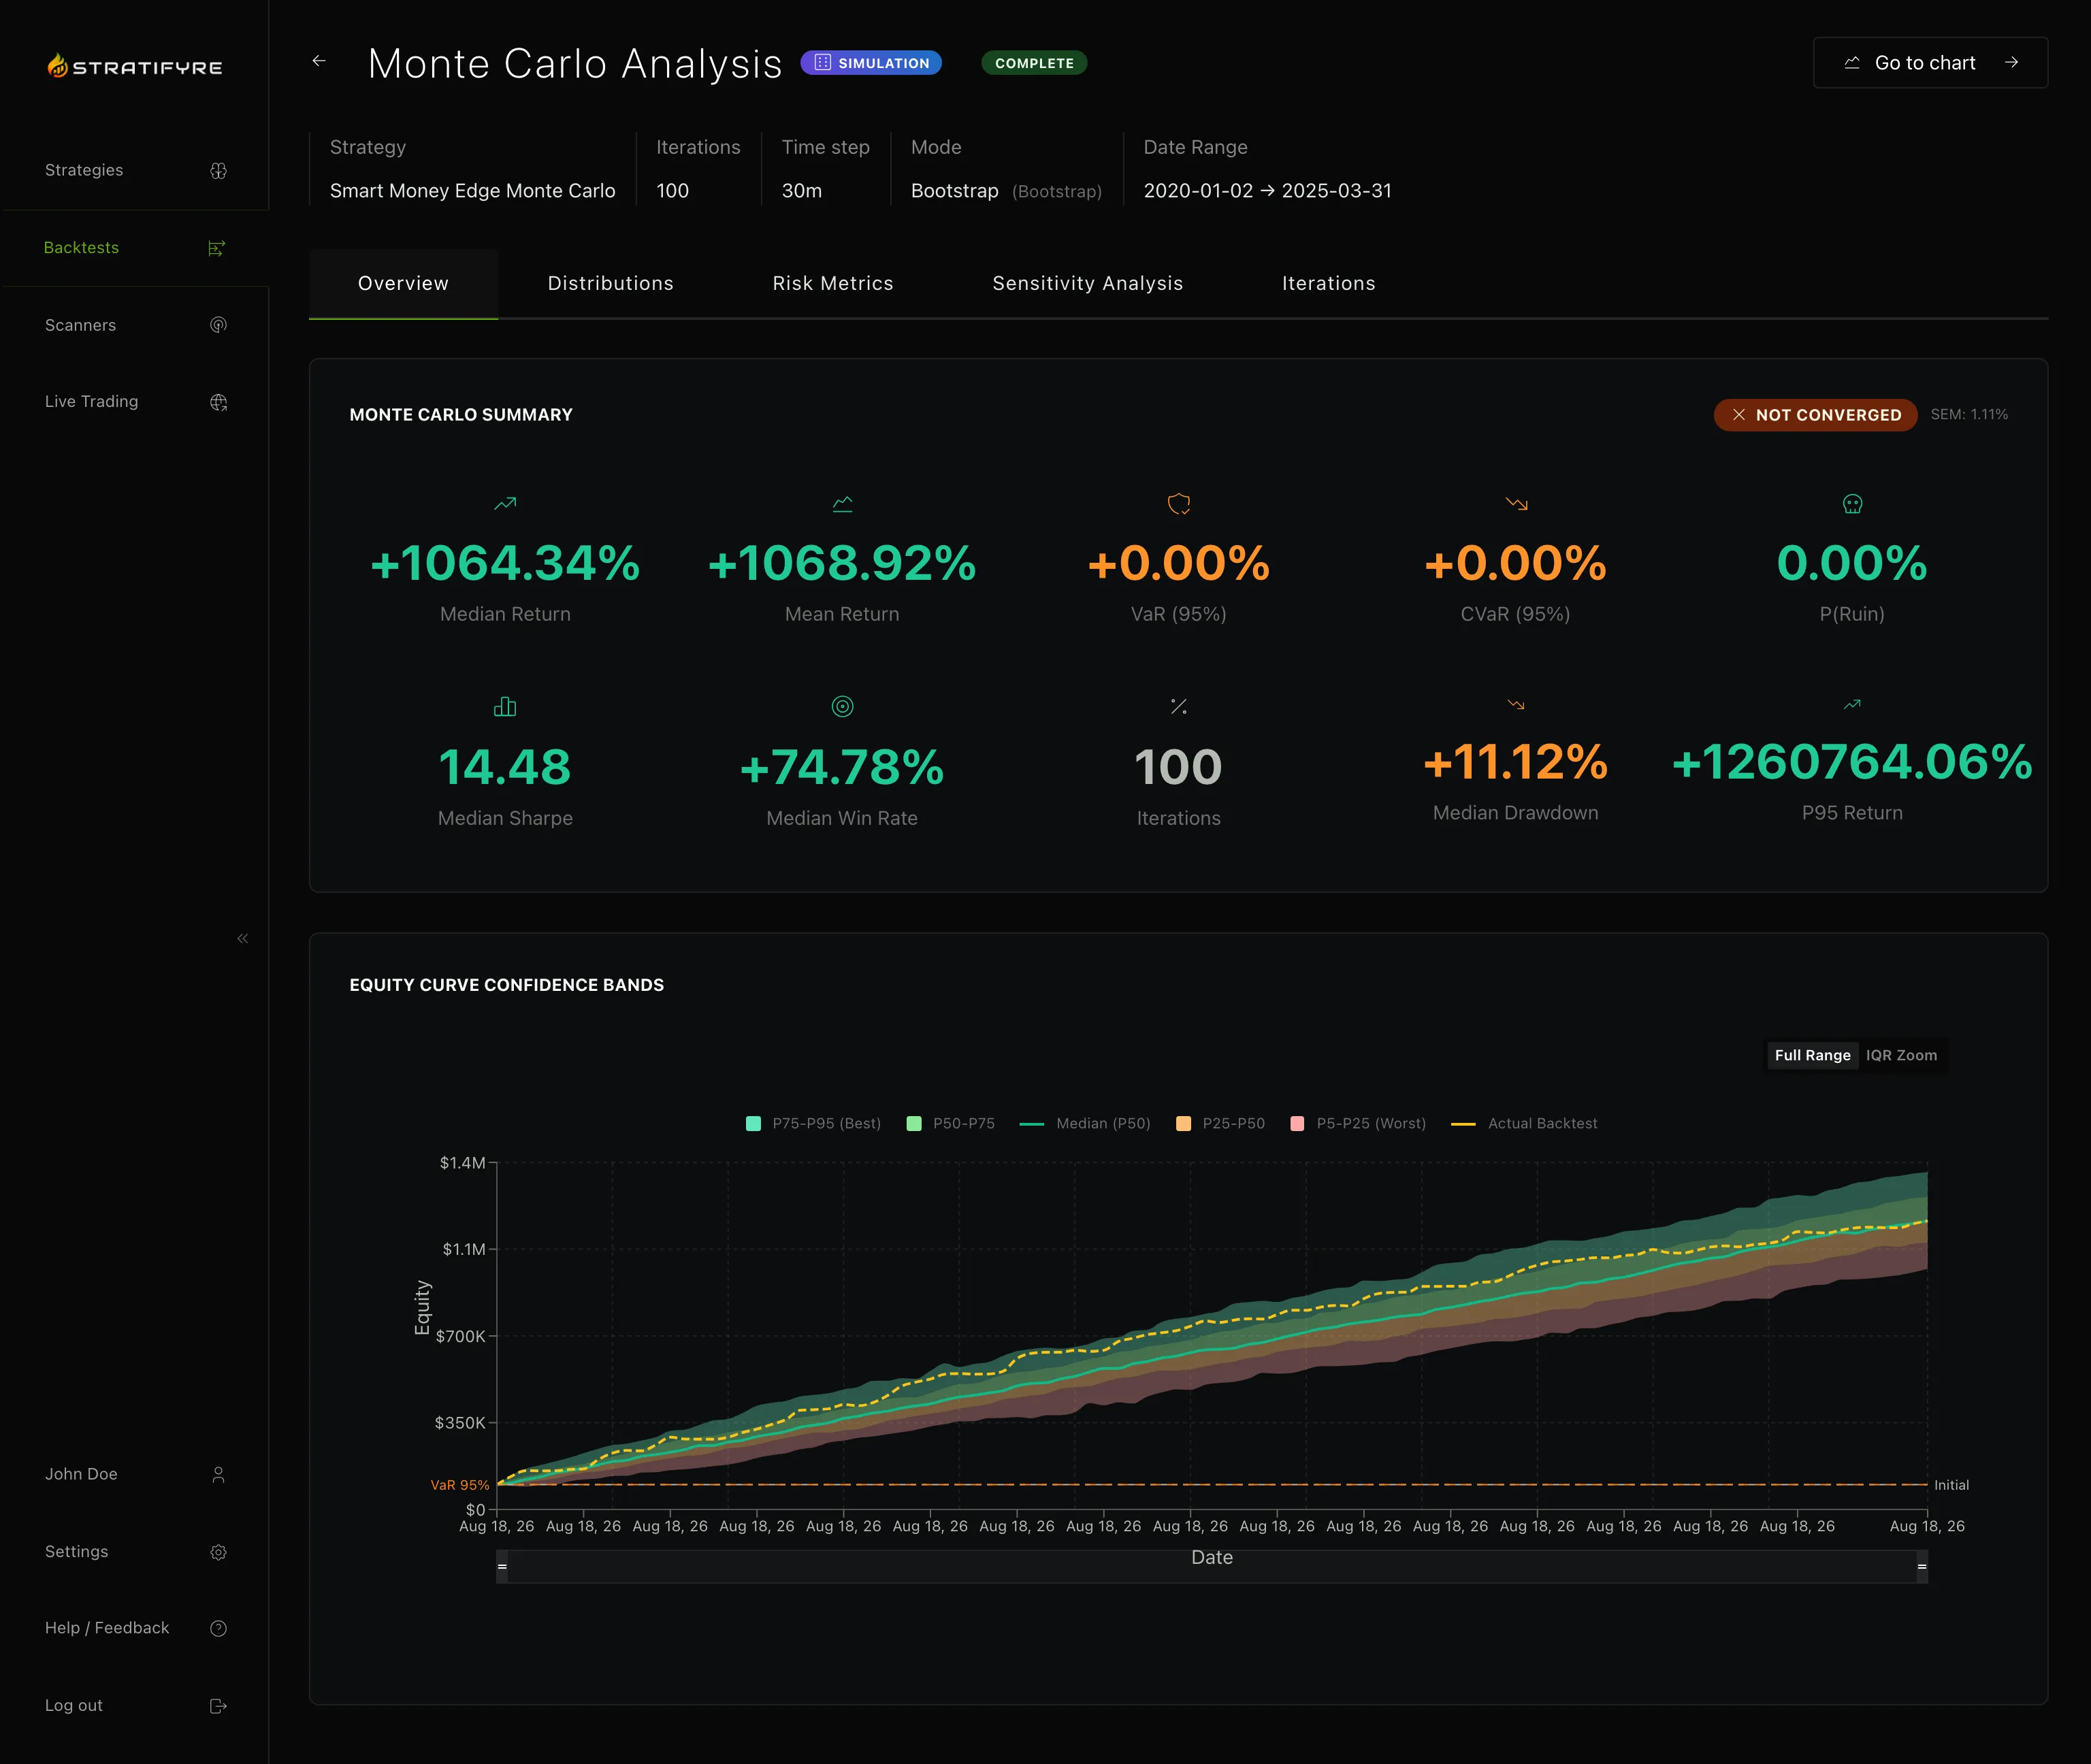
Monte Carlo confidence bands
Sharpe, Sortino ratios
Sharpe, Sortino + VaR/CVaR tail risk
Trade log export
Full audit log + Strategy Replay timeline
After-tax equity curves built in. Compare pre-tax and post-tax performance without external spreadsheets.
Step through your backtest trade-by-trade with full market context. Understand why specific trades performed the way they did.
MAE/MFE scatter plots show exit efficiency patterns. Identify if stop loss or take profit adjustments would improve results.
Stratifyre shows benchmark comparisons and provides guidance for each metric. You can also compare against your own risk tolerance.
Start with the 4 risk factors above. Those alone surface most of the gap between backtest and live performance.
Yes. Risk metrics apply to stocks, futures, crypto, forex. Tax treatment varies by asset class (e.g., Section 1256 for futures).
Generate PDF tearsheets with all risk metrics, charts, and analysis. Perfect for documentation or sharing with partners.

Tax impact. Drawdown duration. Trade quality. Statistical validation. The extended risk analysis that institutional traders expect—now accessible for independent traders.