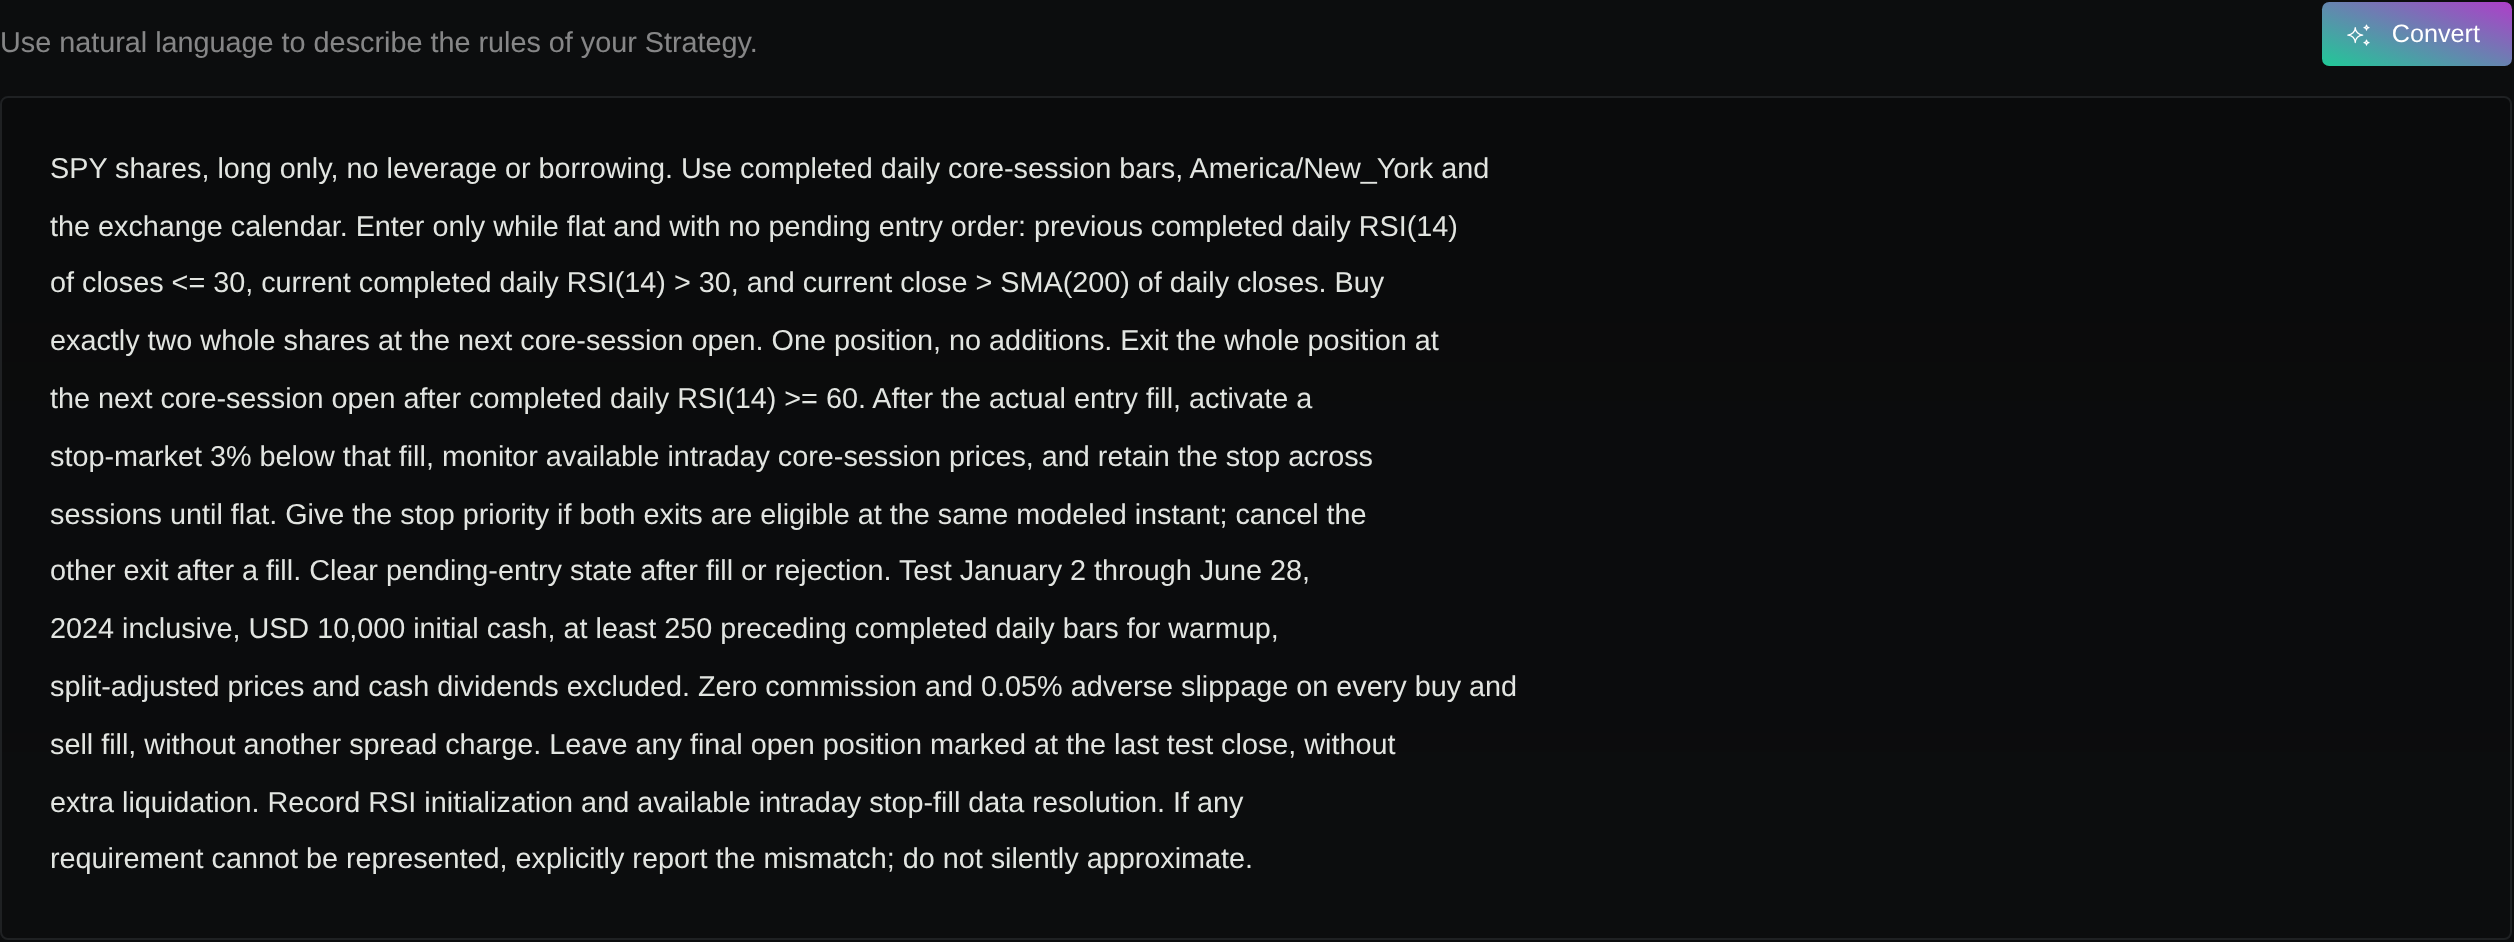
Slippage stress tests: how much cost can your backtest tolerate?
Fix your strategy assumptions, vary execution costs, and find the range where net profit disappears without mistaking a scenario for a fill forecast.
A backtest can make money before trading costs and lose money after them. The useful question is how far costs can rise before the result changes, and whether that margin is large enough to justify further research.
A slippage stress test answers this by rerunning one strategy across a small, prespecified cost range. Keep the rules, data, sizing and execution timing fixed. Change one cost assumption, retain every result, and identify the interval where net profit crosses zero.
The arithmetic example below is hypothetical. It explains the method; its numbers are not measured Stratifyre backtest results or estimates of future fills.
Separate commissions, spread and slippage
These costs need different inputs:
- Commission: an explicit charge from the broker or venue. It may apply per order, per unit or as a percentage of traded value. Check entry and exit charges separately.
- Spread: the distance between the bid and ask. A buy at the ask and a sale at the bid can lose money even if the market midpoint stays unchanged.
- Slippage: the difference between a specified reference price and the actual fill. State the reference: signal price, arrival price, midpoint or an already executable bid/ask price.
That reference matters. If a simulated buy already fills at the ask, adding another full spread as a separate charge counts overlapping costs. If it fills at a trade-bar price, an added execution adjustment may need to represent spread crossing as well as adverse movement. QuantConnect’s fill-model documentation distinguishes the base fill price, spread treatment and additional slippage.
Use a short cost ledger: base fill reference, explicit fees, spread treatment and additional price adjustment. Assign each effect once. Keep borrowing, funding and contract-roll costs separate when they apply; a larger slippage input does not automatically model them correctly.
Write down the units before changing a setting
One basis point, or 1 bp, is 0.01%. A 5 bp adverse adjustment is 0.05% of price: at a hypothetical $100 reference price, a market buy becomes $100.05 and a market sell becomes $99.95. Entry and exit each incur their own adjustment.
For a percentage-based model with unchanged quantities, the dollar cost is:
Additional cost = sum of affected fill notionals × bps / 10,000.
Sum buys and sells. Do not divide turnover by two and then apply a per-side cost once. A $10,000 purchase followed by a $10,000 sale represents $20,000 of traded notional; 5 bp on each side costs $10 in total.
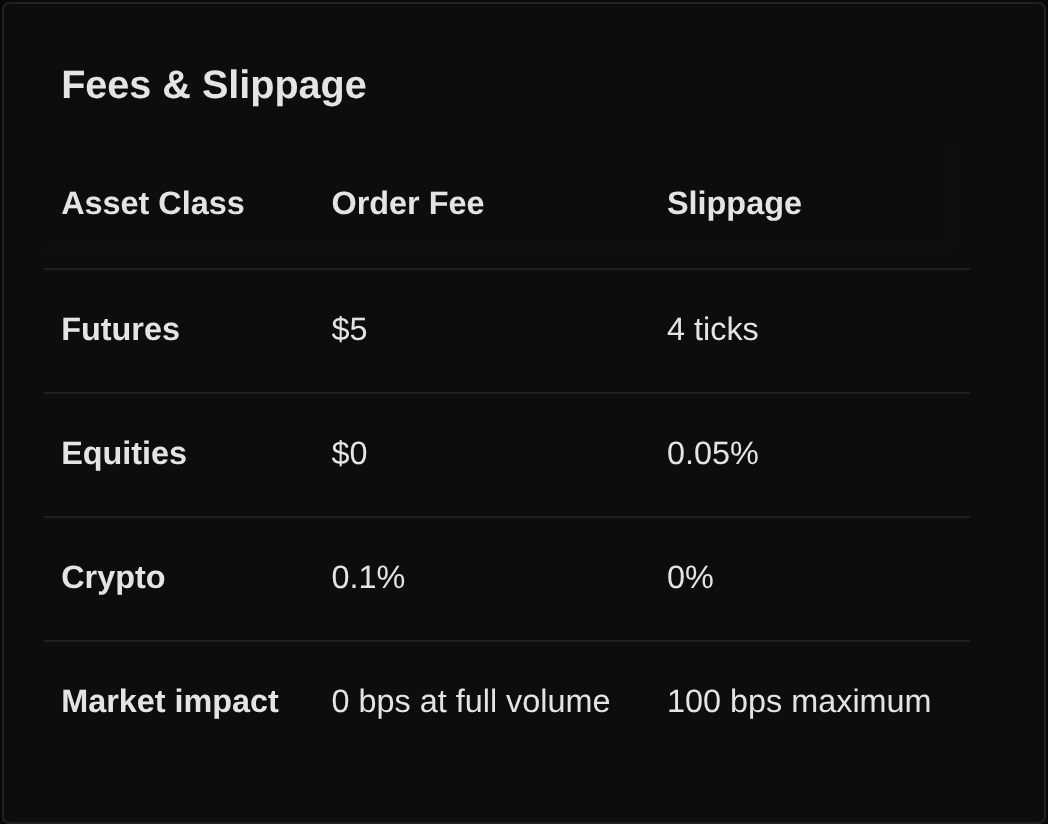
Stratifyre’s backtest Advanced settings label equities and crypto slippage as percentages, and futures slippage as ticks. For a percentage field, 0.05 means 0.05%, or 5 bp, rather than a 5% fraction. For futures, translate a tick assumption using the exact contract’s tick size, multiplier and quantity; a tick count is not a dollar amount.
Platforms use different conventions. For example, TradingView’s broker emulator specifies slippage in ticks for market and stop orders. Copying its input into a percentage field would change the experiment.
Fix the experiment before running variants
Choose one existing strategy and save a baseline configuration. Record:
- Exact entry and exit rules, including indicator parameters and warmup.
- Instrument and venue, historical dates, bar interval, trading session and timezone.
- Initial capital, quantity or sizing rule, leverage and shorting permissions.
- Signal evaluation timing, order types, fill mode and treatment of positions still open at the end.
- Commissions, spread treatment, volume limits and any quantity-dependent market impact.
Choose the cost range before reading new results. A teaching range for a percentage model might be 0, 2, 5 and 10 bp per affected side. These are scenarios, not recommended estimates for any market. Use instrument-specific quotes and your own execution records to choose a relevant range.
In Stratifyre, keep the other Advanced settings unchanged and vary the relevant asset-class slippage input. Do not switch from bar-close fills to a different timing model during the same comparison. Keep market impact fixed too: changing both static slippage and impact prevents you from isolating either effect.
Zero additional slippage is a diagnostic baseline. It does not establish that execution is free, especially when commissions or spread costs are still present.
An executed Bitcoin slippage comparison
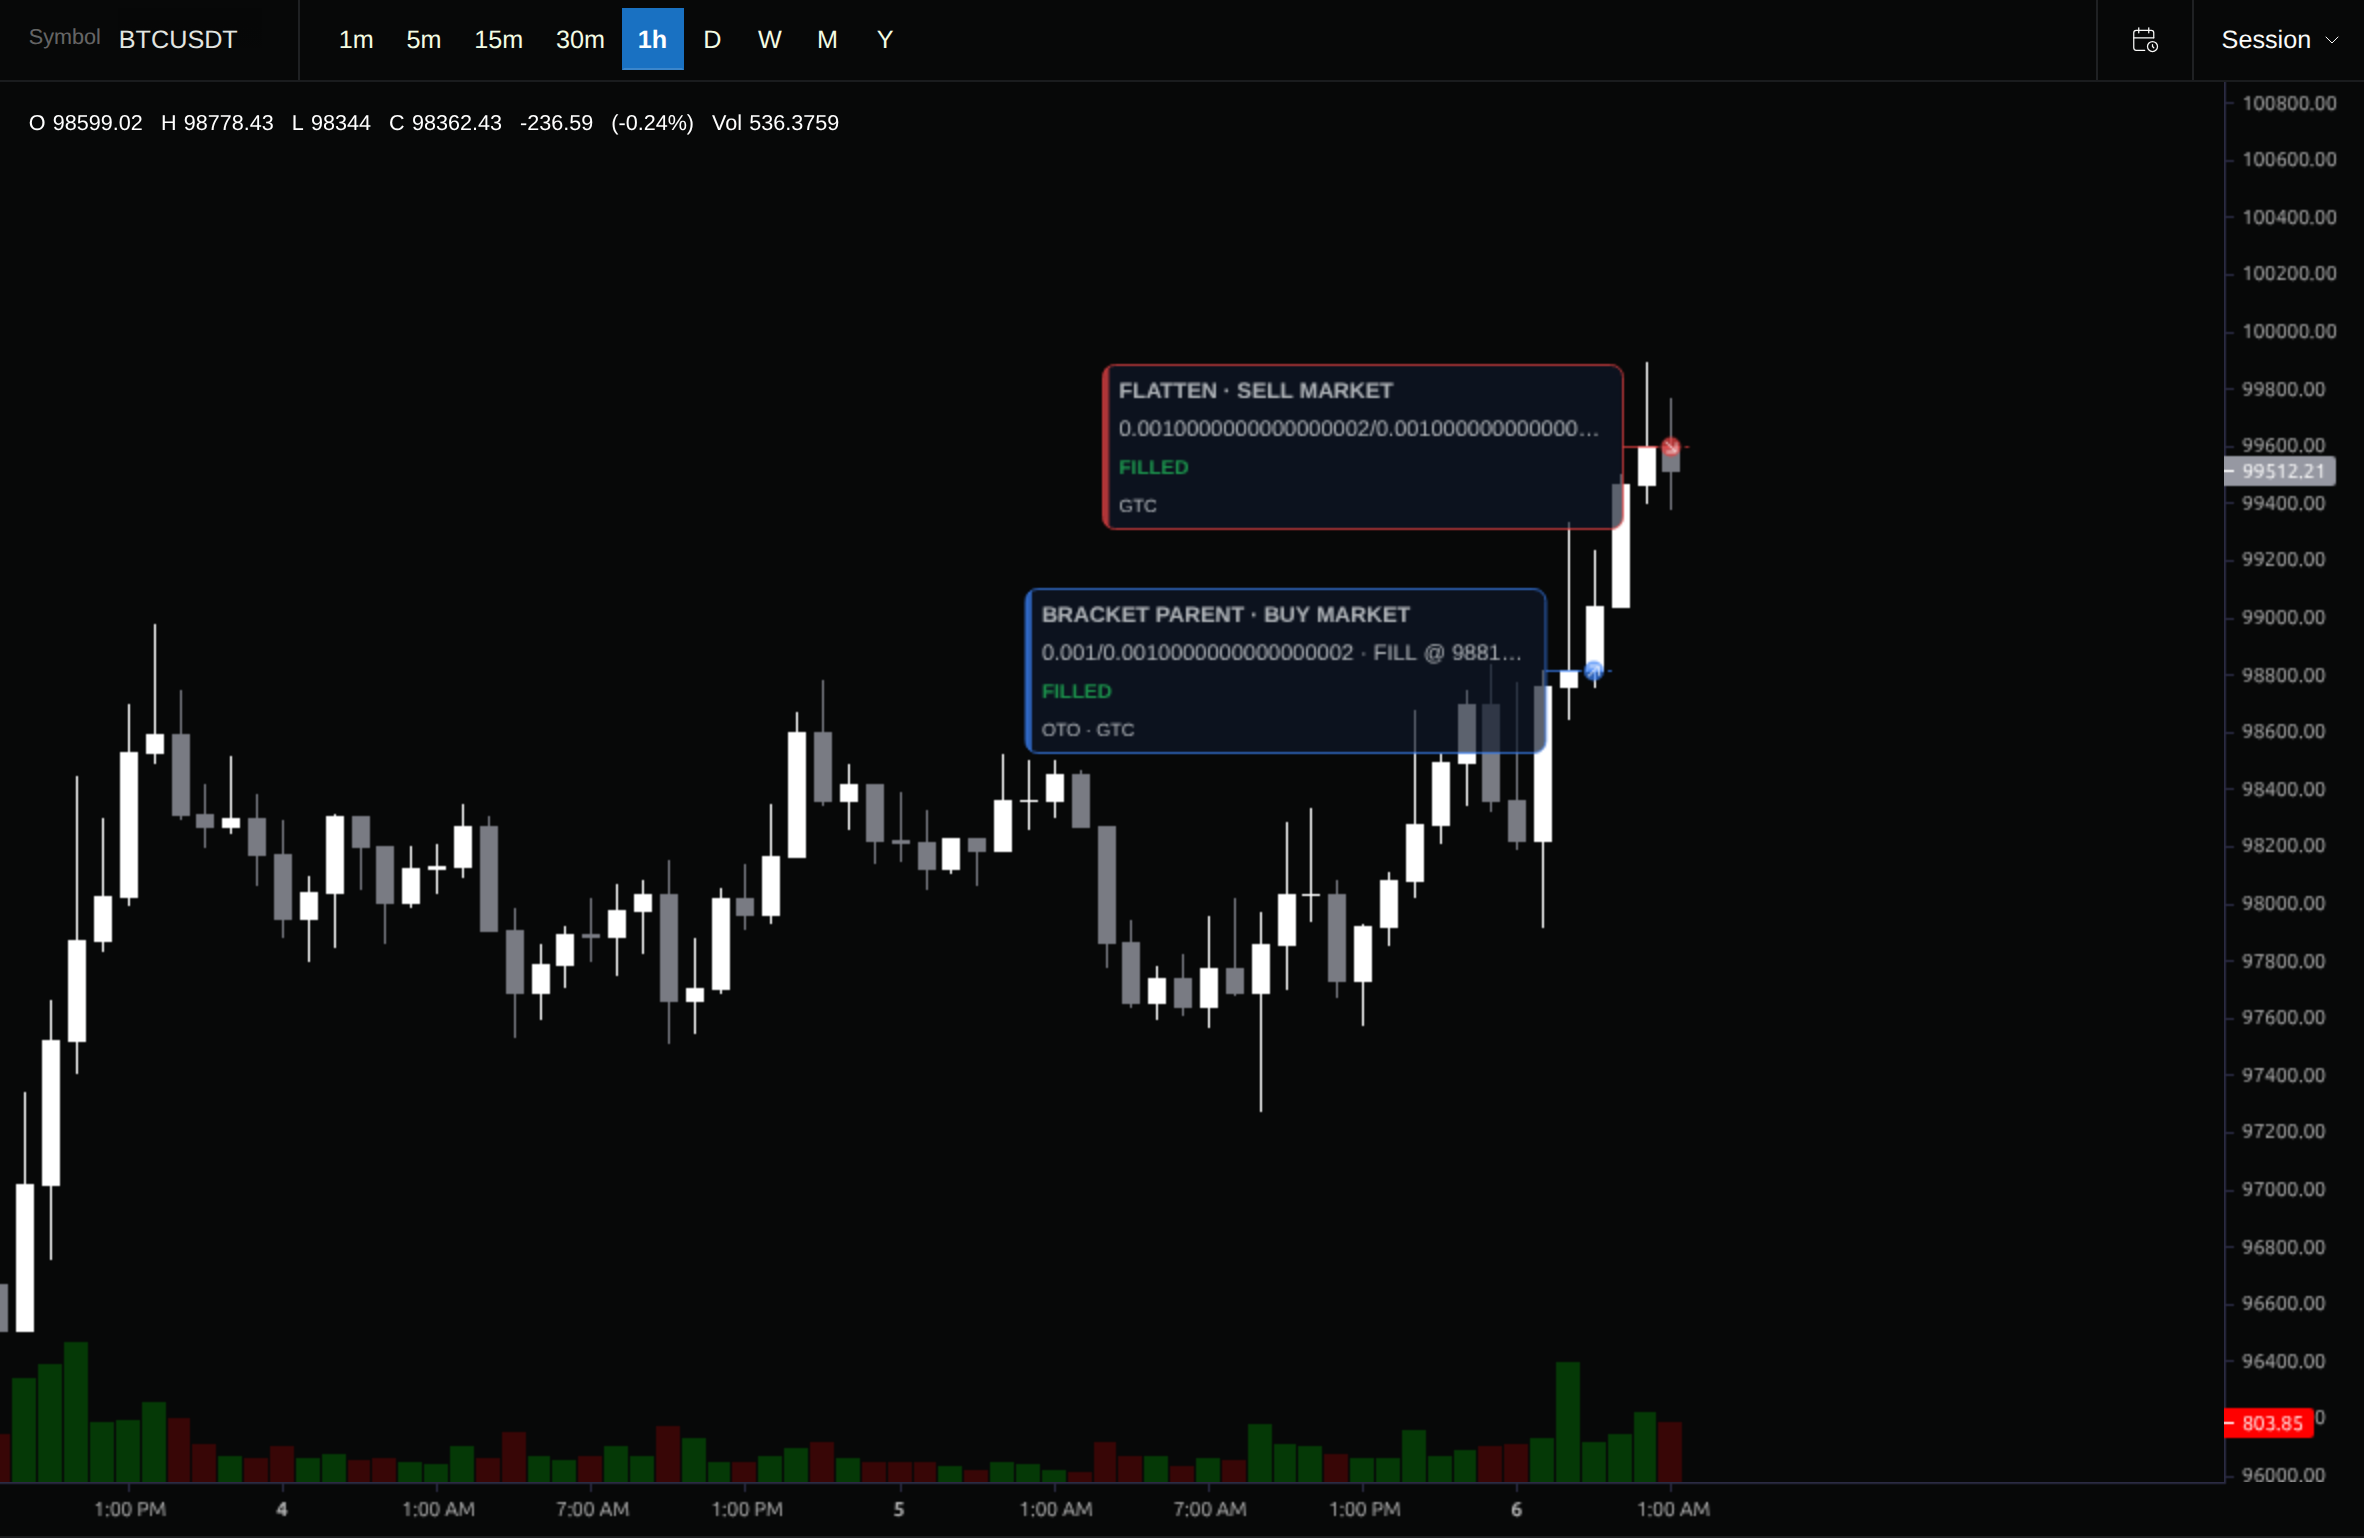
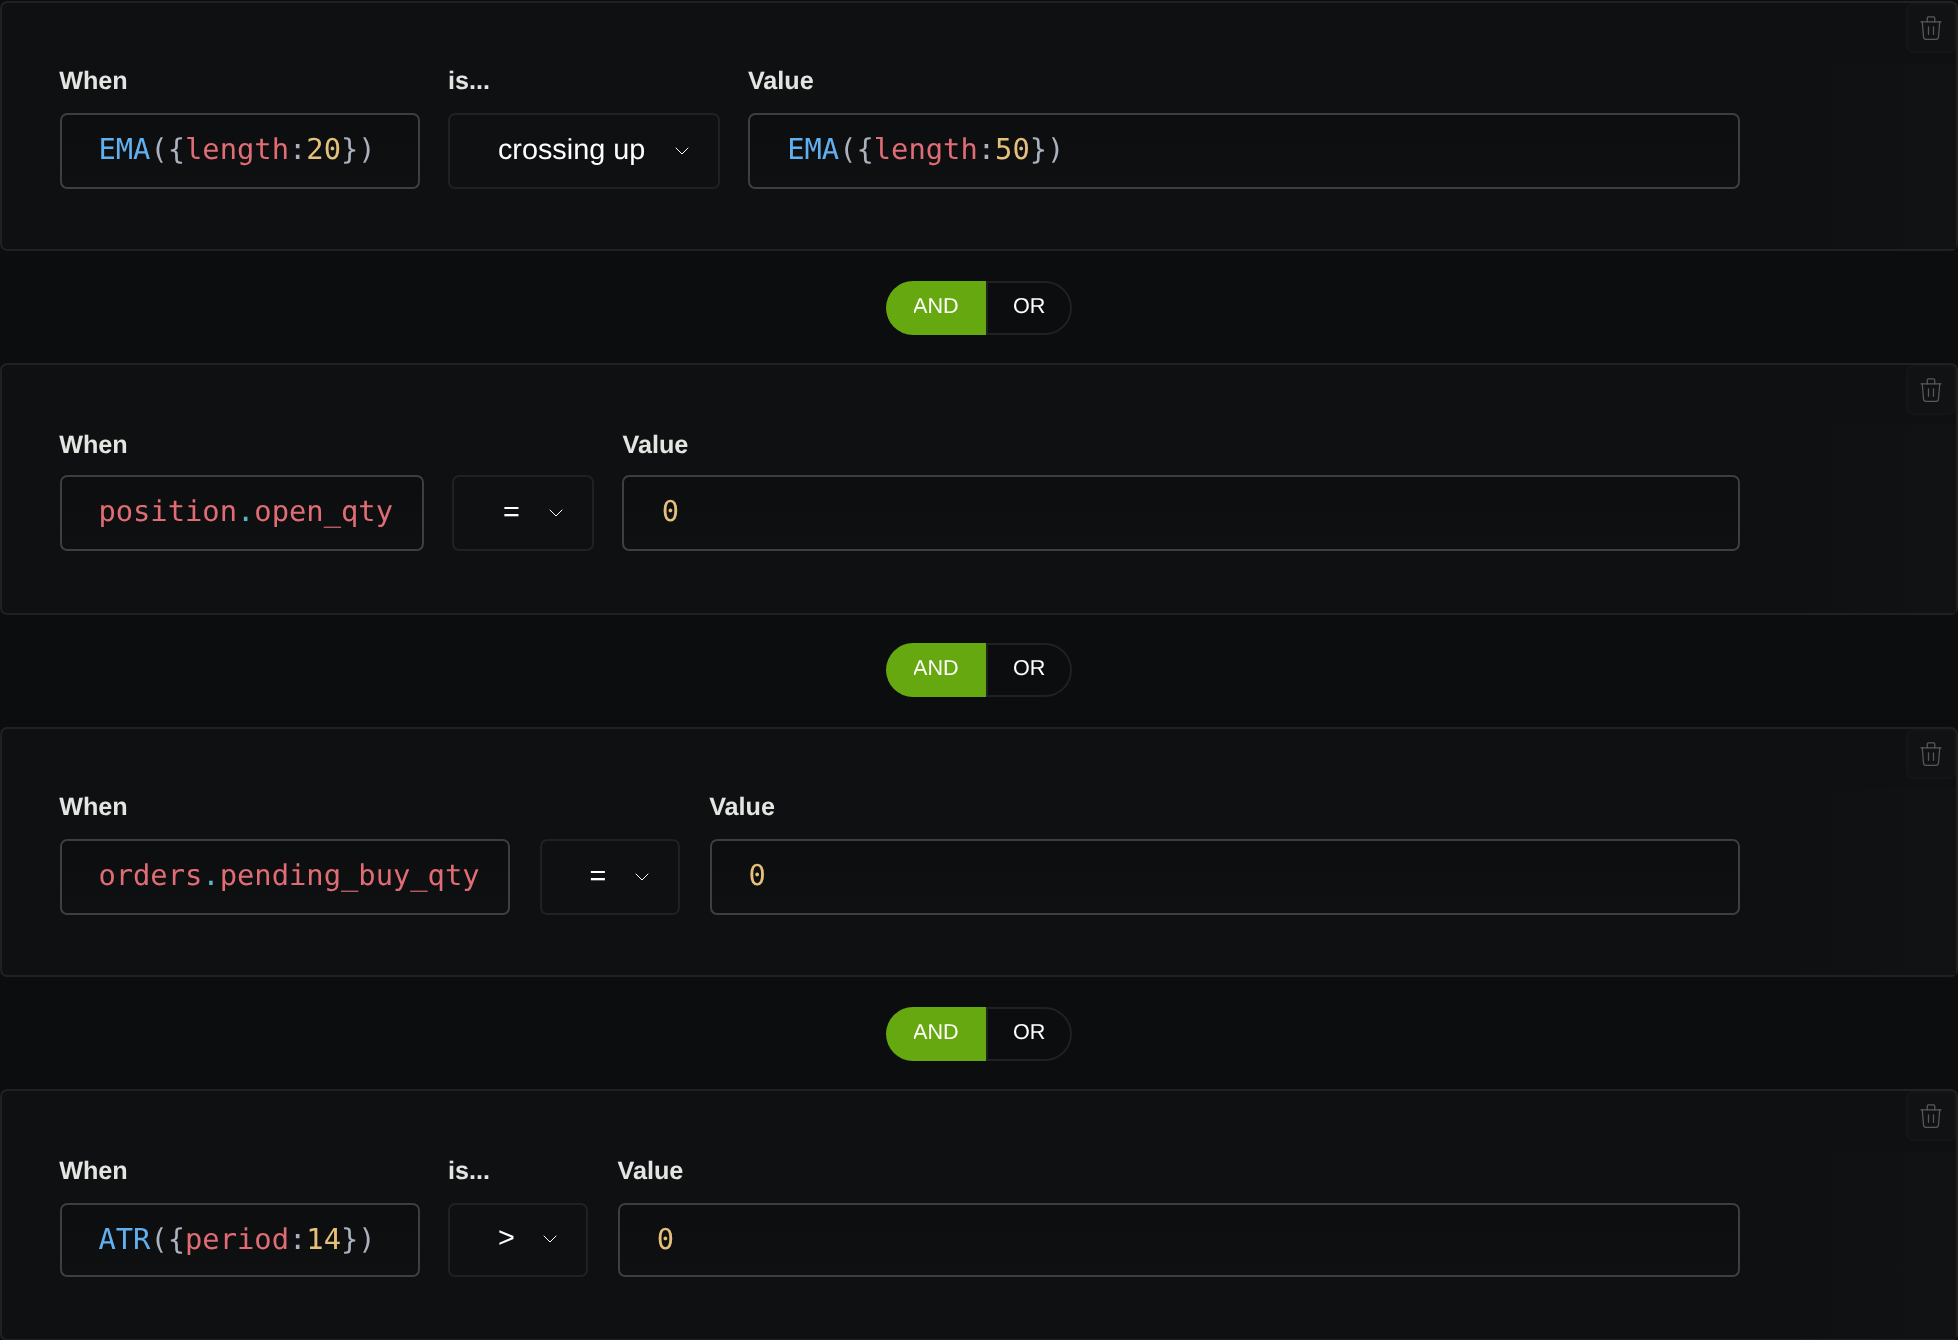
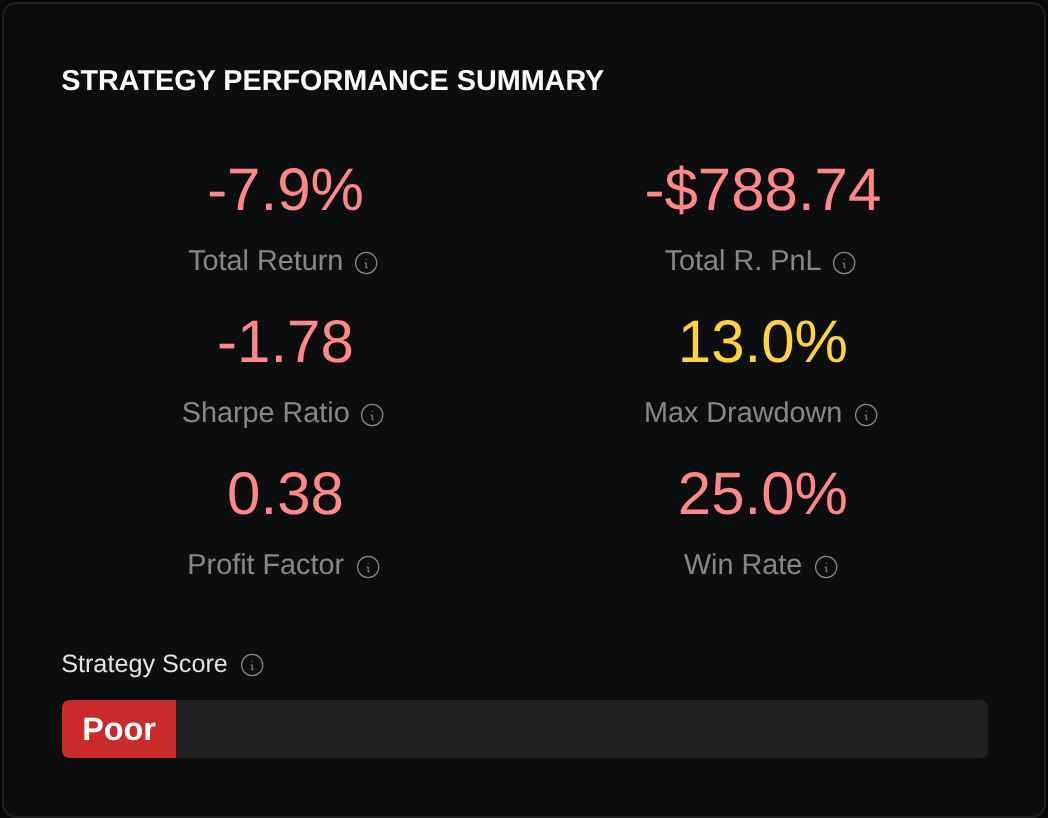
We ran the same saved EMA(20)/EMA(50) crossover rules on Binance BTC/USDT hourly bars from January 1 through March 31, 2025. Every run started with $10,000, bought a fixed 0.05 BTC while flat, flattened on the reverse crossover and used On-Open execution. Only crypto slippage changed: 0%, 0.02%, 0.05% and 0.10%, equivalent to 0, 2, 5 and 10 bp per side. These are demonstration scenarios, not recommended execution estimates.
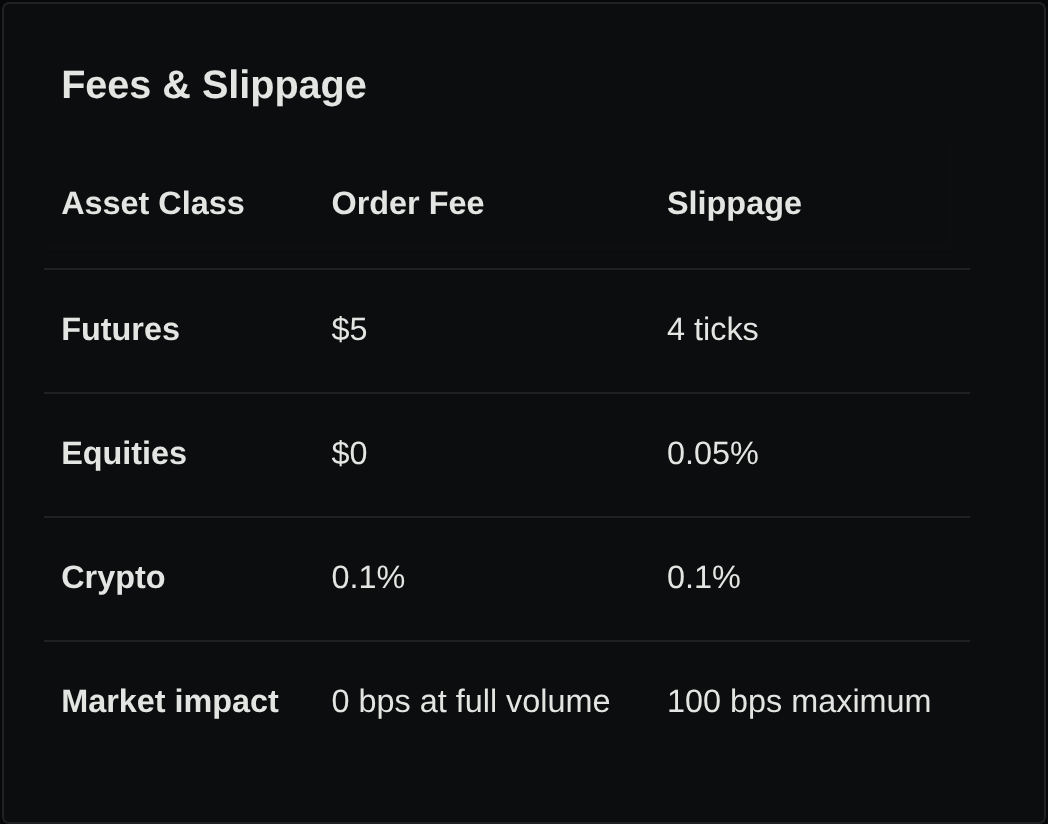
All four reports completed with 24 trades. Their entry and exit timestamps, directions and quantities match; adverse entry and exit prices change with the selected slippage. Every returned trade fee is zero despite the configured commission, so these are reported outcomes with changed slippage, not verified after-commission results.
| bp/side | Reported P&L | Max drawdown |
|---|---|---|
| 0 bp | −$562.85 | 11.33% |
| 2 bp | −$608.02 | 11.65% |
| 5 bp | −$675.79 | 12.14% |
| 10 bp | −$788.74 | 12.95% |
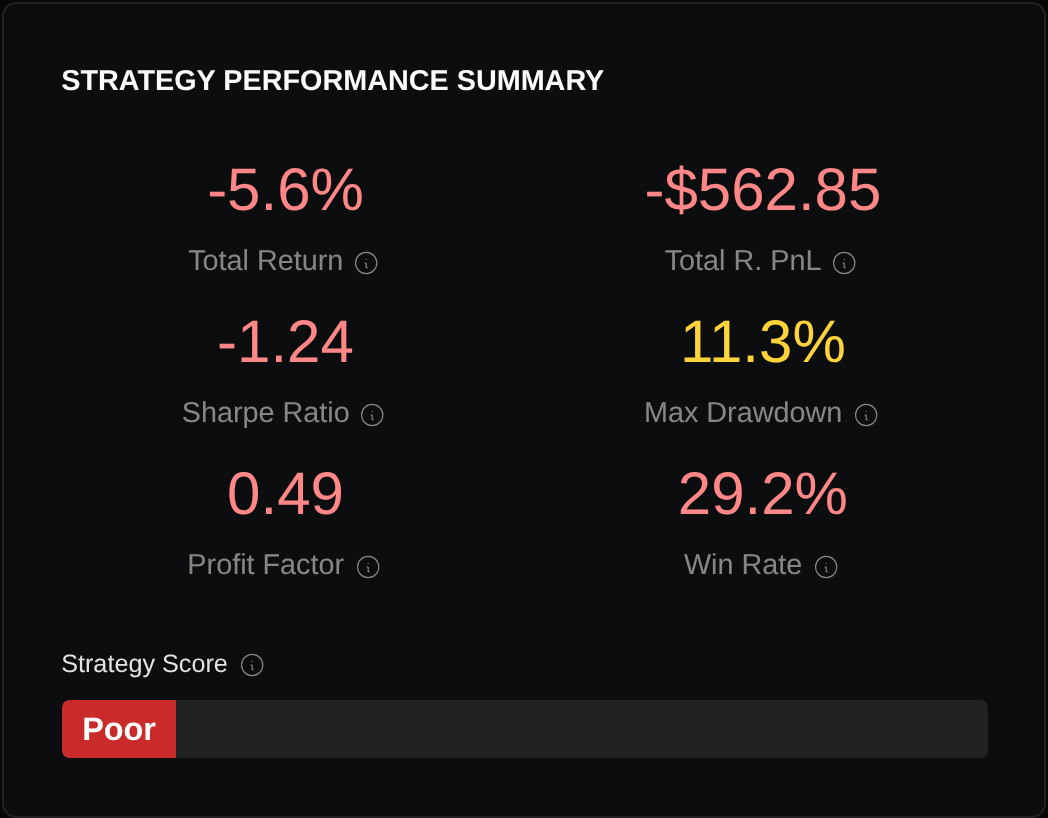
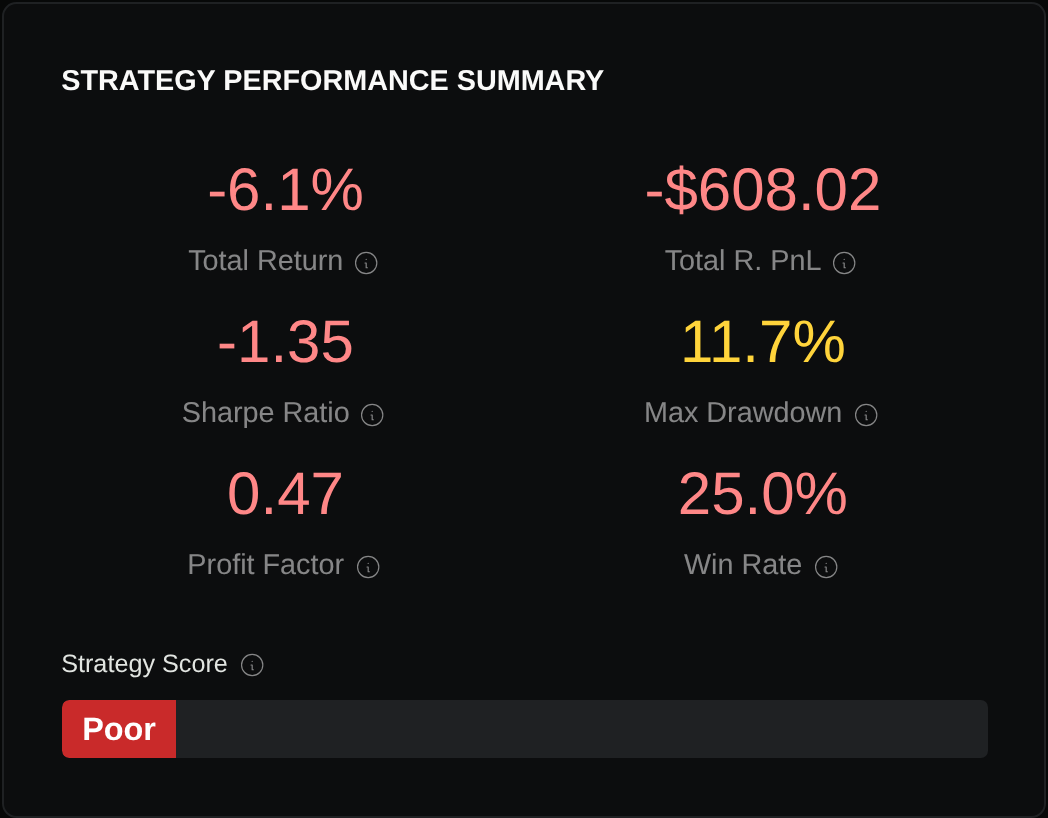
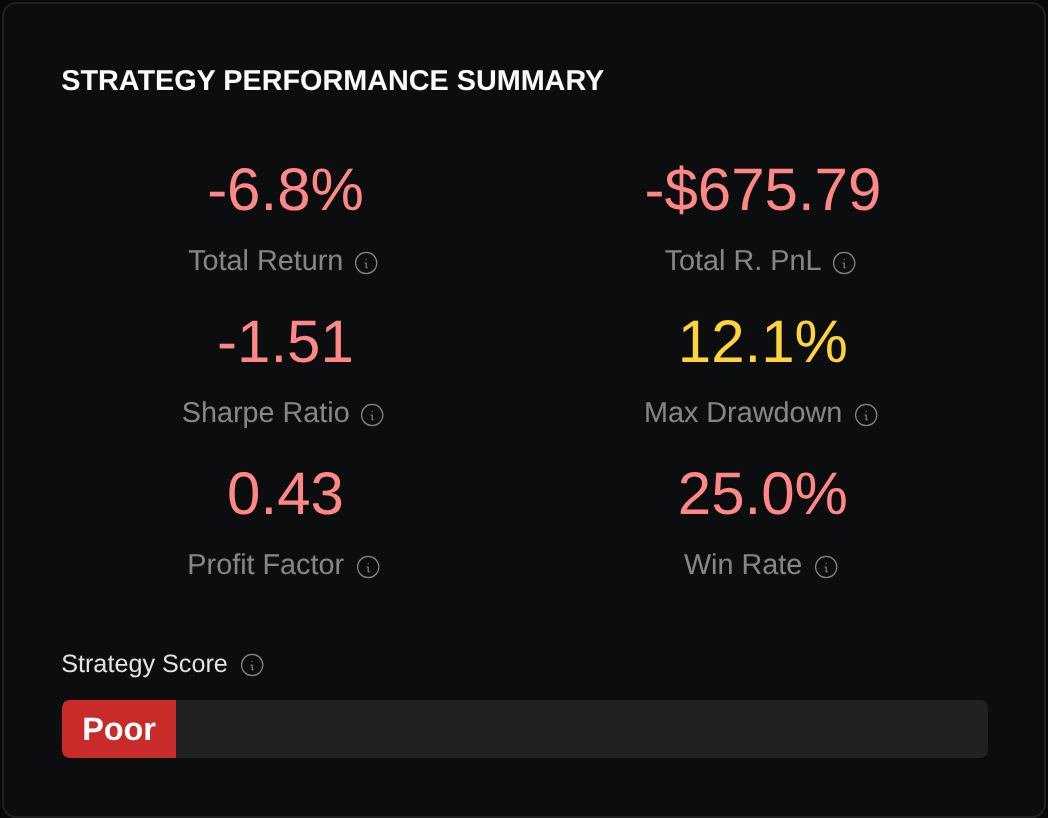
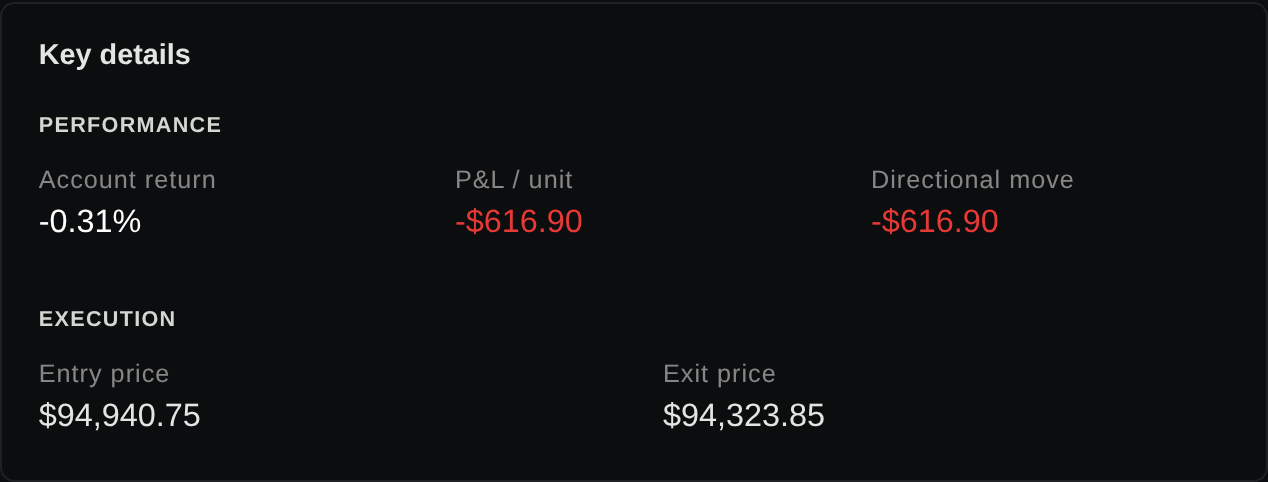
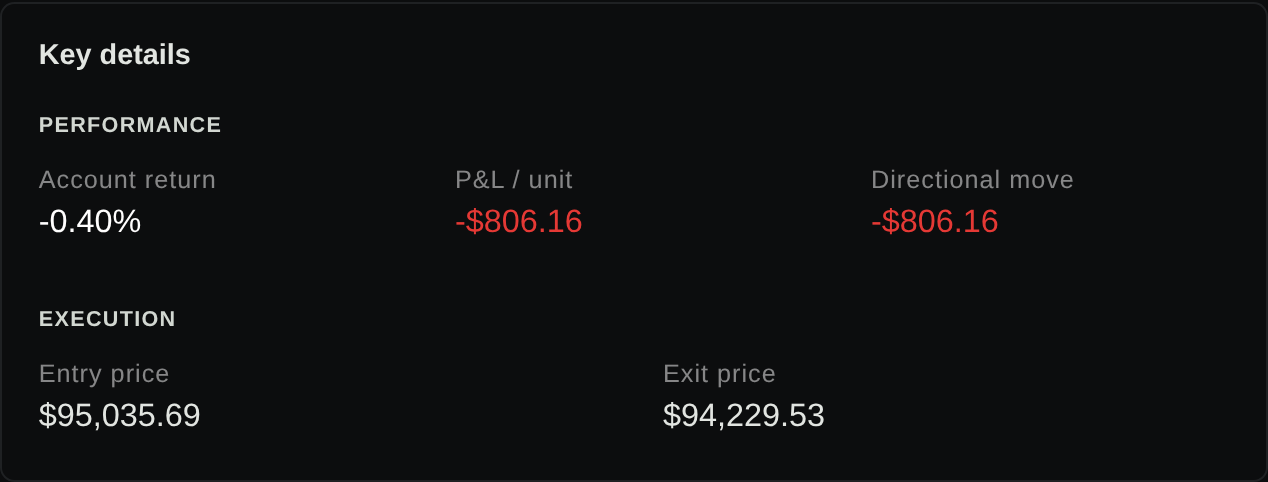
The first matched trade entered at January 11, 2025, 22:00 UTC and exited at January 12, 08:00 UTC. With zero slippage its entry and exit were $94,940.75 and $94,323.85. At 10 bp they were $95,035.69 and $94,229.53: a higher buy and a lower sale for the same 0.05 BTC. Its loss changes from $30.84 to $40.31; the screenshots’ P&L/unit fields show price differences before multiplying by quantity.
A hypothetical break-even calculation
Suppose a fabricated fill ledger contains 100 completed trades, each with one entry order and one exit order. Its inputs are:
- Initial capital: $20,000.
- Gross profit before the modeled costs: $1,800.
- Commission: $1 per order, totaling $200.
- Sum of entry and exit reference-price notionals: $2,000,000.
For this calculation only, all fills, quantities and the commission total stay fixed. The additional adverse price adjustment includes any spread allowance; there is no separate spread deduction. Taxes, borrowing, funding and other costs are excluded.
| bp/side | Cost | Net profit |
|---|---|---|
| 0 bp | $0 | $1,600 |
| 2 bp | $400 | $1,200 |
| 5 bp | $1,000 | $600 |
| 10 bp | $2,000 | −$400 |
For example, 5 bp costs $2,000,000 × 5 / 10,000 = $1,000. Subtracting that and the $200 commission from $1,800 leaves $600.
These hypothetical scenarios bracket break-even between 5 and 10 bp. With this fixed ledger, the exact arithmetic threshold is:
Break-even bps = (gross profit − fixed costs) ÷ affected notional × 10,000.
For this ledger: ($1,800 − $200) ÷ $2,000,000 × 10,000 = 8 bp per side.
Eight basis points is the threshold of this invented ledger. It is not a tolerable-cost estimate for a tested strategy. The table cannot supply drawdown because it contains no chronological equity path.
Read the reruns beyond net profit
For real runs, compare net profit or return, maximum drawdown, completed trades, traded notional and the order types that changed. Use the same definitions in every report. Here, turnover means the sum of entry and exit traded notional across the test, rather than an annualized portfolio turnover ratio.
Higher costs can alter quantities, buying power, partial fills or later signals that depend on position state. Keeping the sizing rule fixed does not guarantee identical executed sizing. If turnover or trade count changes, the fixed-ledger formula becomes an approximation; use the completed reruns to establish the actual bracket.
Maximum drawdown also depends on when costs occur. A strategy can finish profitable while spending too long below its previous equity peak. Set a drawdown limit before comparing variants so a positive ending balance does not become the only acceptance criterion.
If adjacent completed runs move from positive to negative net profit, report their cost interval. Refine it with a smaller prespecified range if needed. If results do not worsen monotonically, report every observed sign change rather than a single cost threshold. If all tested runs remain profitable, no break-even was observed at those values; untested values may still behave differently. If all lose money, none of the tested values established a profitable cost allowance.
Inspect the orders behind the sensitivity
Start with trades whose fills change most. Are they market entries, triggered stops or limit orders? US equity market orders do not guarantee a price, and a stop order becomes a market order after triggering. Limit orders constrain execution price, but a price constraint is not evidence that the desired quantity was available. Investor.gov’s order guide explains these distinctions.
Treat limit-order behavior separately from market-order slippage. A limit-heavy strategy may appear insensitive because its fill prices remain constrained; inspect missed and partial fills before interpreting that as execution robustness. Bar data alone does not reveal your position in an exchange queue.
Finally, compare the tested cost allowance with recorded execution under similar instrument, session, size and order conditions. A uniform historical stress setting cannot forecast losses during every fast market, gap or liquidity shortage. Surviving the range supports further investigation; it does not establish future profitability.
Choose one strategy, preserve its baseline, and rerun a small cost range using the backtesting workflow. Record the first interval where net profit changes sign, alongside drawdown and turnover, before deciding whether the result has enough room for execution costs.
Put your strategy rules to the test
Build your strategy, inspect historical trades, and review the assumptions behind your results.
Build and test your strategy