Fixed-size vs. risk-based positions: compare sizing without changing your signals
Separate position allocation from planned loss at a stop, calculate shares and contracts correctly, and compare sizing policies without confusing size with entry quality.
A backtest can earn more simply because it buys more. Before crediting the entry rule, check whether the new sizing policy also changed exposure, costs, or the trades the account could afford.
Fixed quantity answers “how many units?” Risk-based sizing answers “how many units fit this planned loss budget?” Neither establishes that the signal is better. The opening examples use hypothetical arithmetic; the later AAPL demonstration includes real saved sizing expressions, matched completed backtests and actual trade quantities.
Allocation is not loss at the stop
Suppose a hypothetical account has $25,000 of equity and buys 100 shares at $50. The position has $5,000 of notional exposure, or 20% of equity. With an intended sell stop at $48, the price loss at that stop is $200, or 0.8% of equity, before costs.
The 20% allocation and 0.8% planned loss describe different things. Move the stop to $45 without changing quantity, and the planned price loss becomes $500. Neither the invested amount nor the share count changed.
CME’s position-sizing lesson connects sizing to both the stop location and the account’s loss budget. Select a stop using the strategy’s logic before calculating quantity; moving the stop merely to make a desired quantity fit changes the strategy.
Calculate quantity from a defined budget
For a linear instrument whose price changes translate proportionally into profit and loss, define:
| Input | Meaning |
|---|---|
| E | Equity measured before the proposed entry |
| r | Chosen budget fraction, written as a decimal |
| D | Absolute entry-to-stop price distance |
| M | Account-currency value of a one-point move per unit |
| c | Estimated round-trip fees and slippage per unit |
| F | Estimated fixed costs for the trade |
| L | Permitted quantity increment |
The calculation is:
B = E × rA = D × M + cQraw = (B − F) / AQ = L × floor(Qraw / L)Here A is the per-unit loss allowance, Qraw is the unrounded quantity, and Q is the rounded quantity.
Use an entry estimate available at sizing time and a stop on a valid price tick: below entry for a long, above entry for a short. Recalculate risk after the actual fill; using that future fill to choose the original quantity would introduce hindsight.
Skip the entry if the budget does not exceed fixed costs, the distance is invalid or zero, or rounding leaves less than one permitted increment. Round down, then recalculate the planned loss using the rounded quantity. Rounding to the nearest lot can exceed the budget.
All amounts must share one account currency. For USD shares in a USD account, M is $1 per $1 price move per share. A non-USD instrument needs a documented currency conversion. Inverse contracts and options need their own payoff calculations; this linear formula is not a universal sizing model.
The budget is a research assumption. Decide whether E means starting equity or current equity, including unrealized profit and loss. Starting equity produces a fixed dollar budget; current equity makes later quantities depend on earlier outcomes.
Hypothetical shares: equal signals, different sizes
Keep the hypothetical equity at $25,000, the entry at $50, and the budget at 1%: $250. Assume whole shares, no fixed charge, and a made-up $0.10 per-share round-trip cost allowance. The baseline always buys 100 shares; the alternative divides $250 by the stop distance plus $0.10.
| Stop distance | Fixed loss | Risk-based shares | Risk-based loss |
|---|---|---|---|
| $1 | $110.00 | 227 | $249.70 |
| $2 | $210.00 | 119 | $249.90 |
| $5 | $510.00 | 49 | $249.90 |
Both loss columns include the hypothetical cost allowance; neither is a realized loss.
For the $2 stop, floor($250 ÷ $2.10) gives 119 shares. Their $5,950 notional exposure is 23.8% of equity; the planned loss including the allowance is $249.90. The baseline exposes $5,000 and plans for $210.00 of loss. Comparing only their dollar profits would hide that difference.
Fixed size changes risk as the stop widens
$25,000 equity · $250 risk budget · $0.10 cost allowance per share
View example data
| Stop distance | Fixed 100 shares | Risk-based size |
|---|---|---|
| $1 | 110.00 | 249.70 |
| $2 | 210.00 | 249.90 |
| $5 | 510.00 | 249.90 |
An optional stop rule could use a multiple of Average True Range. Fidelity describes ATR as a volatility measure that accounts for gaps, rather than a directional signal. If you choose an ATR stop, hold its period, multiple, warmup, and update timing constant in both variants; changing them would mix exit design with sizing.
Contracts: use point value, then enforce caps
Shares and futures contracts are not interchangeable units. CME’s Micro E-mini S&P 500 contract has a $5 point value and a 0.25-point outright tick worth $1.25. CME contract FAQ
In a hypothetical MES example, a ten-point stop therefore represents $50 per contract before costs. Assume an invented $4 round-trip cost allowance per contract and the same $250 budget:
A = 10 × 5 + 4 = $54Q = floor(250 / 54) = 44 × 54 = $2165 × 54 = $270Margin is a separate constraint. The amount required to hold a contract does not replace its stop-distance loss calculation. A risk-budget quantity can still exceed available buying power or your exposure limit.
Apply a notional cap, a maximum quantity, and available-capital constraints before submitting a proposed quantity. For the hypothetical $1 share stop above, 227 shares require $11,350 of exposure. A $10,000 notional cap reduces the quantity to 200 shares and the planned loss allowance to $220. Do not enlarge the stop or override the cap to spend the remaining budget.
Define how simultaneous signals share the budget. Three positions each planning to lose 1% do not become a portfolio with a 1% loss budget, and correlated positions may lose together. Record which signals were reduced or skipped and why.
Run two comparisons, because sizing can change the trade list
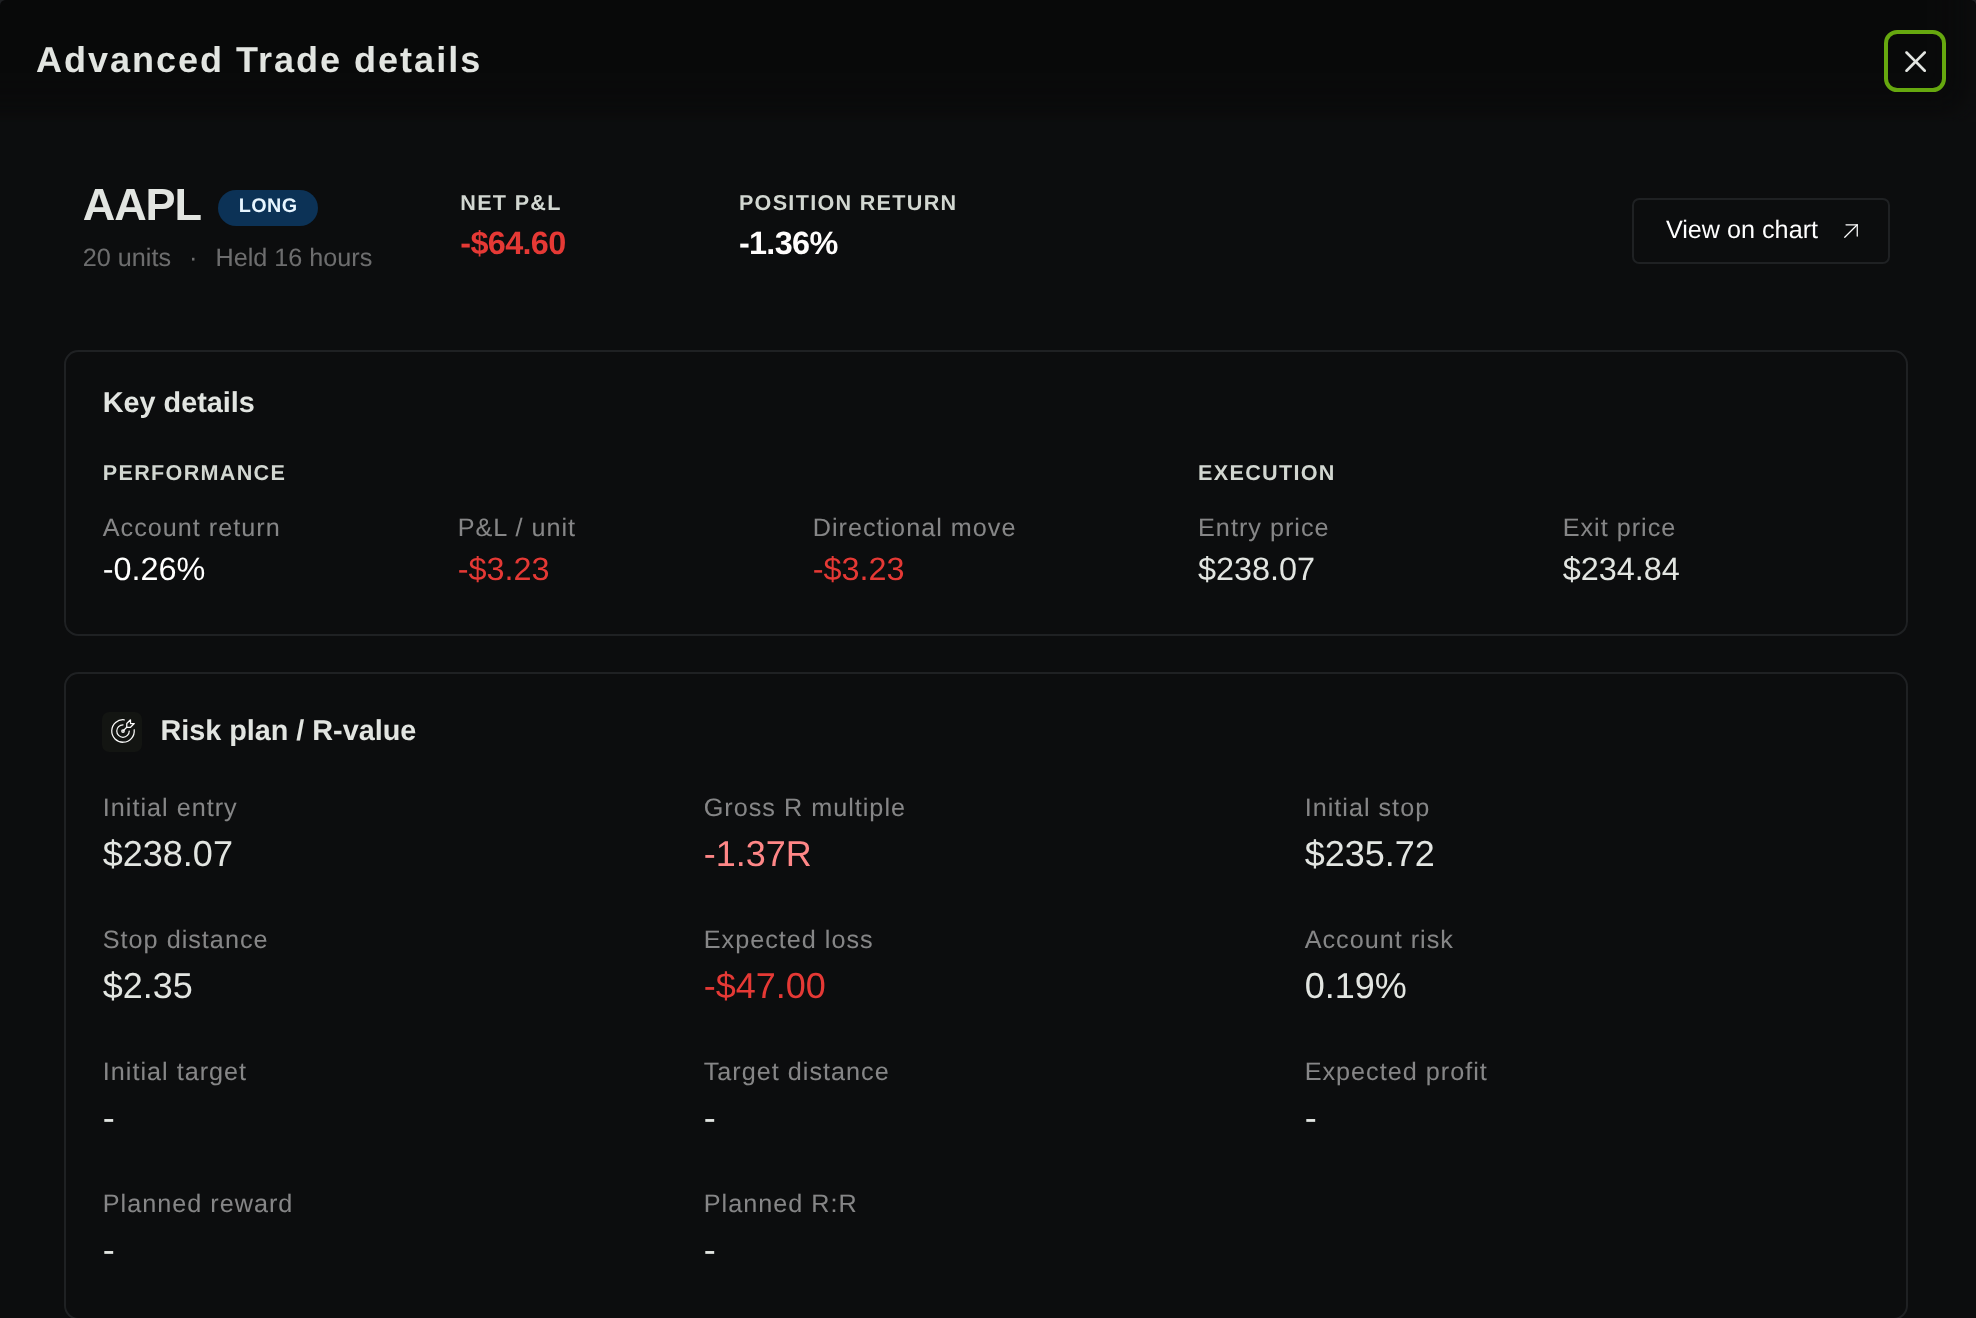
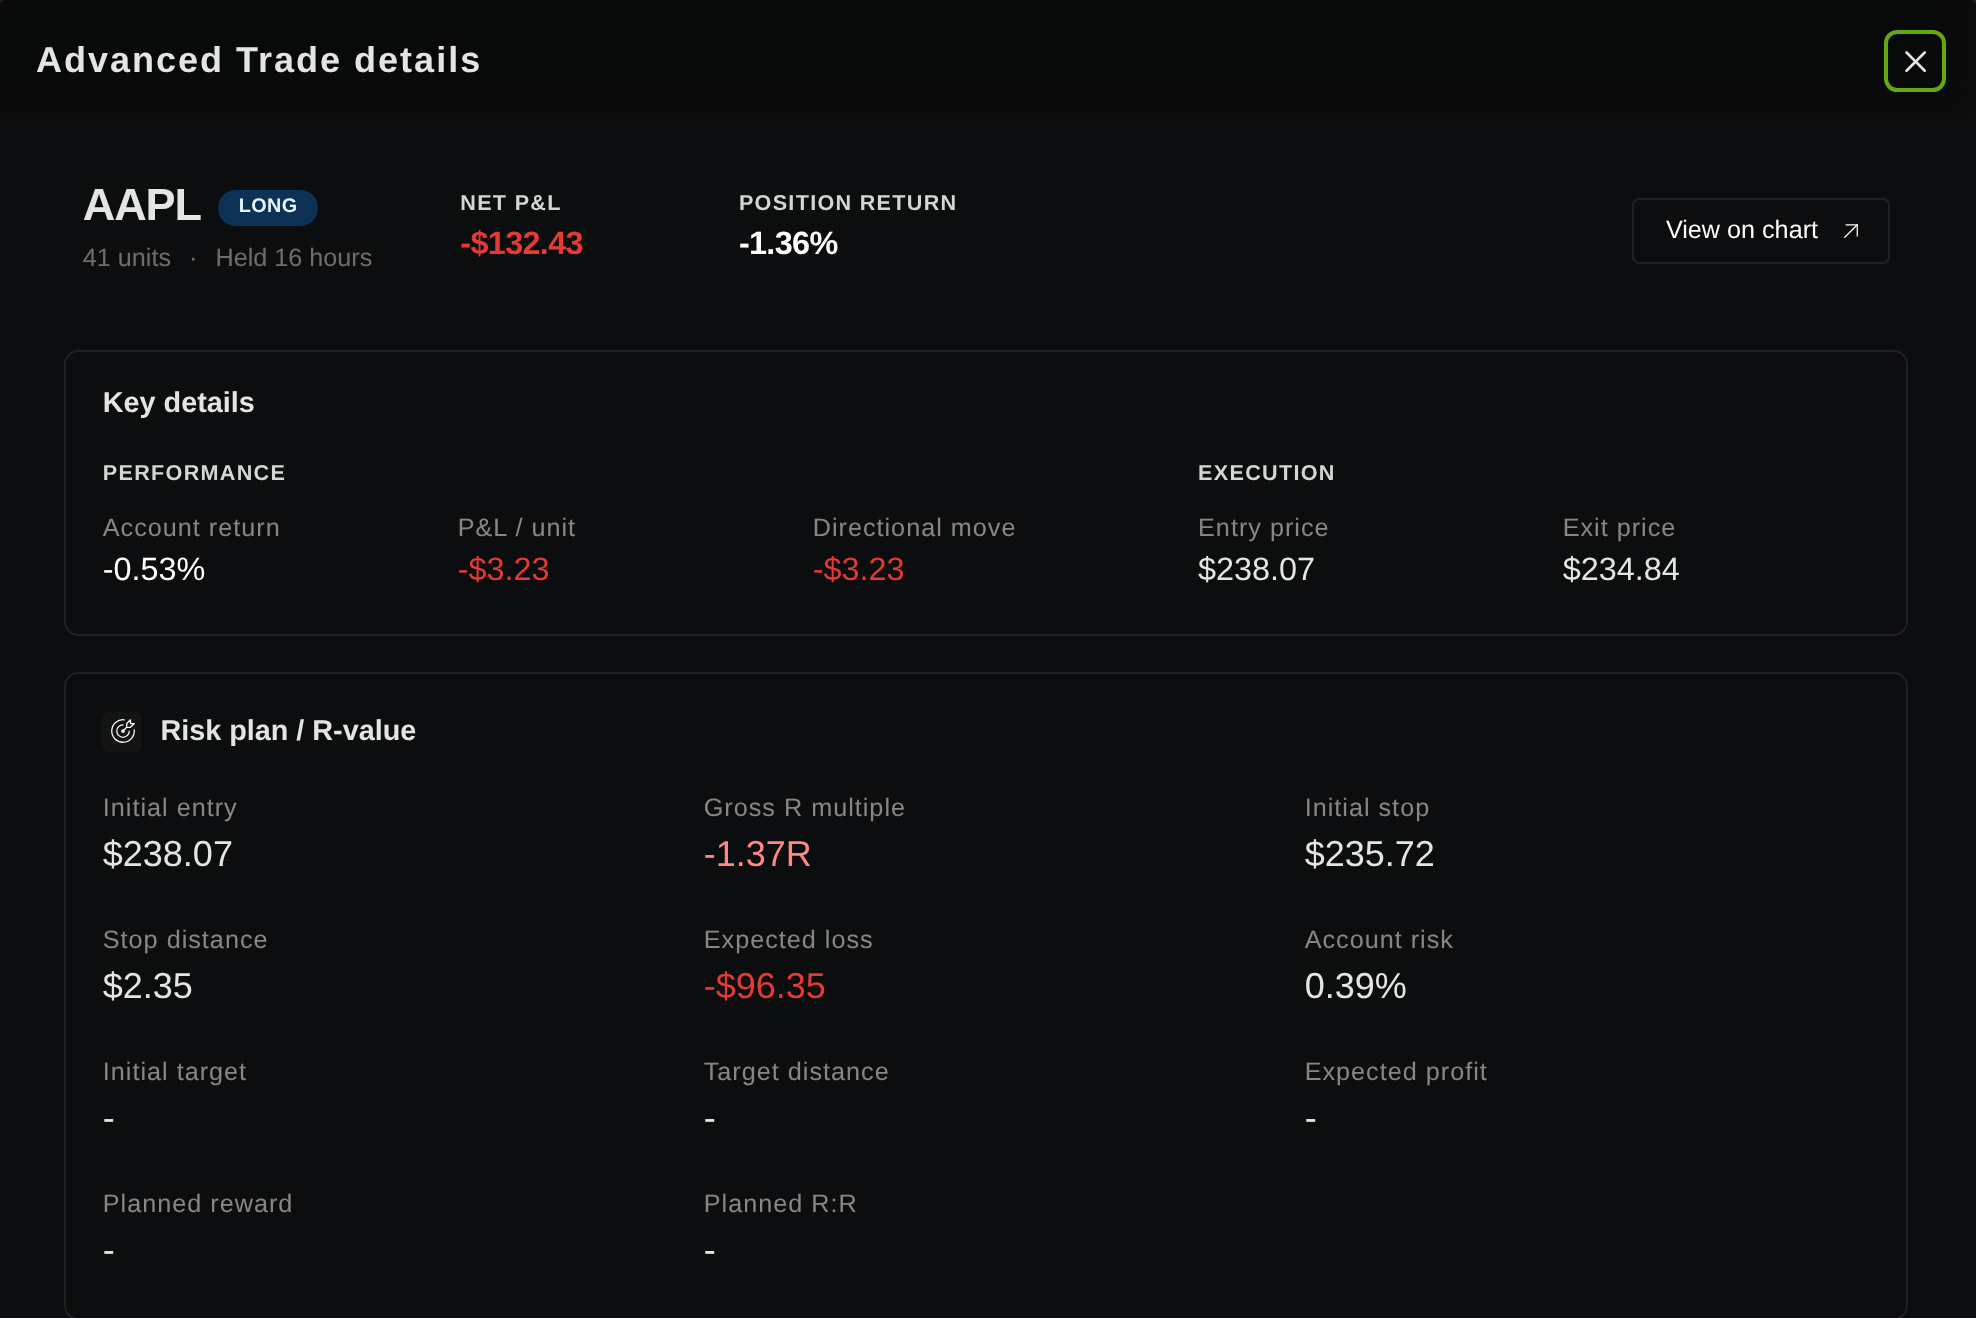
An actual Stratifyre demonstration compares fixed 20-share entries with a $250 starting-equity loss budget on EQ:NASDAQ:AAPL, using January 1–March 31, 2025. Both runs start with $25,000, use hourly EMA(20)/EMA(50) crosses, enter while flat with no pending buy, attach the same initial stop at first fill minus twice ATR(14), and exit on the opposite cross or protection. Fees and slippage are set to zero for this diagnostic; it is not an estimate of live execution costs.
The budget version uses whole shares, a maximum of 50 shares, and a $10,000 notional cap at the submission price:
floor(min(50, 10000 / price, 250 / (2 * ATR({period:14}))))The $250 is fixed at 1% of starting capital; it does not compound with current equity. Every accepted quantity remains below 50 and every actual entry notional below $10,000 in this sample. The notional cap binds before the full $250 budget is used, so these trades do not have equal planned dollar losses.
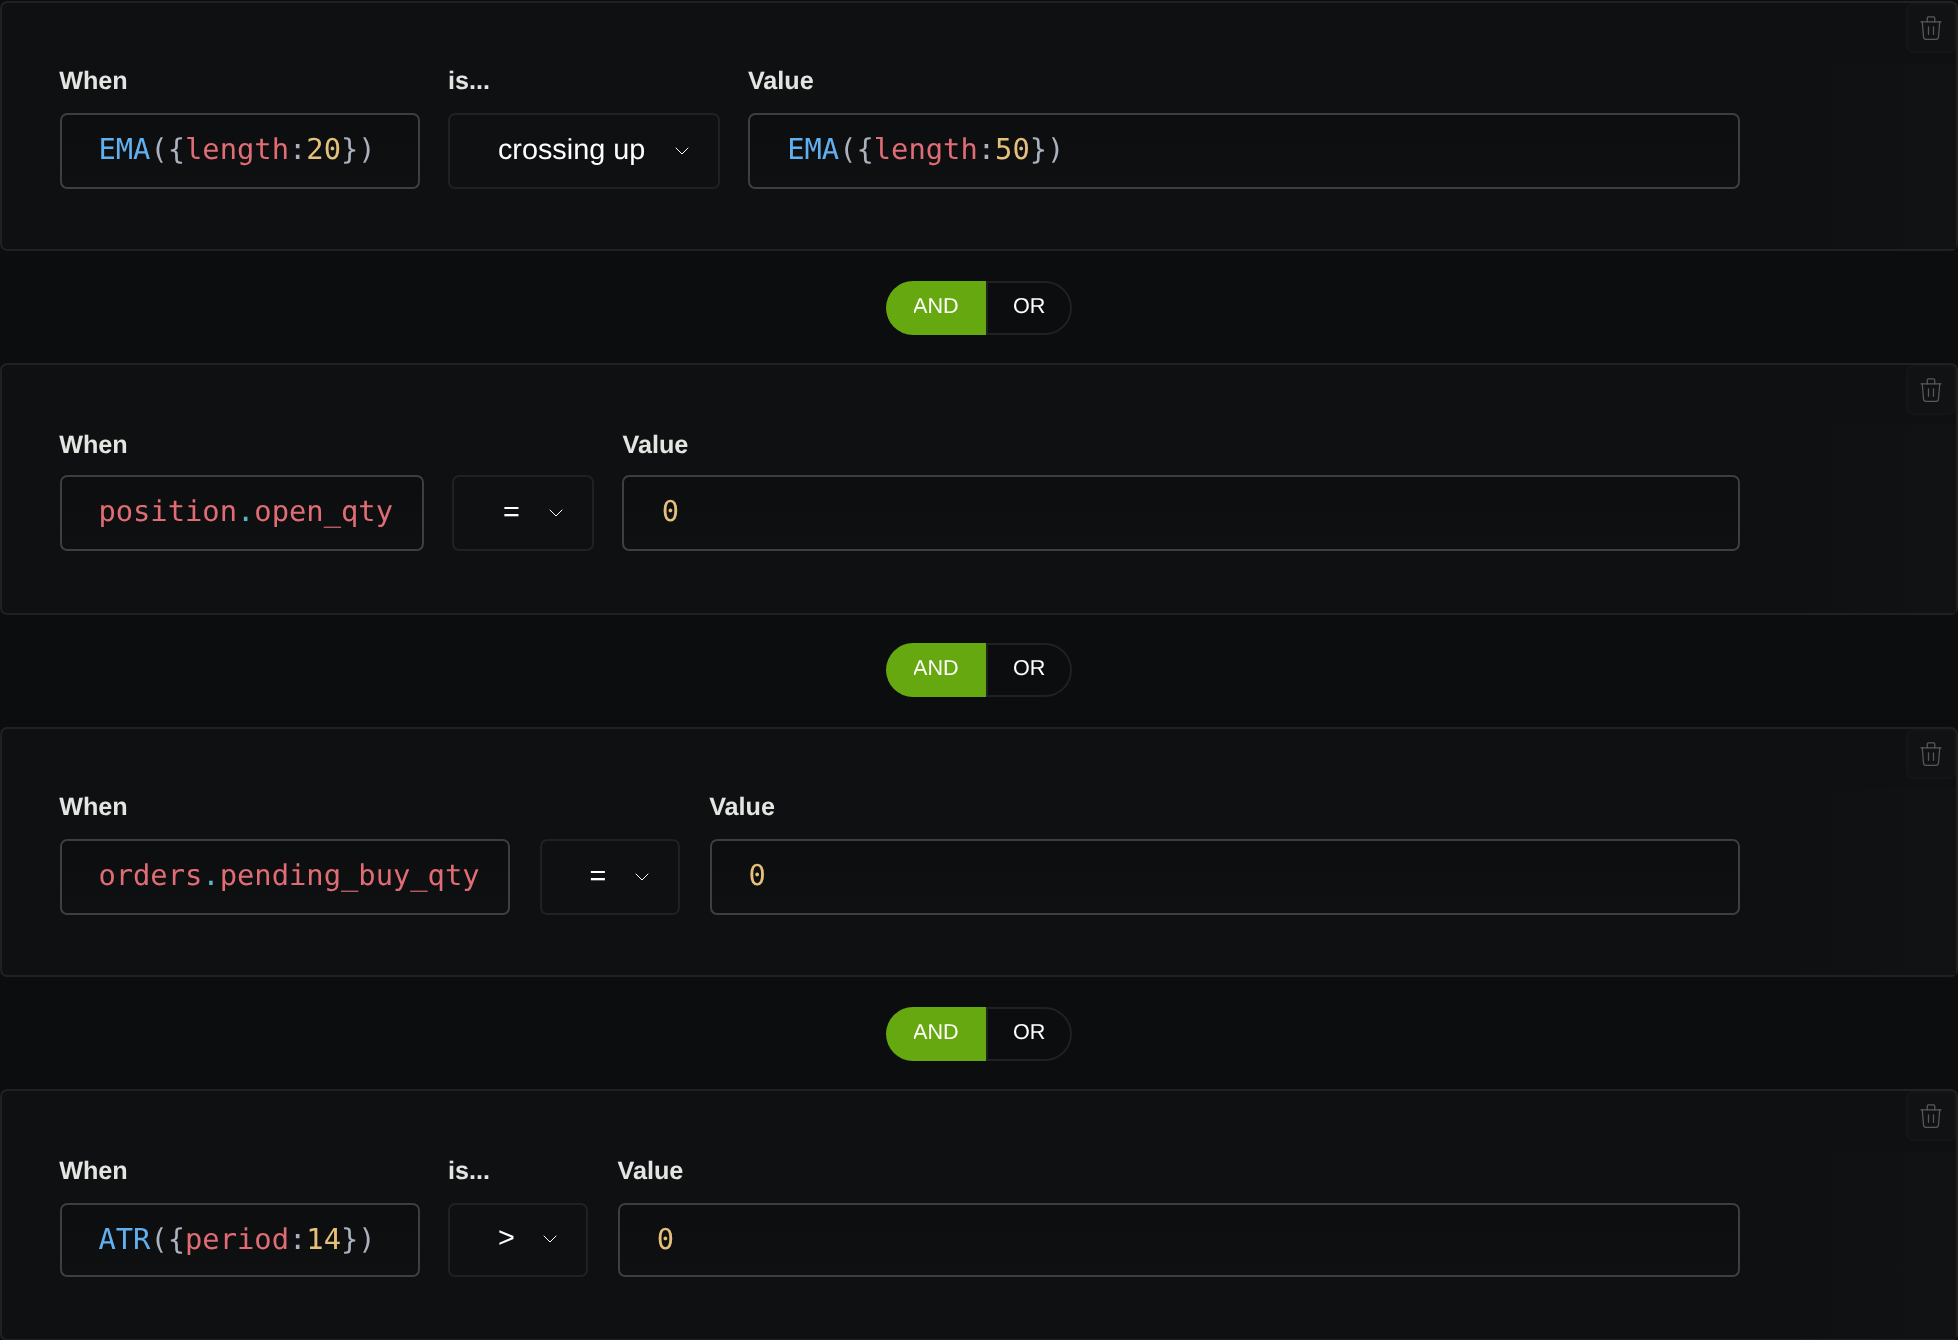
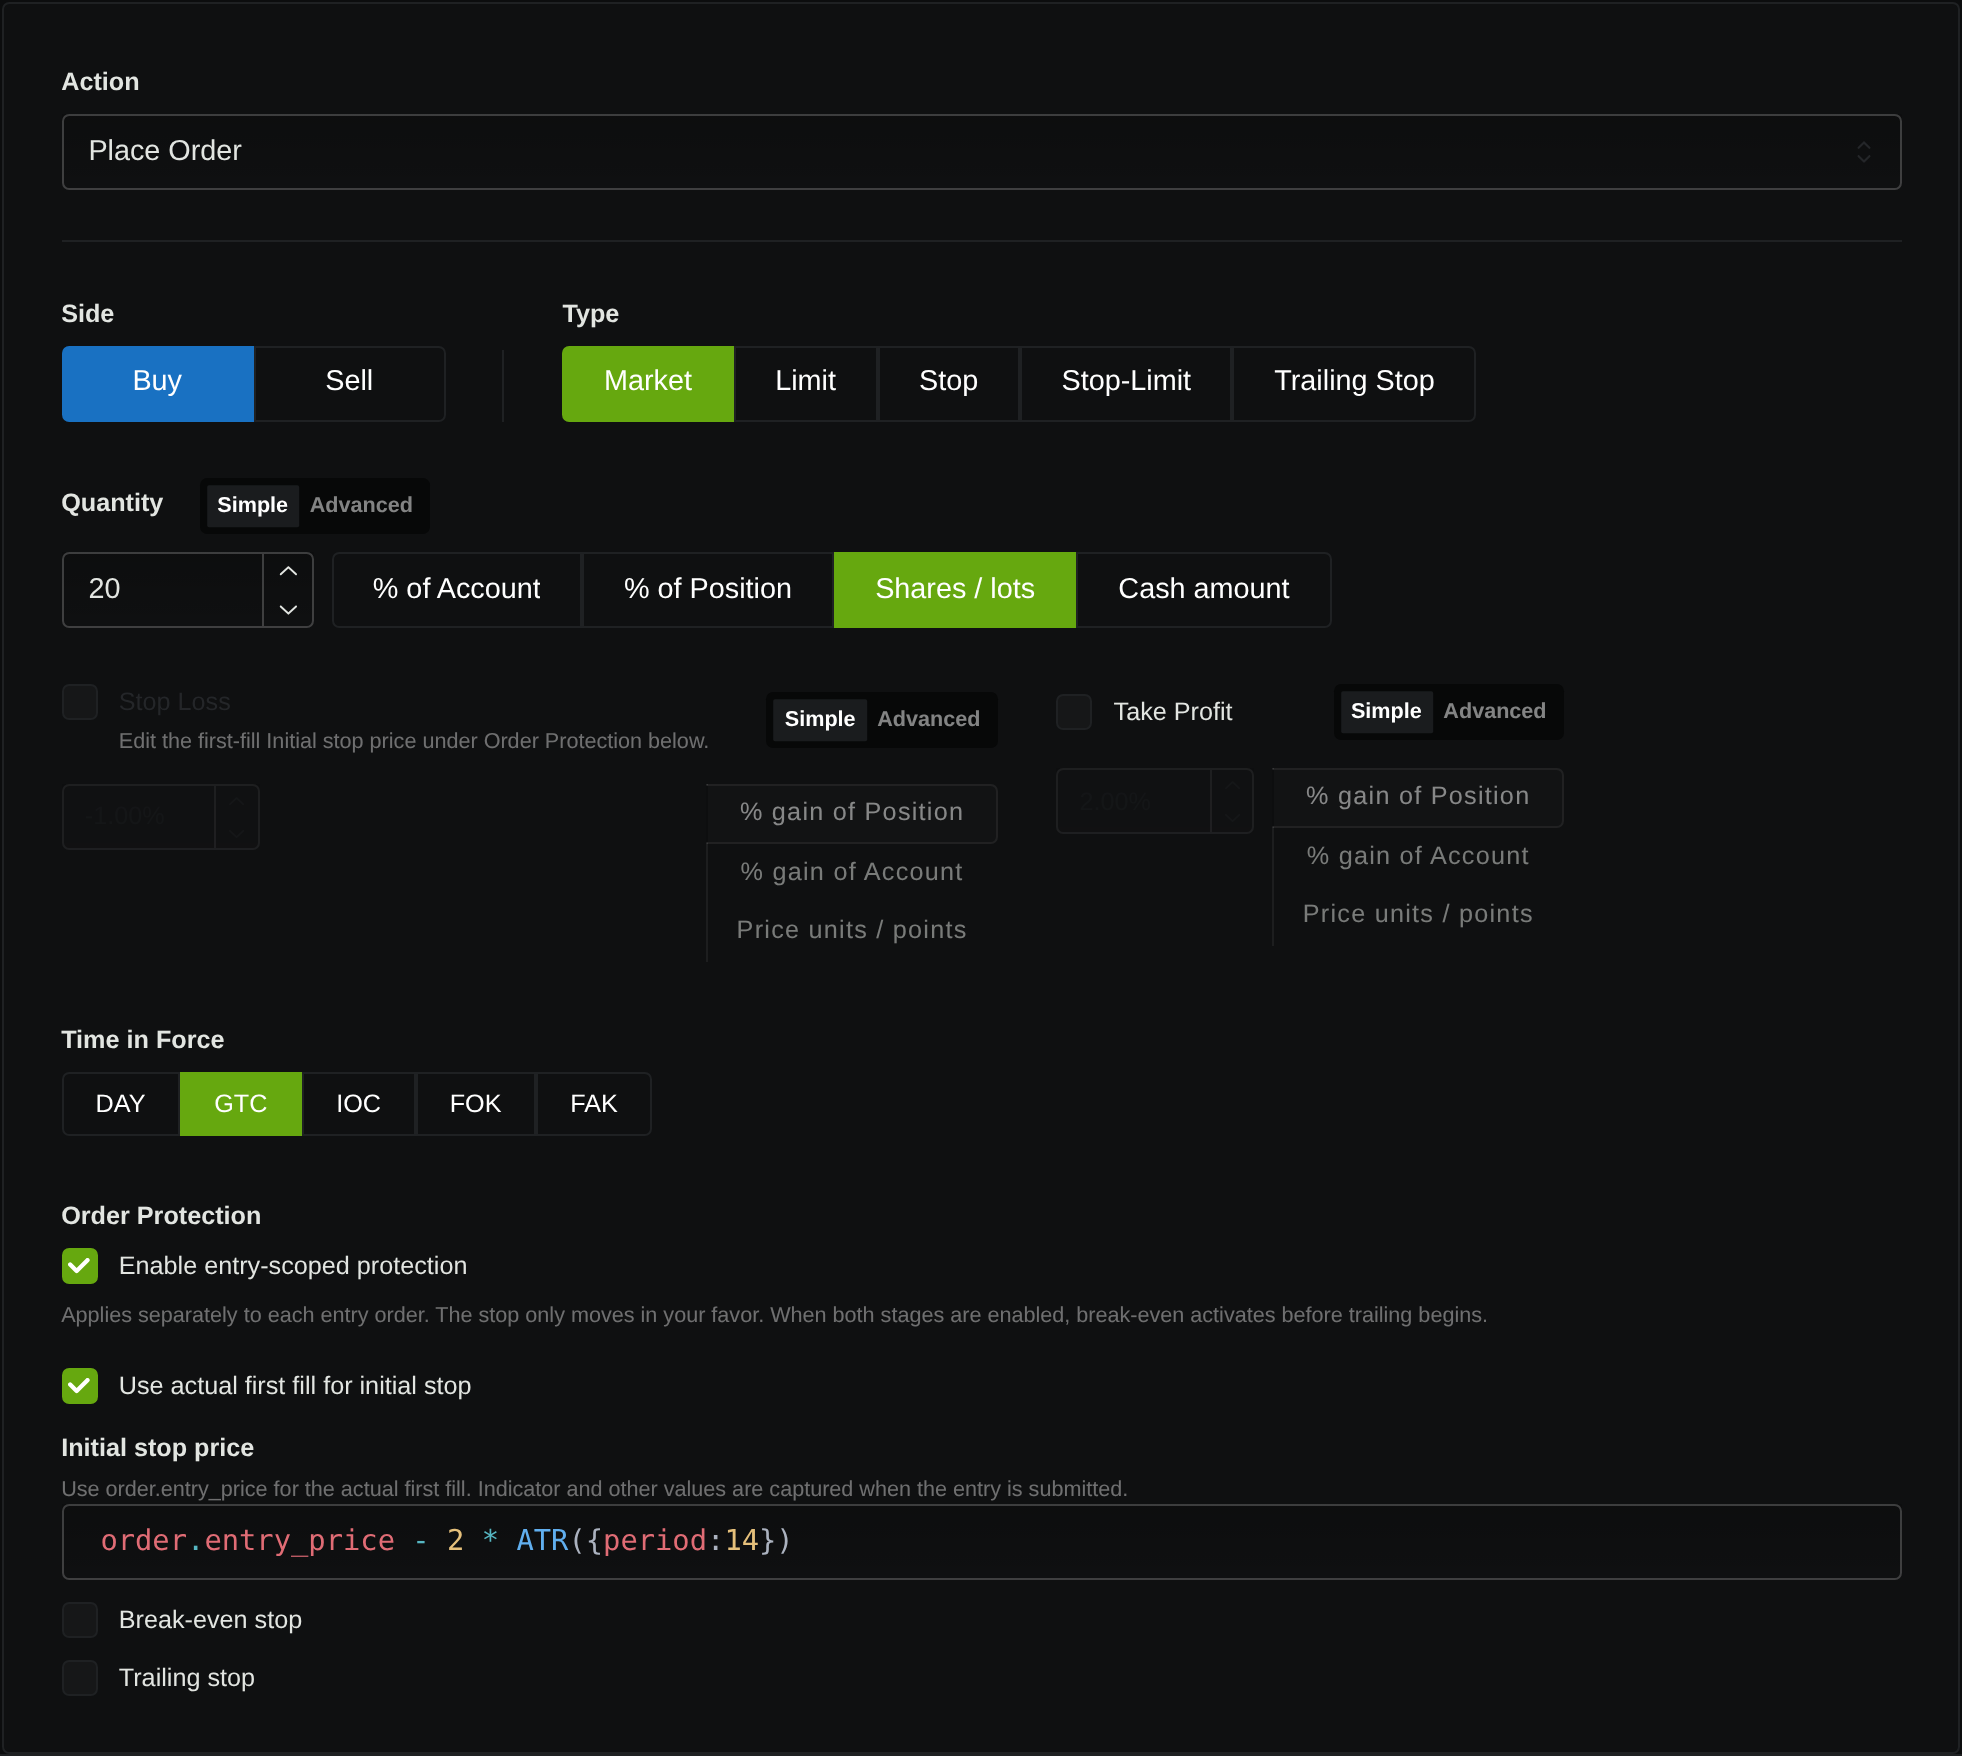
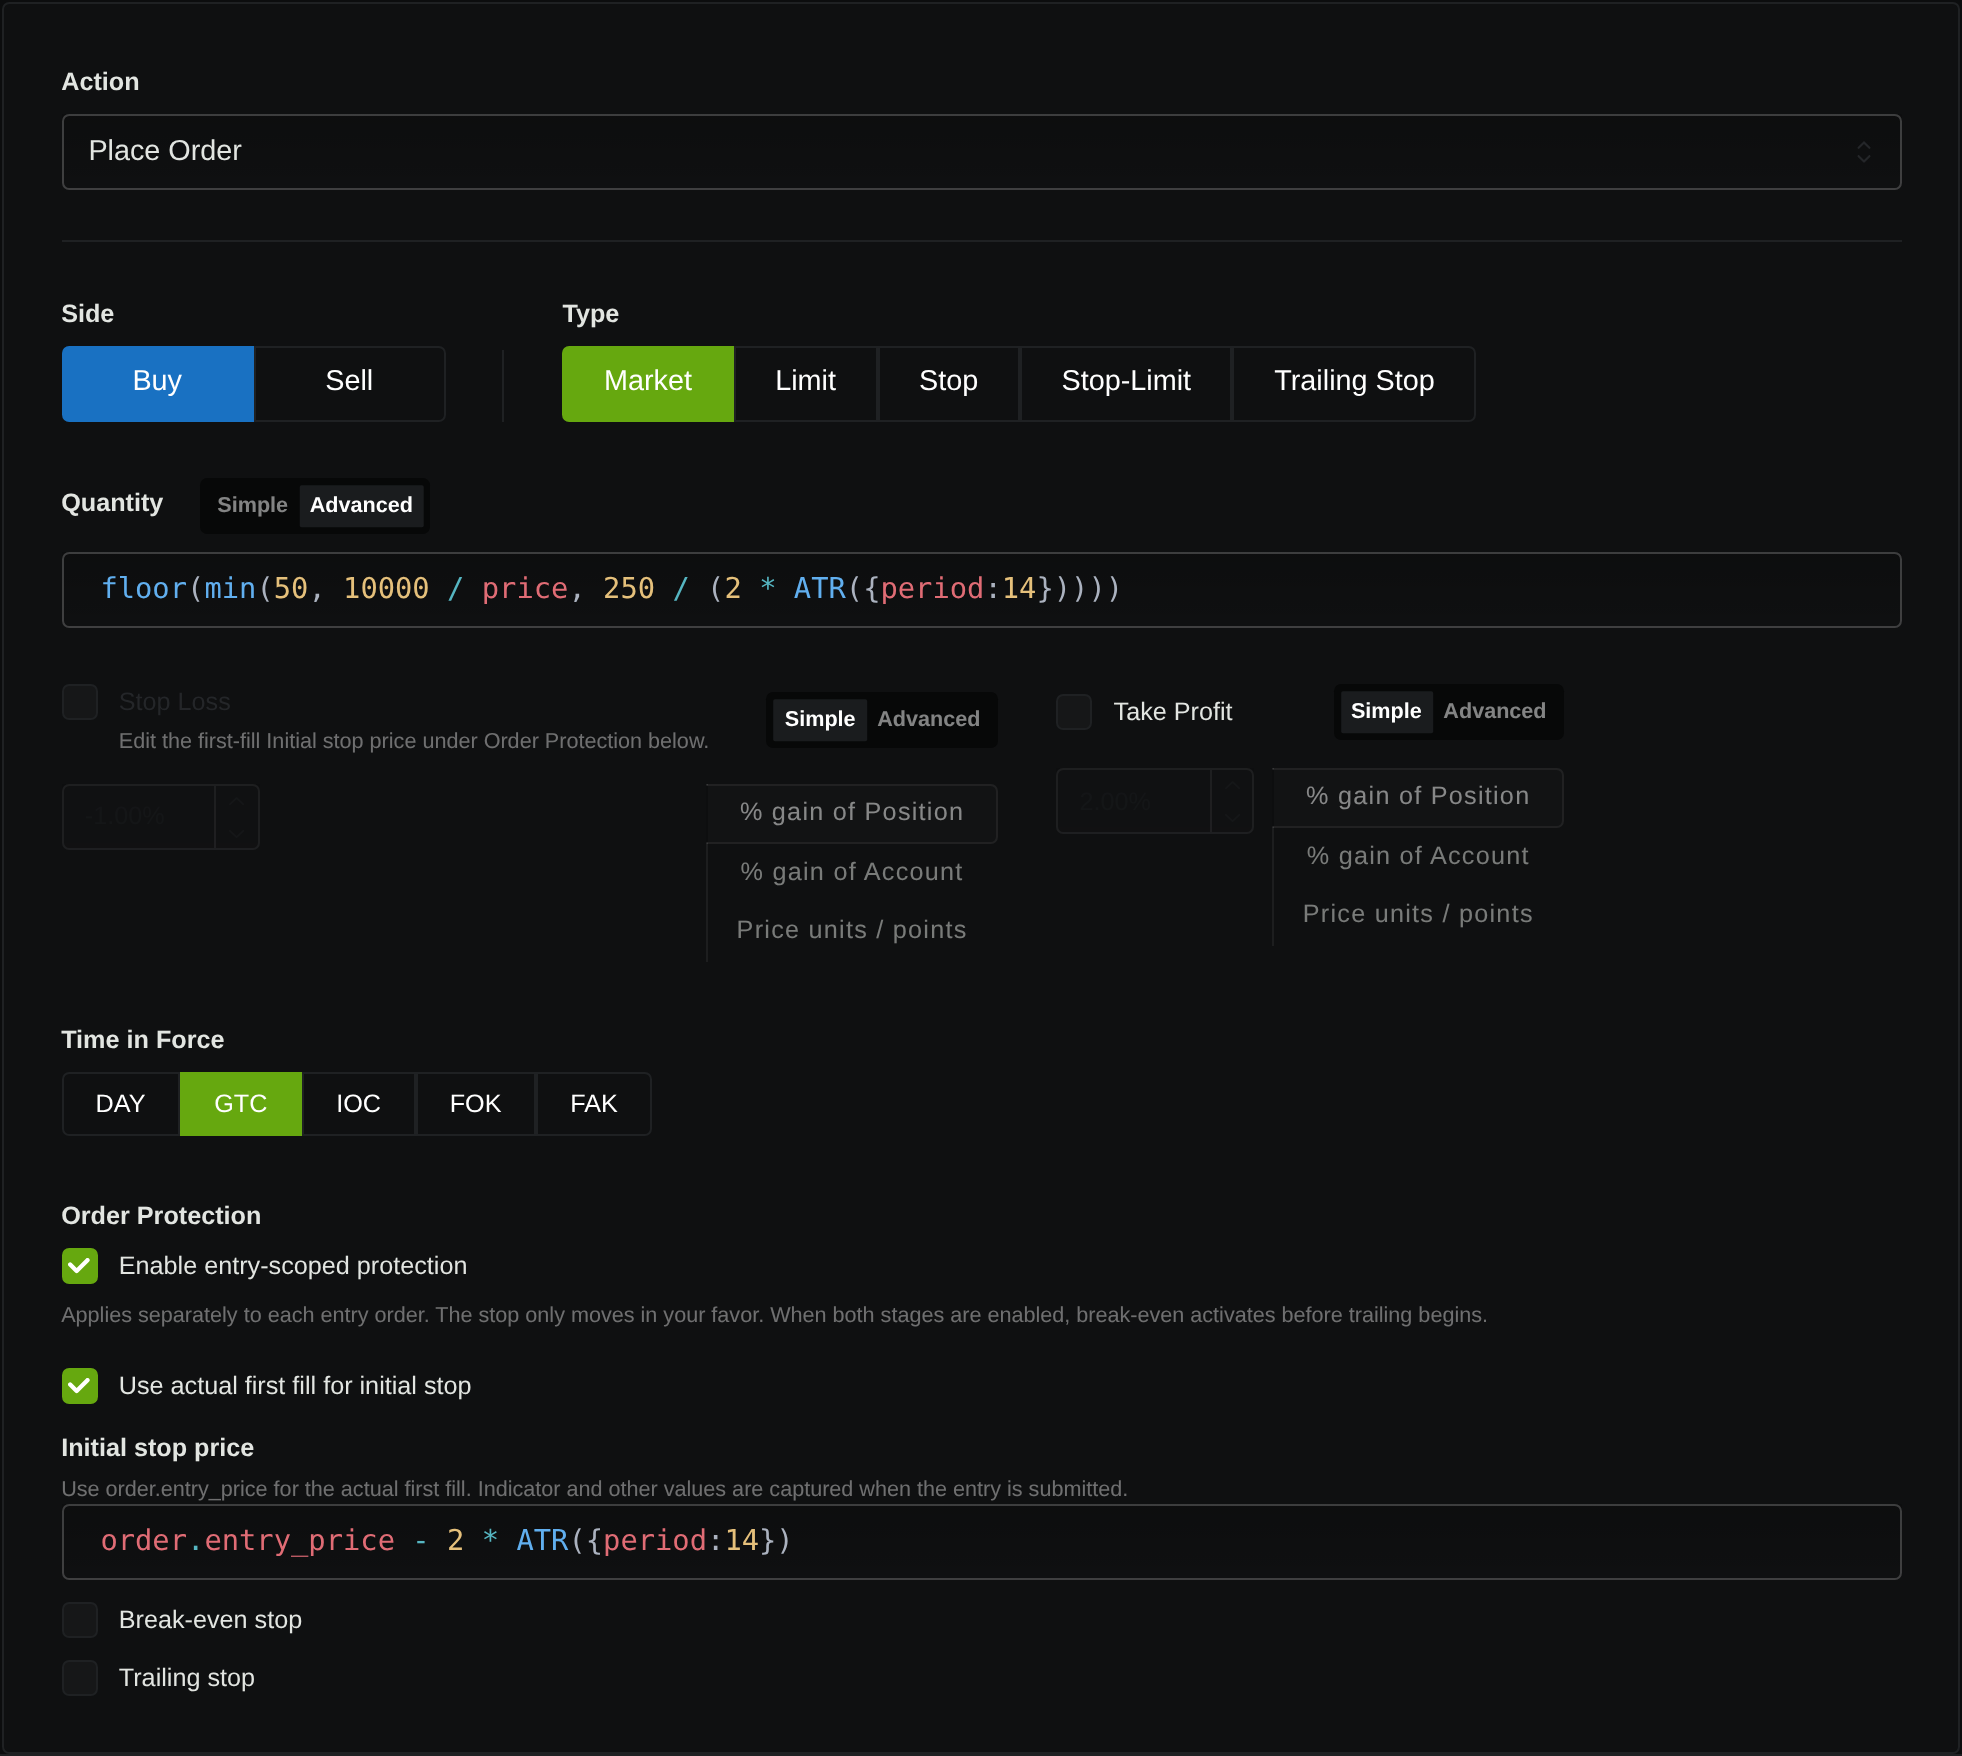
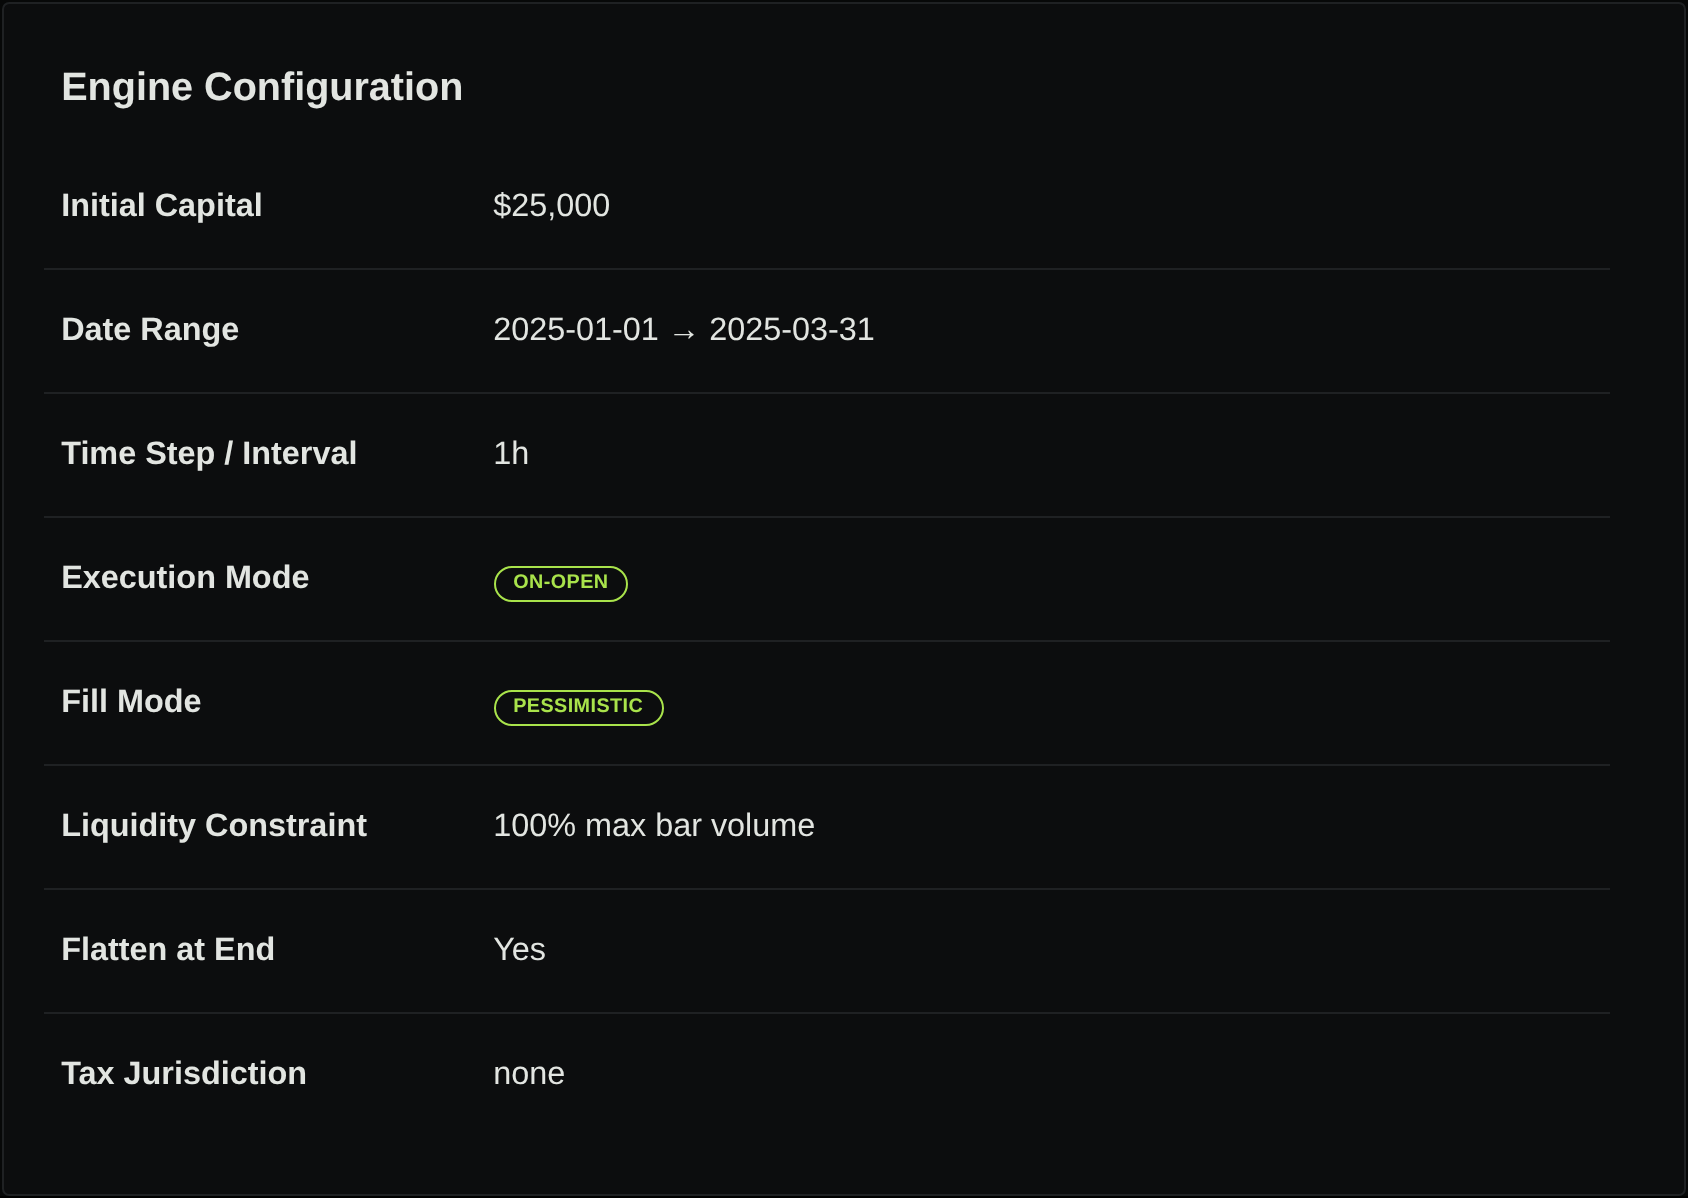
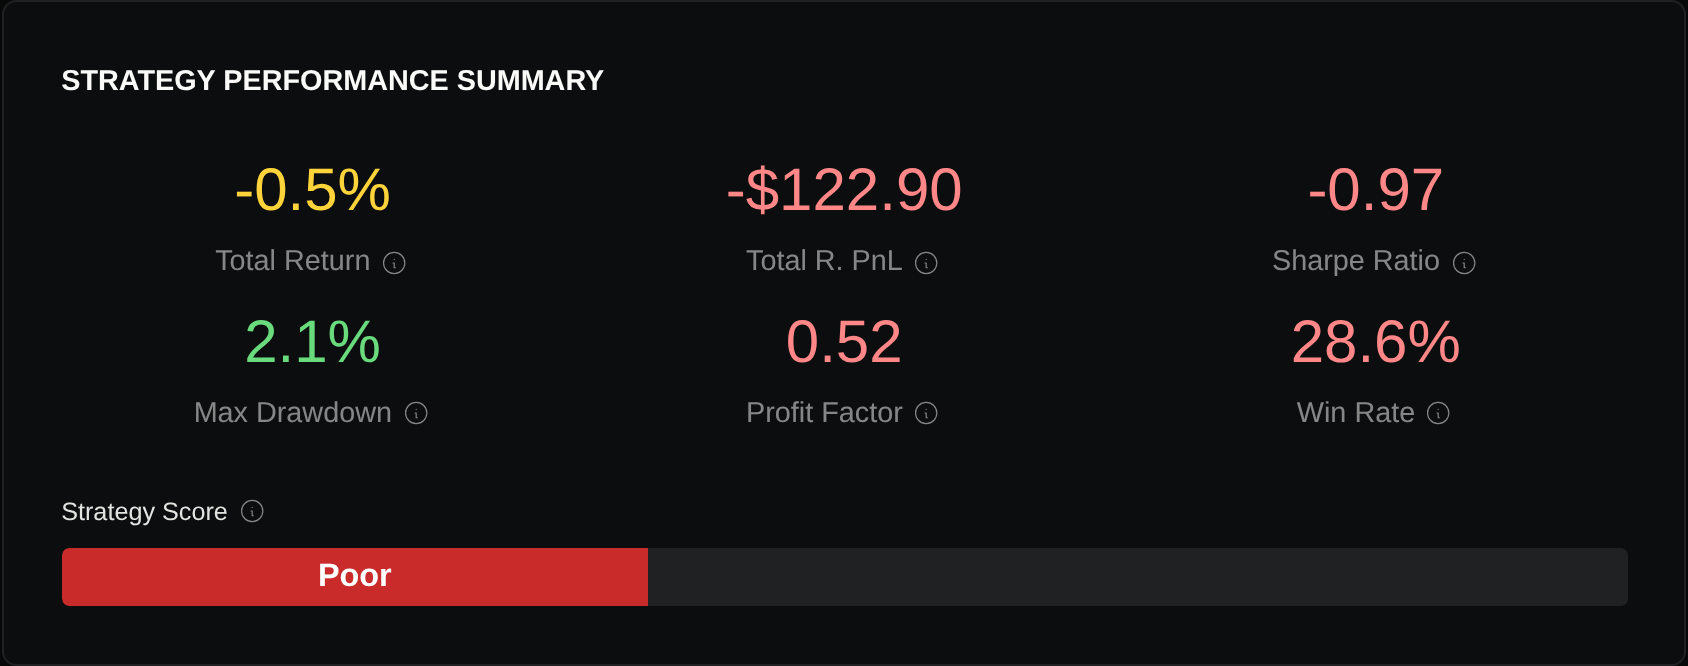
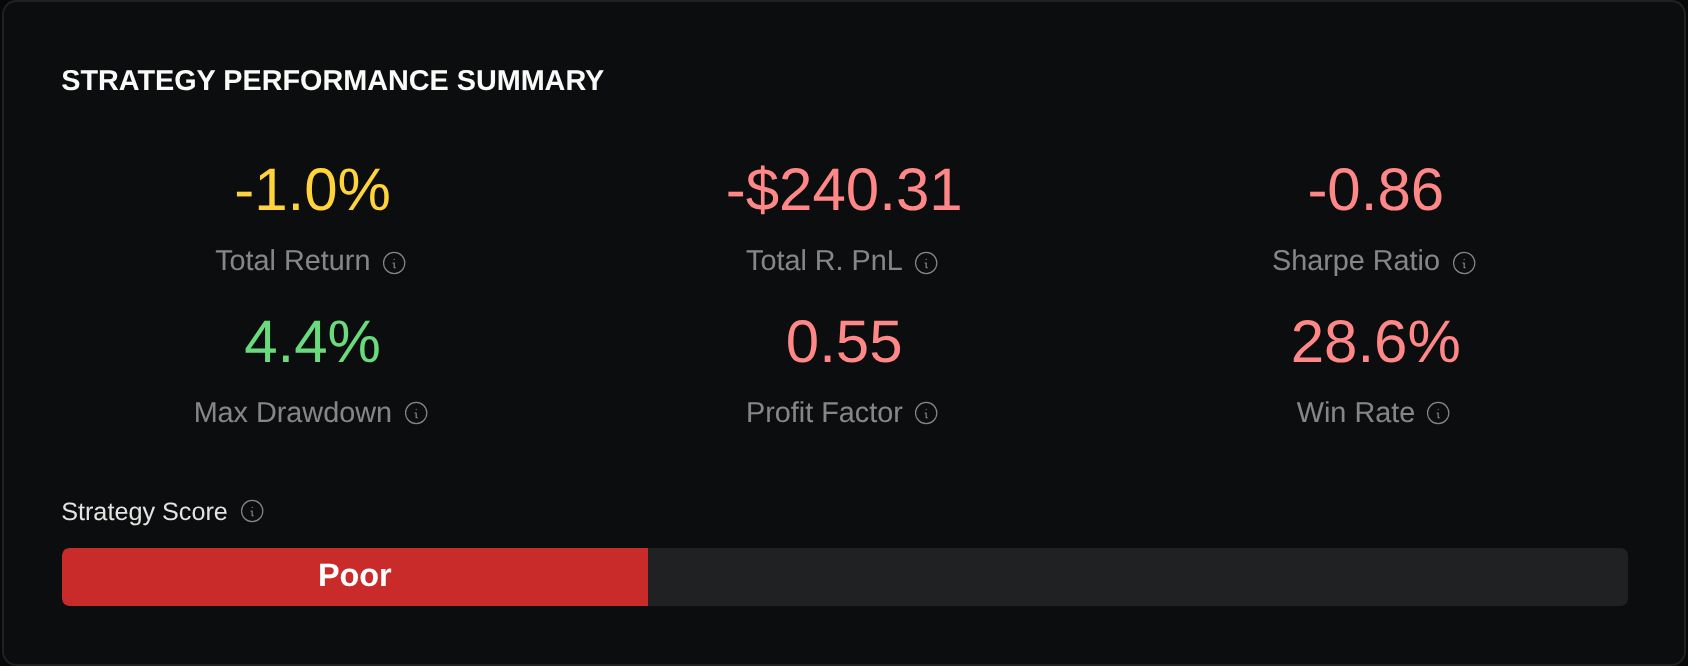
Both completed trade lists contain seven trades with identical entry/exit times, prices and initial stop prices. Fixed quantity remains 20; the budget-and-cap quantities are 41, 43, 42, 42, 41, 46 and 45. More size amplified this sample’s losses rather than improving the signal.
| Observed app output | Fixed 20 shares | Budget with caps |
|---|---|---|
| Completed trades | 7 | 7 |
| Reported net P&L | −$122.90 | −$240.31 |
| Maximum drawdown, dollars | $529.40 | $1,131.86 |
| Largest entry notional | $4,801.20 | $9,947.50 |
Start with a held-signal comparison: an identical list of hypothetical or recorded entry and exit prices, replayed with different quantities. Disable compounding for this diagnostic, state a fixed dollar budget, and hold fills constant. It isolates the arithmetic effect of sizing, but cannot prove that every position was affordable or would have received the same fill.
Then run an account simulation using the actual capital and execution rules. Keep the instruments, data, date window, sessions, signal timing, entries, stops, exits, fees, and slippage assumptions identical. Change only the explicit sizing policy and its equity basis.
The completed trade lists may diverge even with identical signal rules: a larger position can consume buying power, trigger an exposure restriction, receive a partial fill, or block the next entry. Current-equity sizing compounds this dependence. Compare the signal opportunities alongside accepted trades; a lower trade count is not automatically weaker entry logic.
Save each run’s configuration and inspect representative quantities and stop prices in its trade records. In Stratifyre, verify the historical job’s behavior directly; a live-trading risk preset is not evidence that the same control was applied to a backtest. Hypothetical examples and setting names alone do not establish that a sizing expression, currency treatment, or cap was executed; the paired demonstration above checks the persisted expression against actual quantities.
Read exposure and loss alongside return
Use a compact comparison sheet once both runs have completed:
| Compare | Decision it informs |
|---|---|
| Net return and maximum drawdown | Was additional return accompanied by a larger equity decline? |
| Typical and peak notional exposure | Did sizing materially change leverage or capital use? |
| Planned loss and realized loss for stopped trades | Where did fills and costs exceed the allowance? |
| Traded notional, fees, and partial fills | Did more activity consume the apparent advantage? |
| Signals, accepted trades, and rejected orders | Did affordability change which opportunities were taken? |
Define traded notional consistently, including the same entry and exit legs in each variant. More shares per signal can increase dollar turnover without adding trades. Check wide-stop periods separately from narrow-stop periods; the latter can create the largest risk-budget positions. Repeat the frozen comparison on a later, untouched period before treating the policy as a useful research finding.
An intended stop does not cap realized loss
The formula assumes an exit near the intended stop plus the stated cost allowance. A stock that gaps from $50 to a $44 exit has lost $6 per share, even if its intended stop was $48. For the hypothetical 119-share position, that is $714 before actual costs, exceeding the $249.90 planned allowance.
The SEC explains that a stop price does not guarantee a stop order’s execution price; a stop-limit order can instead remain unfilled. Investor.gov stop-order bulletin
Inspect gap fills, adverse slippage, and same-bar stop/target assumptions. A per-unit allowance helps make the arithmetic explicit; it cannot eliminate tail losses or establish live execution quality.
For your next Stratifyre backtest comparison, write down one fixed-quantity policy and one explicit loss-budget policy, then freeze the entry and exit rules. Judge the completed comparison by its exposure, costs, rejected signals, and losses alongside its returns.
Put your strategy rules to the test
Build your strategy, inspect historical trades, and review the assumptions behind your results.
Build and test your strategy