Crypto backtest fees: calculate the move needed to break even
Calculate a spot trade's break-even move, distinguish maker and taker fills, and check fees, spread, slippage, and turnover before trusting net results.
A crypto trade can finish above its entry price and still lose money. Entry fees consume cash, exit fees reduce proceeds, and the price you can actually trade may be worse than the chart’s reference price.
For a long spot position with both fees paid in the quote currency, the fee-only break-even price is entry price × (1 + entry fee rate) ÷ (1 − exit fee rate). With an illustrative 0.10% fee on each side, the required price increase is about 0.2002%, before spread or slippage.
The calculations below are teaching examples, not exchange-account quotes or Stratifyre backtest results. They assume unleveraged spot buying followed by selling the same quantity; perpetual funding and margin borrowing need separate accounting.
Start with the fees your fills actually incur
A maker fill adds liquidity to the order book; a taker fill consumes an order already resting there. The classification belongs to execution, not your intention. A limit buy priced to match an available sell can execute immediately and pay the taker rate. Kraken’s documentation also explains that its post-only option cancels an order that would take liquidity; that option does not guarantee a fill. Kraken maker and taker guide.
That matters when a backtest assumes cheap maker entries but a stop exit becomes a market order. Writing “limit order” in the strategy specification does not justify charging the maker rate to every trade.
Record the following before choosing a fee assumption:
- Exchange, trading product, and exact pair: spot and derivatives schedules differ.
- Account tier, applicable pair promotions, and whether a discount is enabled.
- Entry and exit execution assumptions, including any maker/taker mixture.
- Fee currency: quote currency, purchased asset, or a separate discount token.
- The date the schedule was checked, plus actual charges from representative fills where available.
On October 2, 2026, Binance’s public spot schedule listed a regular-user standard maker/taker row of 0.100% / 0.100%, with separate discount and USDC columns. That is a dated public reference, not a promise of your pair’s effective charge. Binance spot fee schedule.
Binance’s commission FAQ describes standard, tax, and special commission components and account/symbol-specific rate information. Its worked rates are explicitly fictional. Use the live schedule and your account’s applicable information rather than copying those documentation examples. Binance commission FAQ.
Work one spot round trip in cash
Assume an illustrative BTC/quote-currency trade with these conditions:
- Buy 0.02 BTC at 50,000 quote units per BTC.
- Sell all 0.02 BTC at 50,075.
- Pay 0.10% of each fill’s notional value, in the quote currency.
- Add no spread, slippage, borrowing, funding, or other charges.
The price rises 0.15%, producing a gross gain of 1.50 quote units. The cash ledger tells a different story:
| Cash item | Calculation | Quote units |
|---|---|---|
| Entry purchase | 0.02 × 50,000 | 1,000 |
| Entry fee | 1,000 × 0.001 | 1 |
| Total entry cash | Purchase + entry fee | 1,001 |
| Exit sale | 0.02 × 50,075 | 1,001.50 |
| Exit fee | 1,001.50 × 0.001 | 1.0015 |
| Net exit proceeds | Sale − exit fee | 1,000.4985 |
| Net trading profit | Net proceeds − entry cash | −0.5015 |
The exit fee is slightly higher because it applies to the higher exit notional. Adding two flat fee amounts based on the entry value would miss that difference.
Calculate the break-even move
Let P be the entry fill price, Q the quantity, X the exit fill price, and a and b the entry and exit fee rates as decimals. With both fees paid in quote currency:
Entry cash = Q × P × (1 + a)Exit proceeds = Q × X × (1 − b)
At break-even: Q × X × (1 − b) = Q × P × (1 + a)Exit price X = P × (1 + a) ÷ (1 − b)Required move = (1 + a) ÷ (1 − b) − 1
Enter 0.10% as 0.001 in this formula. The illustrative trade breaks even at approximately 50,100.1001, an increase of 0.2002%, or 20.02 basis points. One basis point is 0.01 percentage points. A rounded target of exactly 50,100 remains slightly below break-even.
For small positive fees, adding the two rates is a useful estimate. Use the full ratio when checking a tight target or reconciling an actual trade. The quantity cancels here because both fees are proportional and there are no fixed charges.
These hypothetical rates show how execution assumptions change the threshold:
| Entry assumption | Exit assumption | Fee-only break-even move |
|---|---|---|
| Maker at 0.05% | Maker at 0.05% | 0.1001% |
| Maker at 0.05% | Taker at 0.10% | 0.1502% |
| Taker at 0.10% | Maker at 0.05% | 0.1501% |
| Taker at 0.10% | Taker at 0.10% | 0.2002% |
All rates in this comparison are illustrative assumptions, not a live exchange fee table.
Fee currency changes the ledger. If a buy fee is deducted from the BTC you receive, you have less BTC available to sell. If it is paid in a separate token, record that token’s economic cost in a common currency. Binance describes commissions based on the received amount and payment using a discount asset; check those details before applying the quote-currency formula. Binance commission FAQ.
Add spread and slippage without counting them twice
Fees are cash charges. Spread and slippage affect the prices at which you buy and sell. Keep those two mechanisms separate in your worksheet.
If P and X already represent actual fill prices, the price disadvantage is already in the ledger. Do not subtract the same spread again. When starting from reference prices, such as the midpoint between bid and ask, define how those reference prices become fills.
For another illustrative calculation, suppose each side receives a 0.03% adverse price adjustment covering the assigned spread and additional slippage together. Keep the same 0.10% quote-currency fee on each side. A reference buy price becomes reference × 1.0003; a reference sell price becomes reference × 0.9997.
Required reference-price move = (1.0003 × 1.001) ÷ (0.9997 × 0.999) − 1 ≈ 0.2603%That is about 26.03 basis points. The 0.03% adjustments are chosen teaching inputs, not measured liquidity estimates. If your model already includes half the spread on each side, adding another full spread to each side exaggerates costs.
Turnover multiplies the bill
Count traded notional, not just completed positions. A simple entry and exit create two fills; scaling and partial executions can create more.
For an illustrative fee budget, assume every fill is exactly 1,000 quote units and costs 0.10%. Ten entry/exit pairs produce 20 fills, 20,000 of traded notional, and 20 of fees. One hundred pairs produce 200 fills, 200,000 of notional, and 200 of fees.
This isolates fee exposure; it does not compare two strategies’ profitability. A busier strategy may earn more gross profit, but it must cover a larger bill. With percentage fees, splitting an unchanged total notional into more fills does not itself increase charges; minimum fees or rounding can change that conclusion.
Platform subscription or research-usage charges belong in a separate budget. They affect the economics of conducting research, but they are not exchange charges on every historical buy or sell. Avoid inserting a platform bill into the exchange fee field.
Check one trade before trusting the whole report
Use one existing strategy as the audit case:
- Freeze its rules, instrument, dates, position sizing, and execution timing.
- Write down verified exchange rates and the intended fee currency.
- Check which fee model the simulator actually applies: fixed amount, percentage of notional, or separate maker/taker rates.
- Keep spread/slippage assumptions explicit; do not assume a fee input models them.
- Reconcile one completed entry and exit: quantity, fill prices, fee amounts, cash change, and reported net profit.
- Change only the supported cost assumptions for a comparison. If the model cannot represent the exchange schedule, record the mismatch and use a separate ledger for the missing costs.
A single percentage field cannot establish exchange-specific maker/taker classification. A fixed cash fee cannot exactly represent a percentage fee across different notionals. A fee-free run can help diagnose gross-versus-net differences, but its result does not establish tradable profitability.
A real cost comparison that fails the fee check
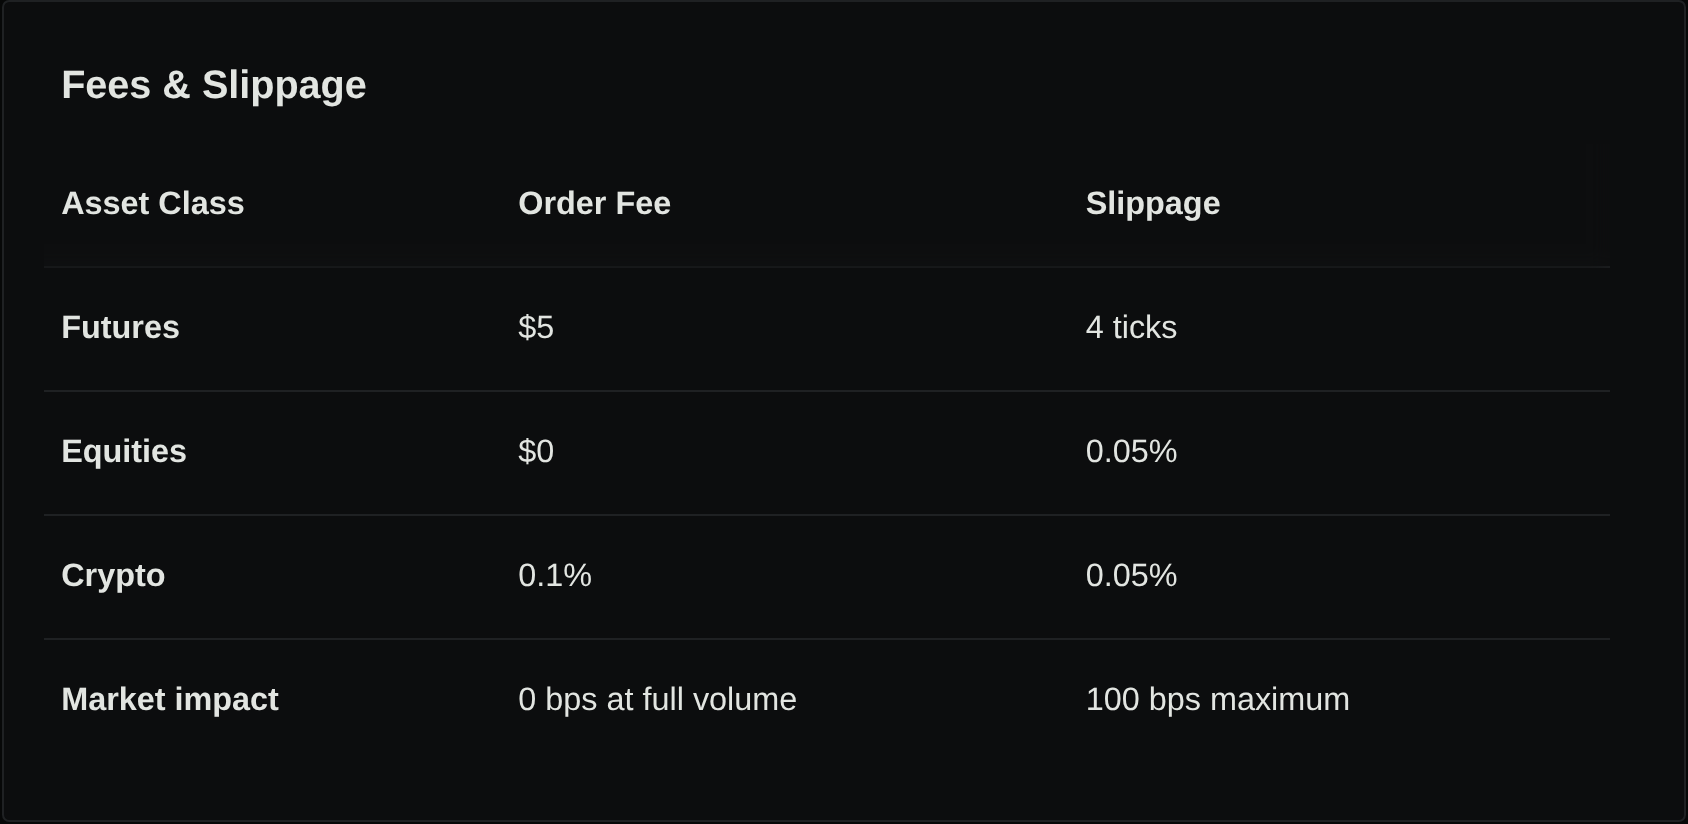
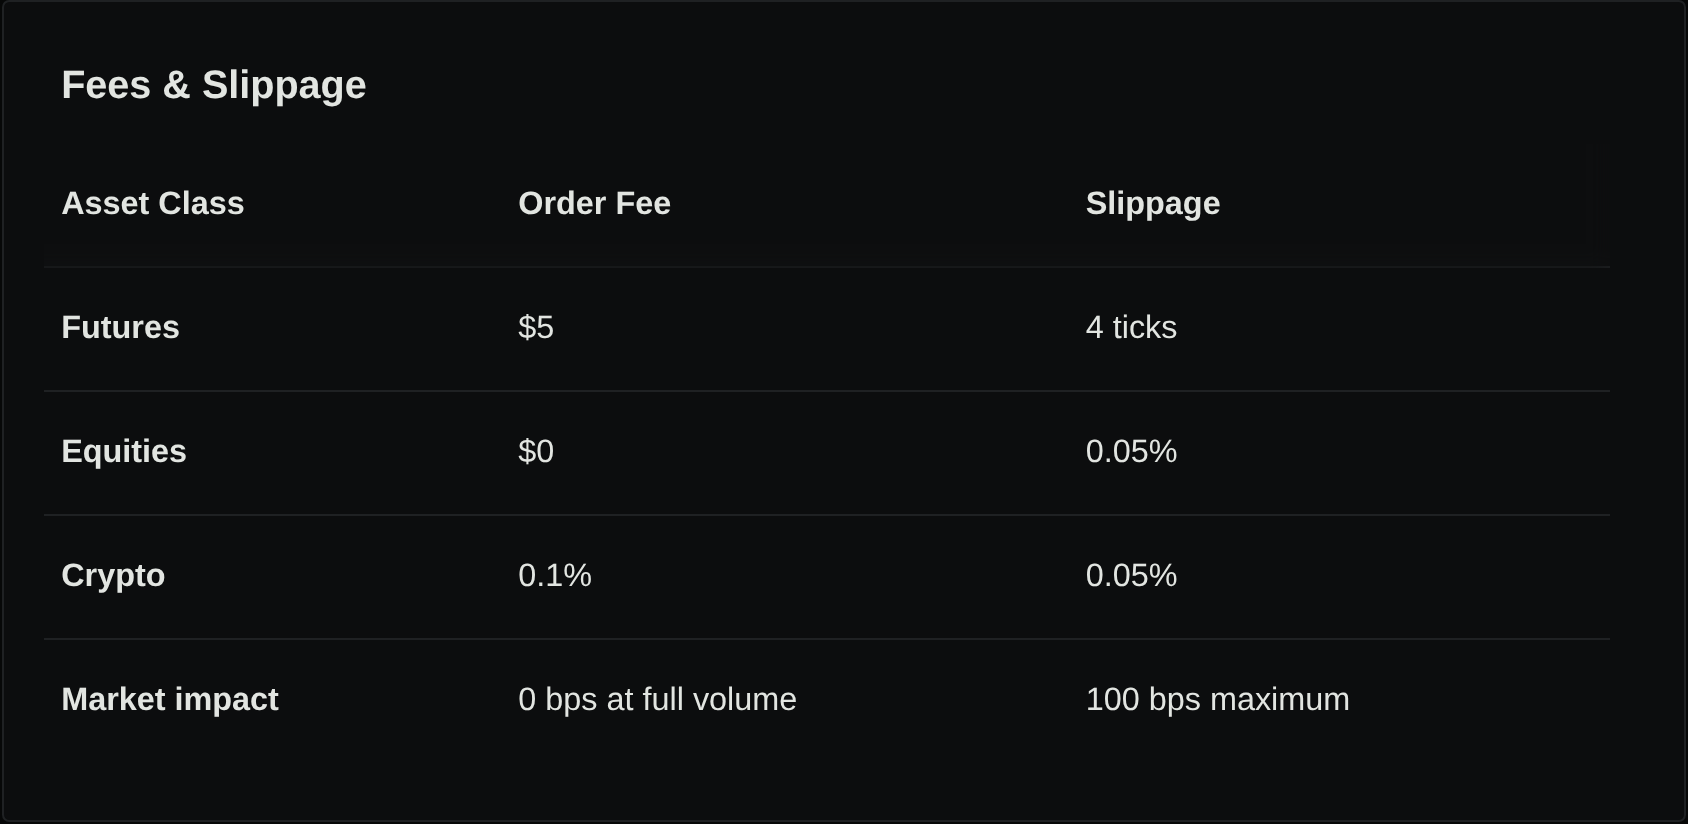
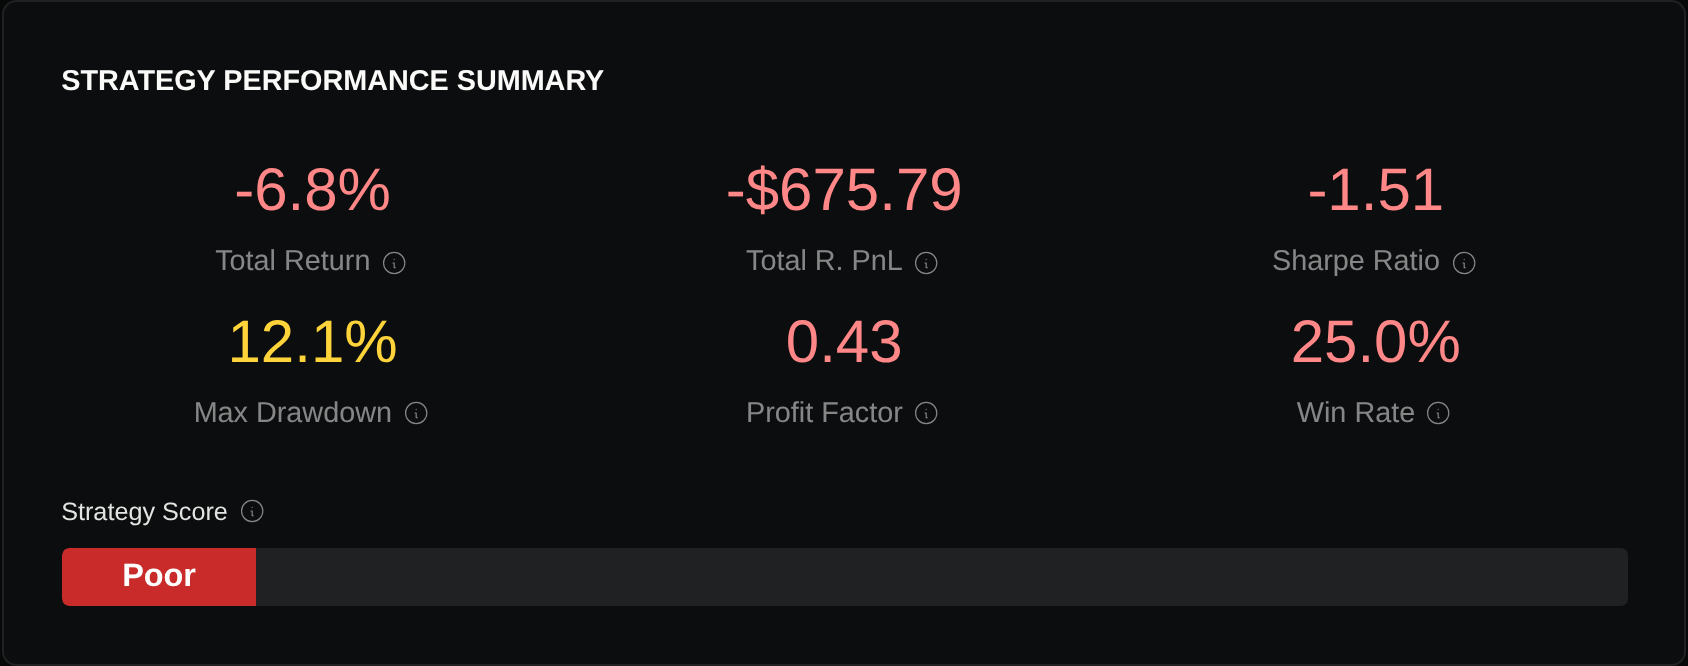
Two completed demo-account runs hold the BTC/USDT EMA(20)/EMA(50) rules, January–March 2025 hourly data, 10,000 capital, fixed 0.05 BTC entries and 0.05% crypto slippage constant. Only the configured crypto commission changes, from zero to 0.10%. Both produce 24 completed trades, −675.79 reported profit and 9,324.21 ending equity; every returned trade fee is zero in both runs.
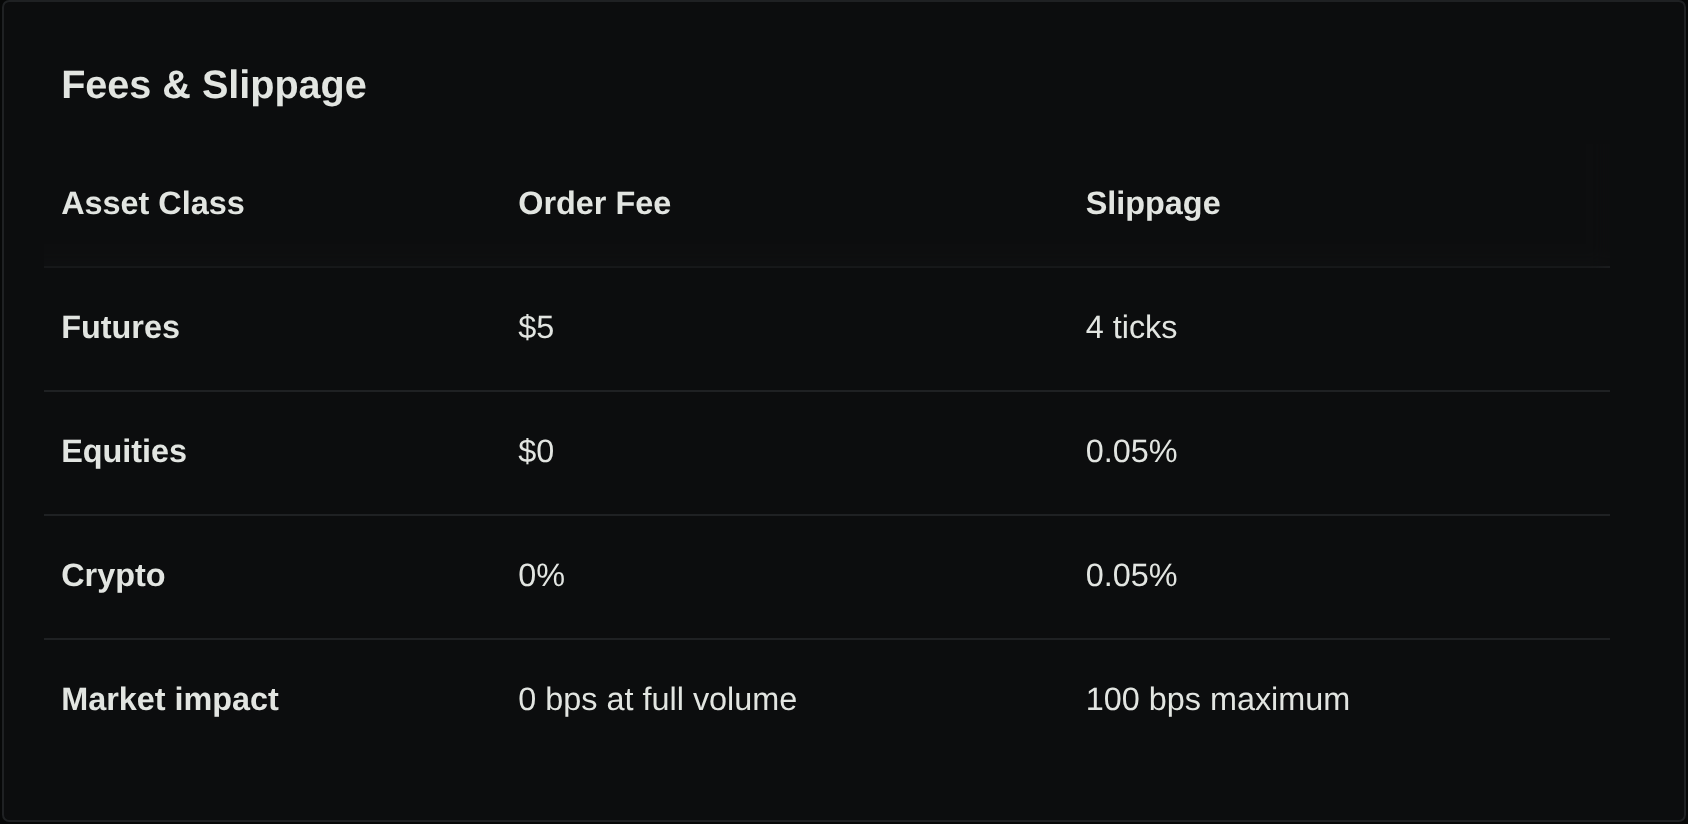
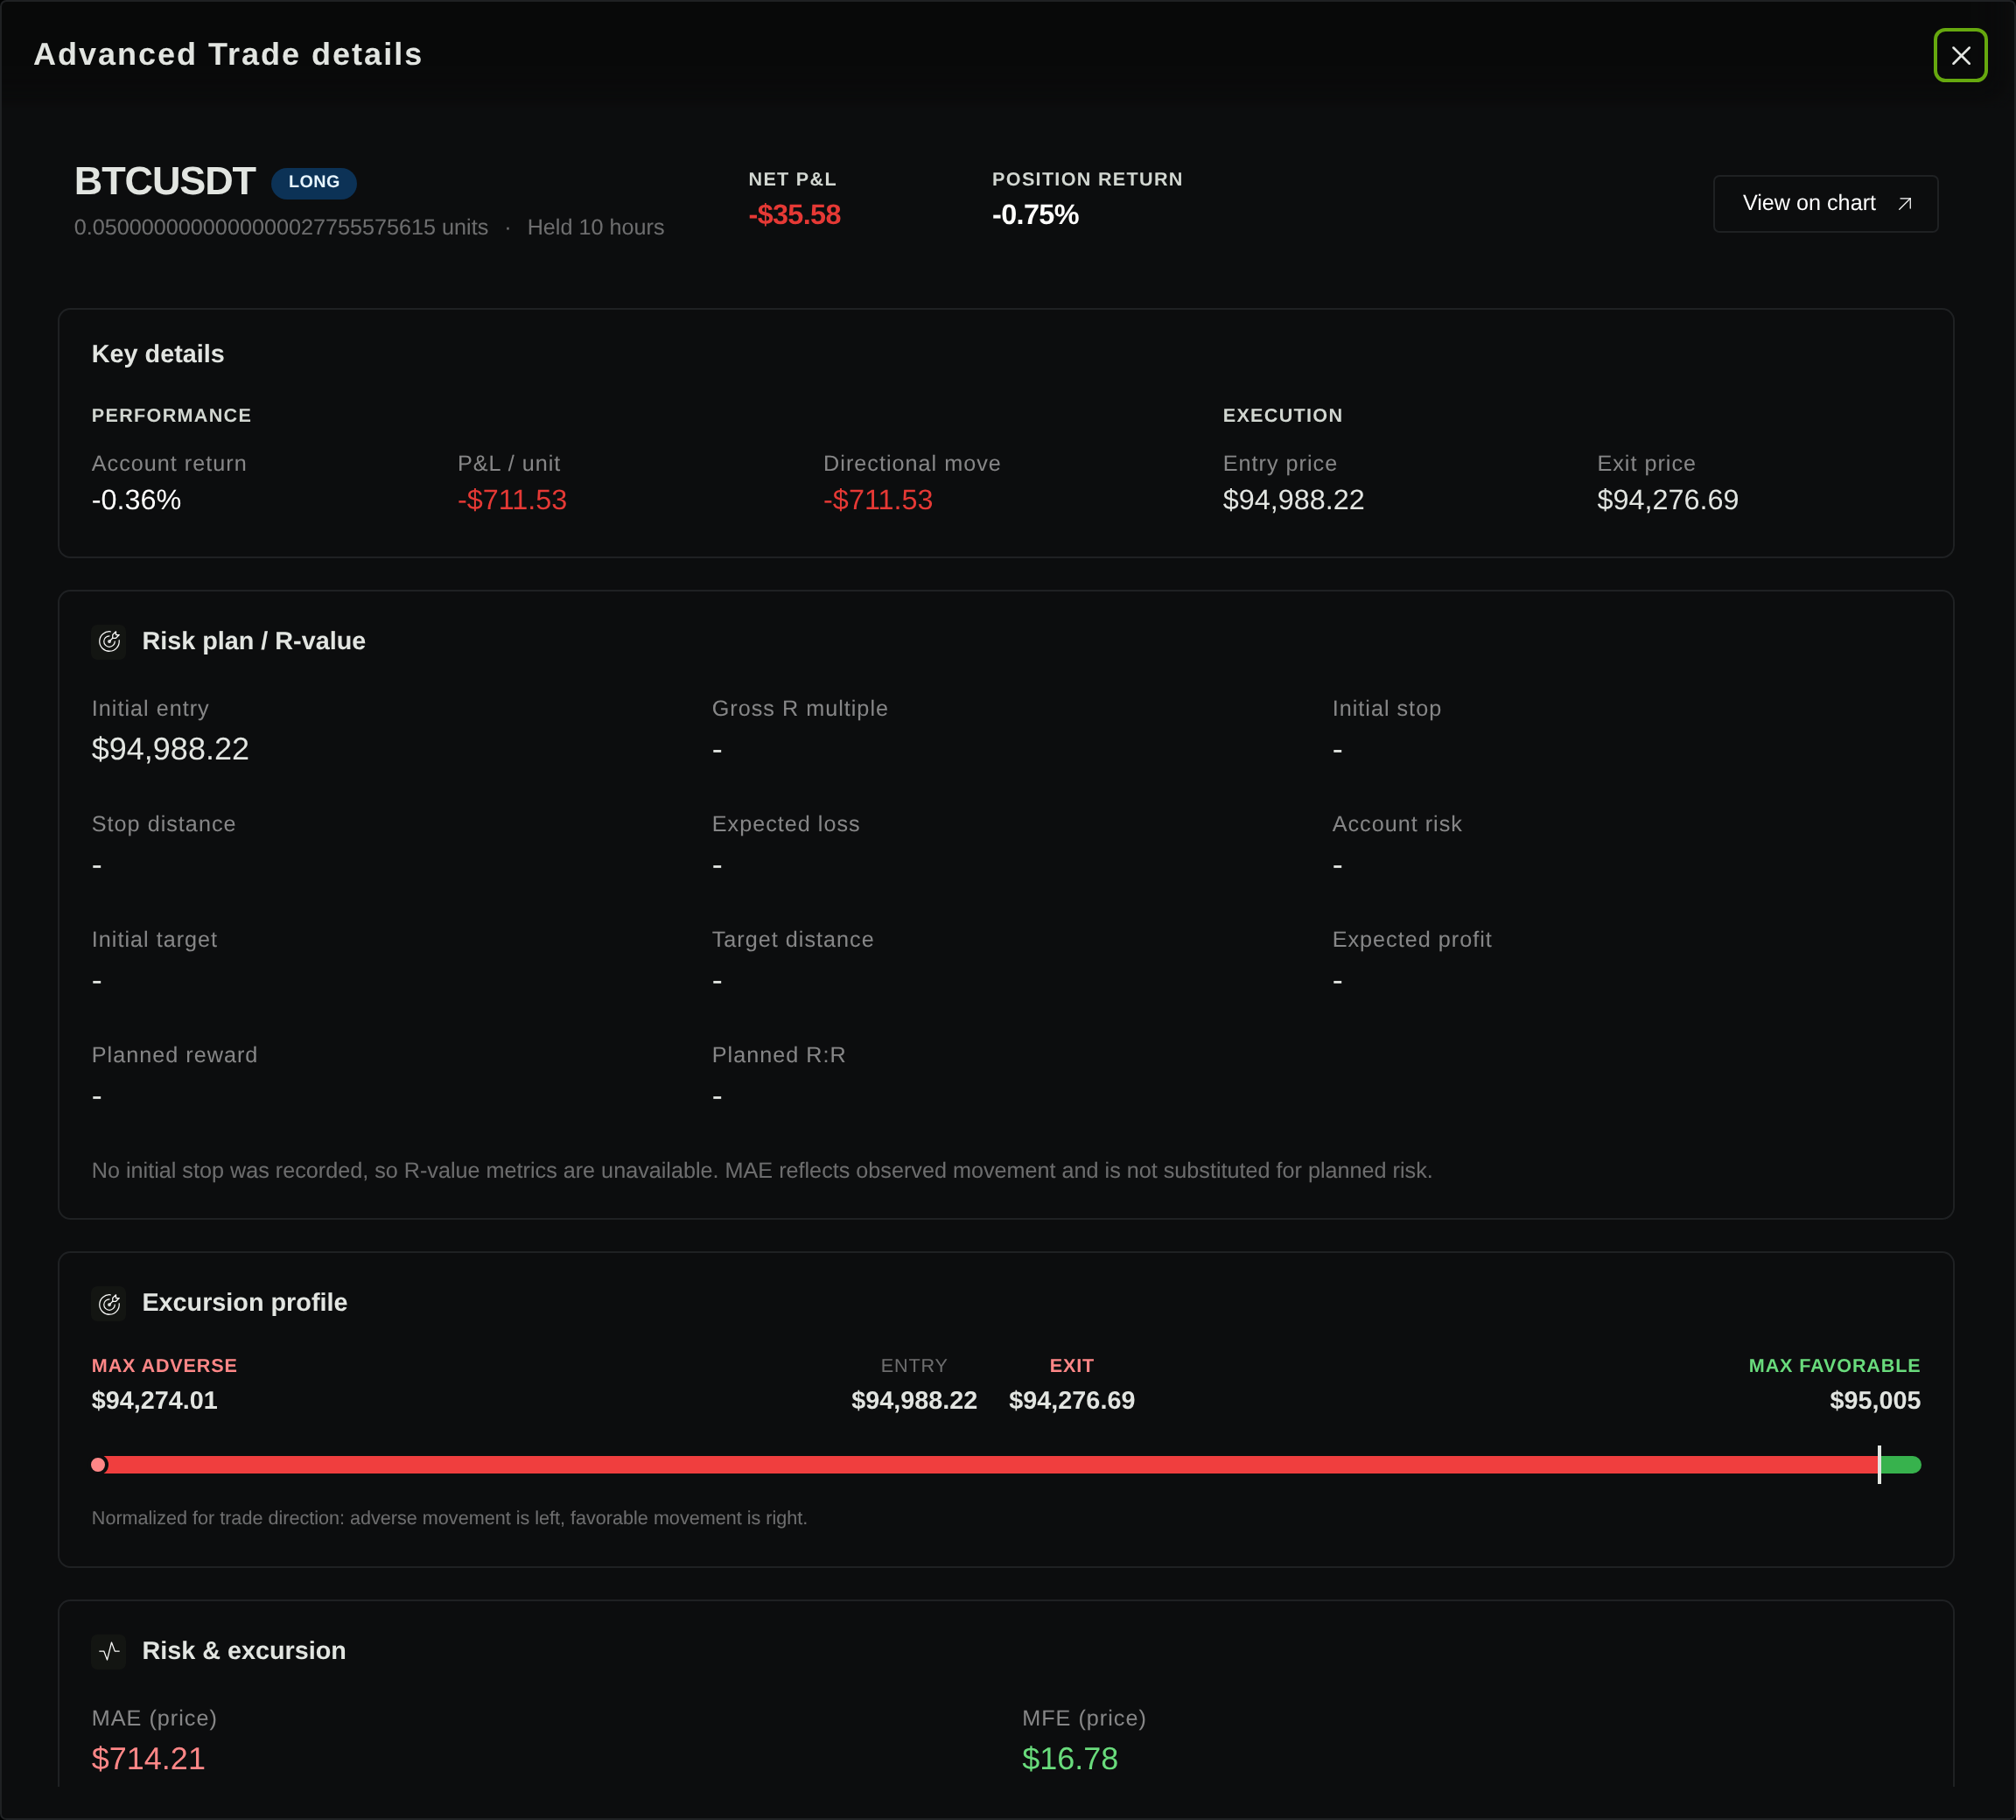
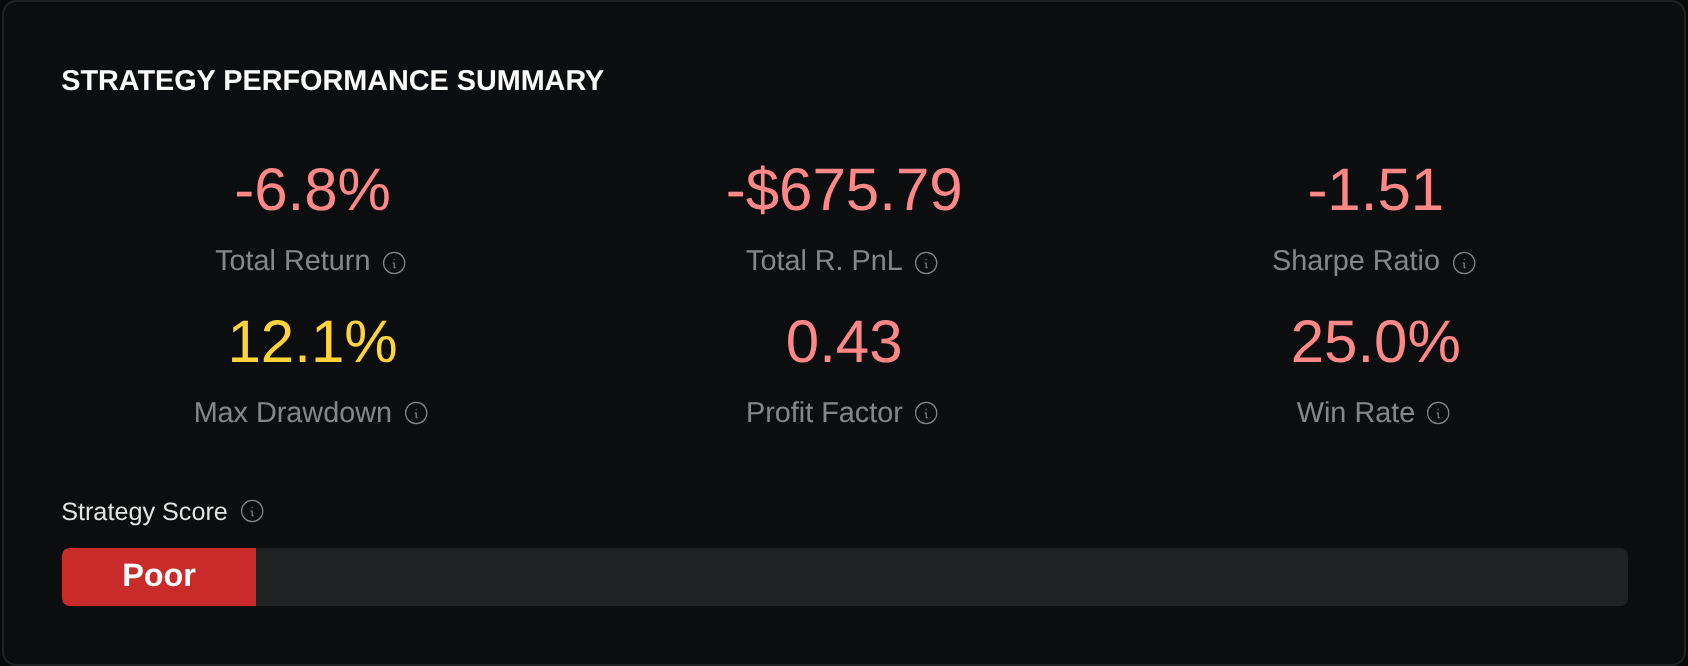
The selected trade’s reported −35.576615 equals its fill-price difference multiplied by 0.05 BTC. Applying the illustrative quote-currency 0.10% formula separately would add approximately 9.463245 of round-trip fees, producing approximately −45.039860. That separate arithmetic illustrates the missing charge; it is not the platform’s recorded cash ledger or a repair to its report.
The useful question is concrete: after the costs your fills incur, how far must the price move before this trade earns anything? Start with that threshold, then inspect whether the historical trade ledger uses the same assumptions.
Use Stratifyre’s execution-modeling guide to review fill and slippage assumptions before auditing one existing backtest against your exchange’s verified fees.
Put your strategy rules to the test
Build your strategy, inspect historical trades, and review the assumptions behind your results.
Build and test your strategy