How to test an Ethereum Bollinger Band breakout strategy
Turn an ETH band breakout into explicit entry and exit rules, compare nearby settings, and inspect the false breakouts that a headline return can hide.
An Ethereum candle reaches the upper Bollinger Band. Is that a reason to buy, sell, or wait? The indicator alone cannot answer: a wick touching the band, a close above it, and a fresh upward crossing are different events.
For a breakout test, start with one question: does a completed ETH candle crossing above the upper band lead to a useful move before price closes below the middle band? Define that rule before selecting parameters. Then examine the trades that fail, alongside the ones that continue.
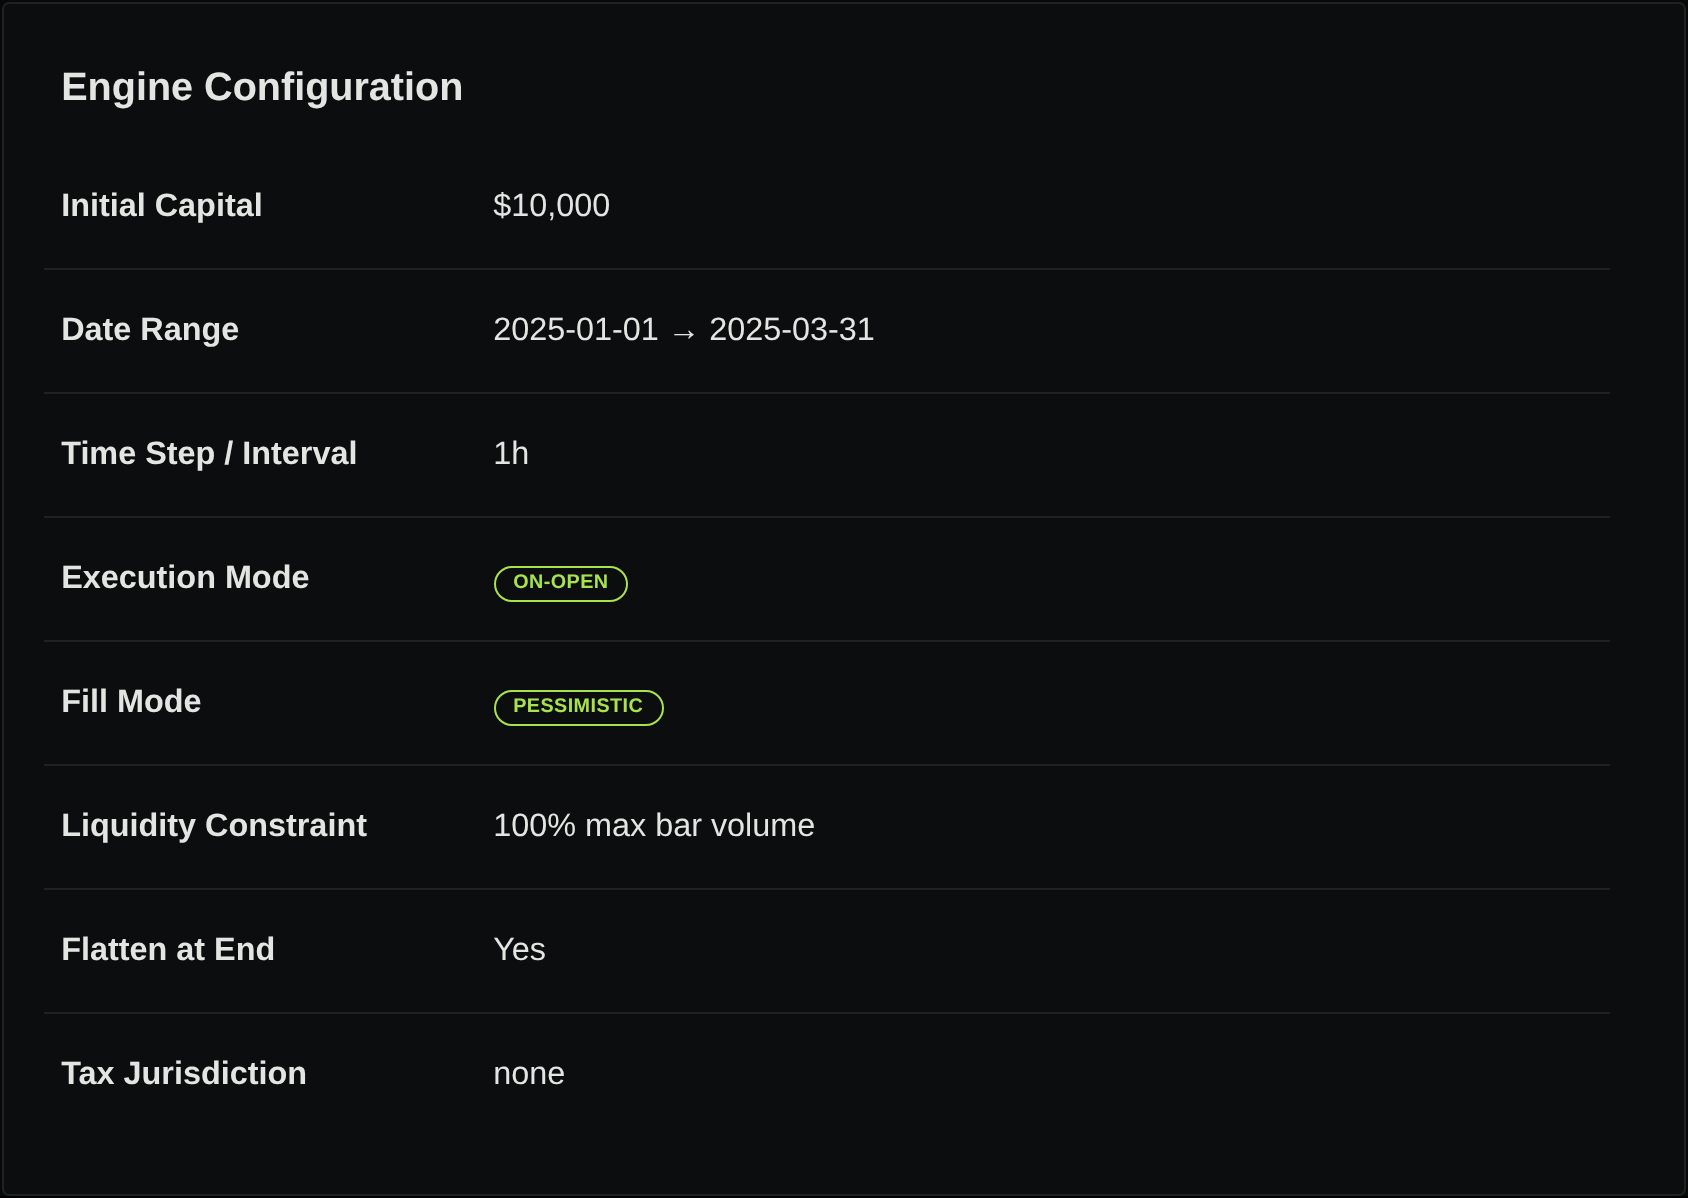
The plan below is an illustrative research worksheet. The product captures show a separate, executed January–March 2025 demonstration; its unresolved fee and chart-replay discrepancies prevent treating the displayed return as a validated trading result.
A band touch is not a breakout rule
Traditional Bollinger Bands place an upper and lower boundary around a simple moving average. Their distance from the middle depends on the standard deviation of prices over the same lookback. A common starting configuration is 20 periods with a multiplier of 2. On an hourly chart, those are 20 hourly observations, not 20 days. Fidelity’s indicator guide explains this construction.
For this experiment, use closing prices. Let N be the lookback, K the multiplier, and SD the population standard deviation of those N closes, with variance divided by N:
Middle = SMA(N closes)Upper = Middle + K × SDLower = Middle − K × SDThe bands change with each new candle. Compare each candle with the band calculated for that candle; comparing yesterday’s close with today’s band changes the rule.
| Event | Exact question | Consequence for the test |
|---|---|---|
| Upper-band touch | Did the candle’s high reach the upper band? | Includes wicks that finish back inside. |
| Close outside | Did the completed close finish above the upper band? | Can remain true for several candles. |
| Upward crossing | Was the prior close at or below its upper band, and is the current close above its upper band? | Identifies a new transition. |
| Return inside | Did price close back below the upper band after being above it? | Could define a separate, faster exit experiment. |
Do not assume a touch predicts a reversal. John Bollinger’s published rules distinguish band tags from trading signals and describe how trending prices can follow a band. Equally, crossing above a band does not prove that the next trade will succeed.
Choose the market before the settings
“ETH” is incomplete market identification. Record the exchange, quote currency, spot instrument identifier, and available historical range. An ETH/USDT series from one venue is a different dataset from an ETH/USD series elsewhere.
Use a long-only spot experiment: buy ETH with the quote currency and later sell the held ETH. Do not add short selling, borrowing, leverage, or a perpetual contract to this baseline. Those changes introduce a different instrument or account model and need their own test assumptions.
Here is one proposed worksheet. Confirm the exact instrument and continuous data coverage before using it; the dates do not assert that a particular venue’s history is available in Stratifyre.
| Input | Research plan |
|---|---|
| Market | One verified ETH/USDT spot instrument on one recorded venue |
| Candle interval | 1 hour, with UTC candle boundaries |
| Initial evaluation window | 2025-01-01 00:00 UTC to 2025-07-01 00:00 UTC, end excluded |
| Reserved later window | 2025-07-01 00:00 UTC to 2025-10-01 00:00 UTC, end excluded |
| Starting cash | Illustrative 10,000 USDT |
| Entry size | Illustrative 1,000 USDT target notional per entry; no compounding |
| Position policy | At most one long position; no adding while invested |
| Base indicator | Close source, period 20, deviation multiplier 2 |
The initial window covers January 1 through June 30; the later window covers July 1 through September 30. When using an inclusive calendar End Date field, enter June 30 and September 30 respectively, rather than the exclusive endpoints above. Confirm the saved run boundaries before comparing results.
Keep sizing separate from the signal. A 1,000 USDT allocation means the ETH quantity varies with price; it does not mean a fixed loss of 1,000 USDT or a fixed percentage risk. There is no protective stop in this particular exit experiment.
Write two rules that can be checked candle by candle
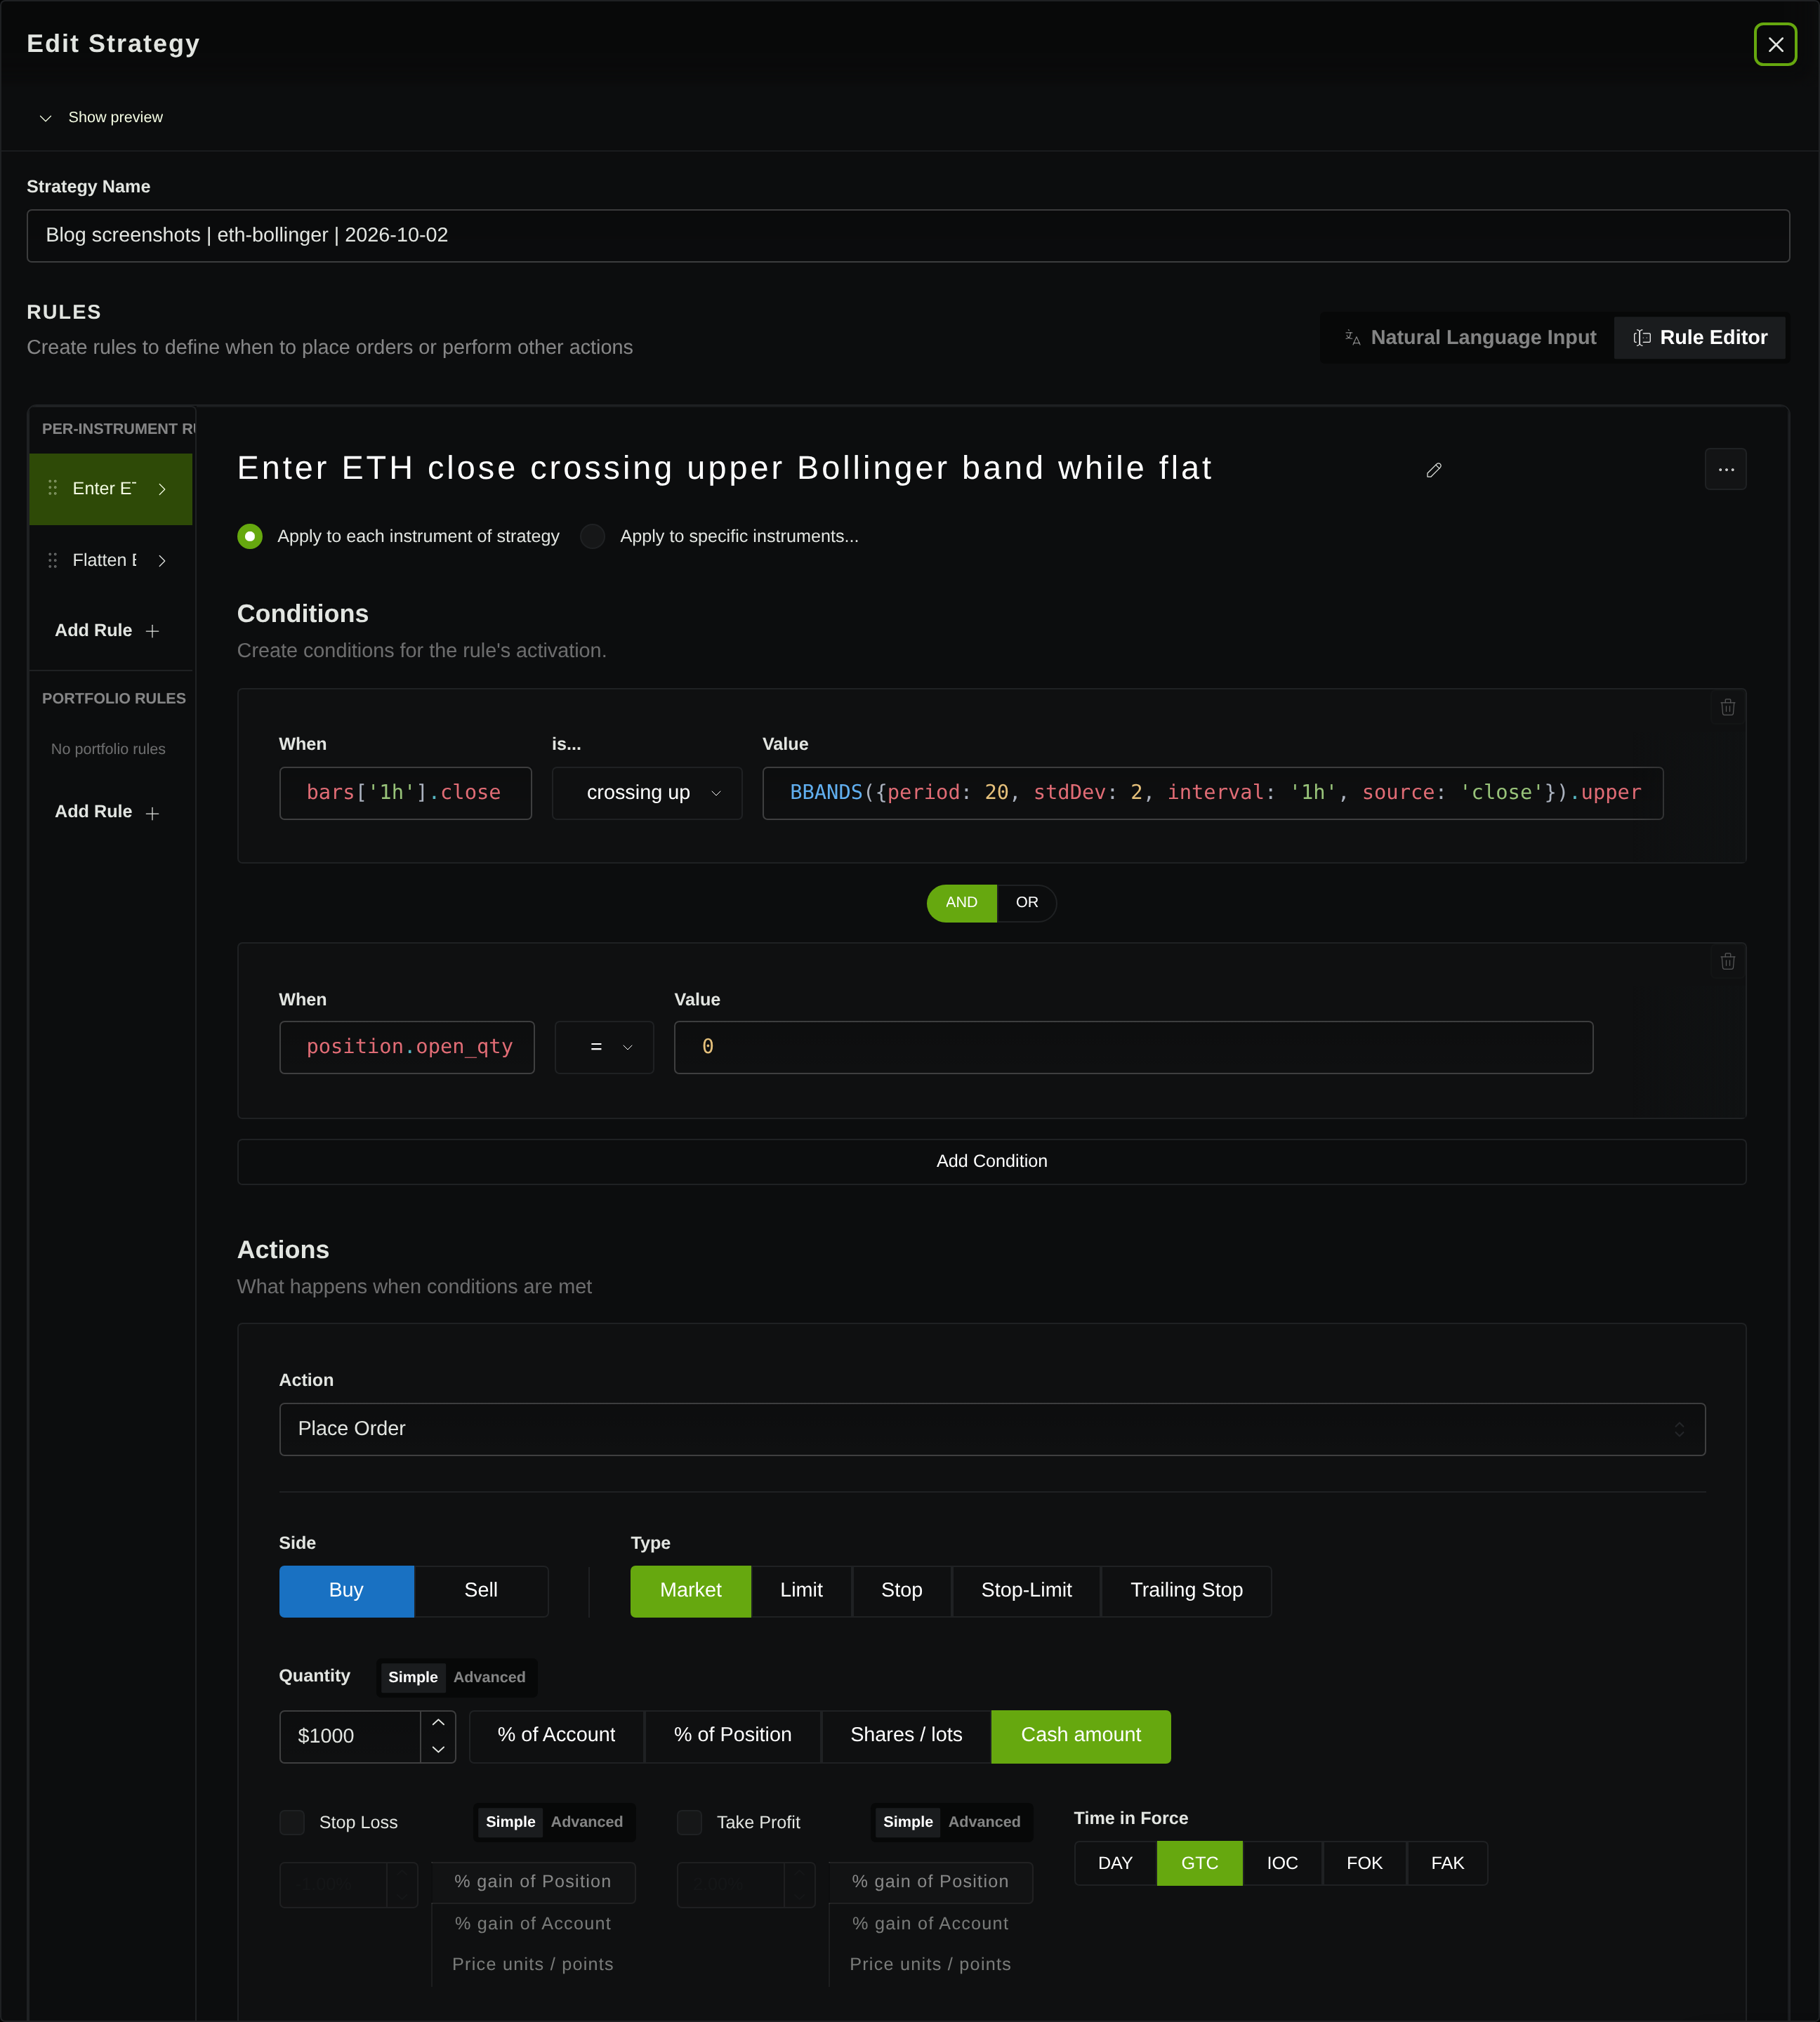
Entry: when flat, the previous completed close was at or below the previous upper band, and the latest completed close is strictly above its upper band. Submit one buy order only after that latest candle is complete.
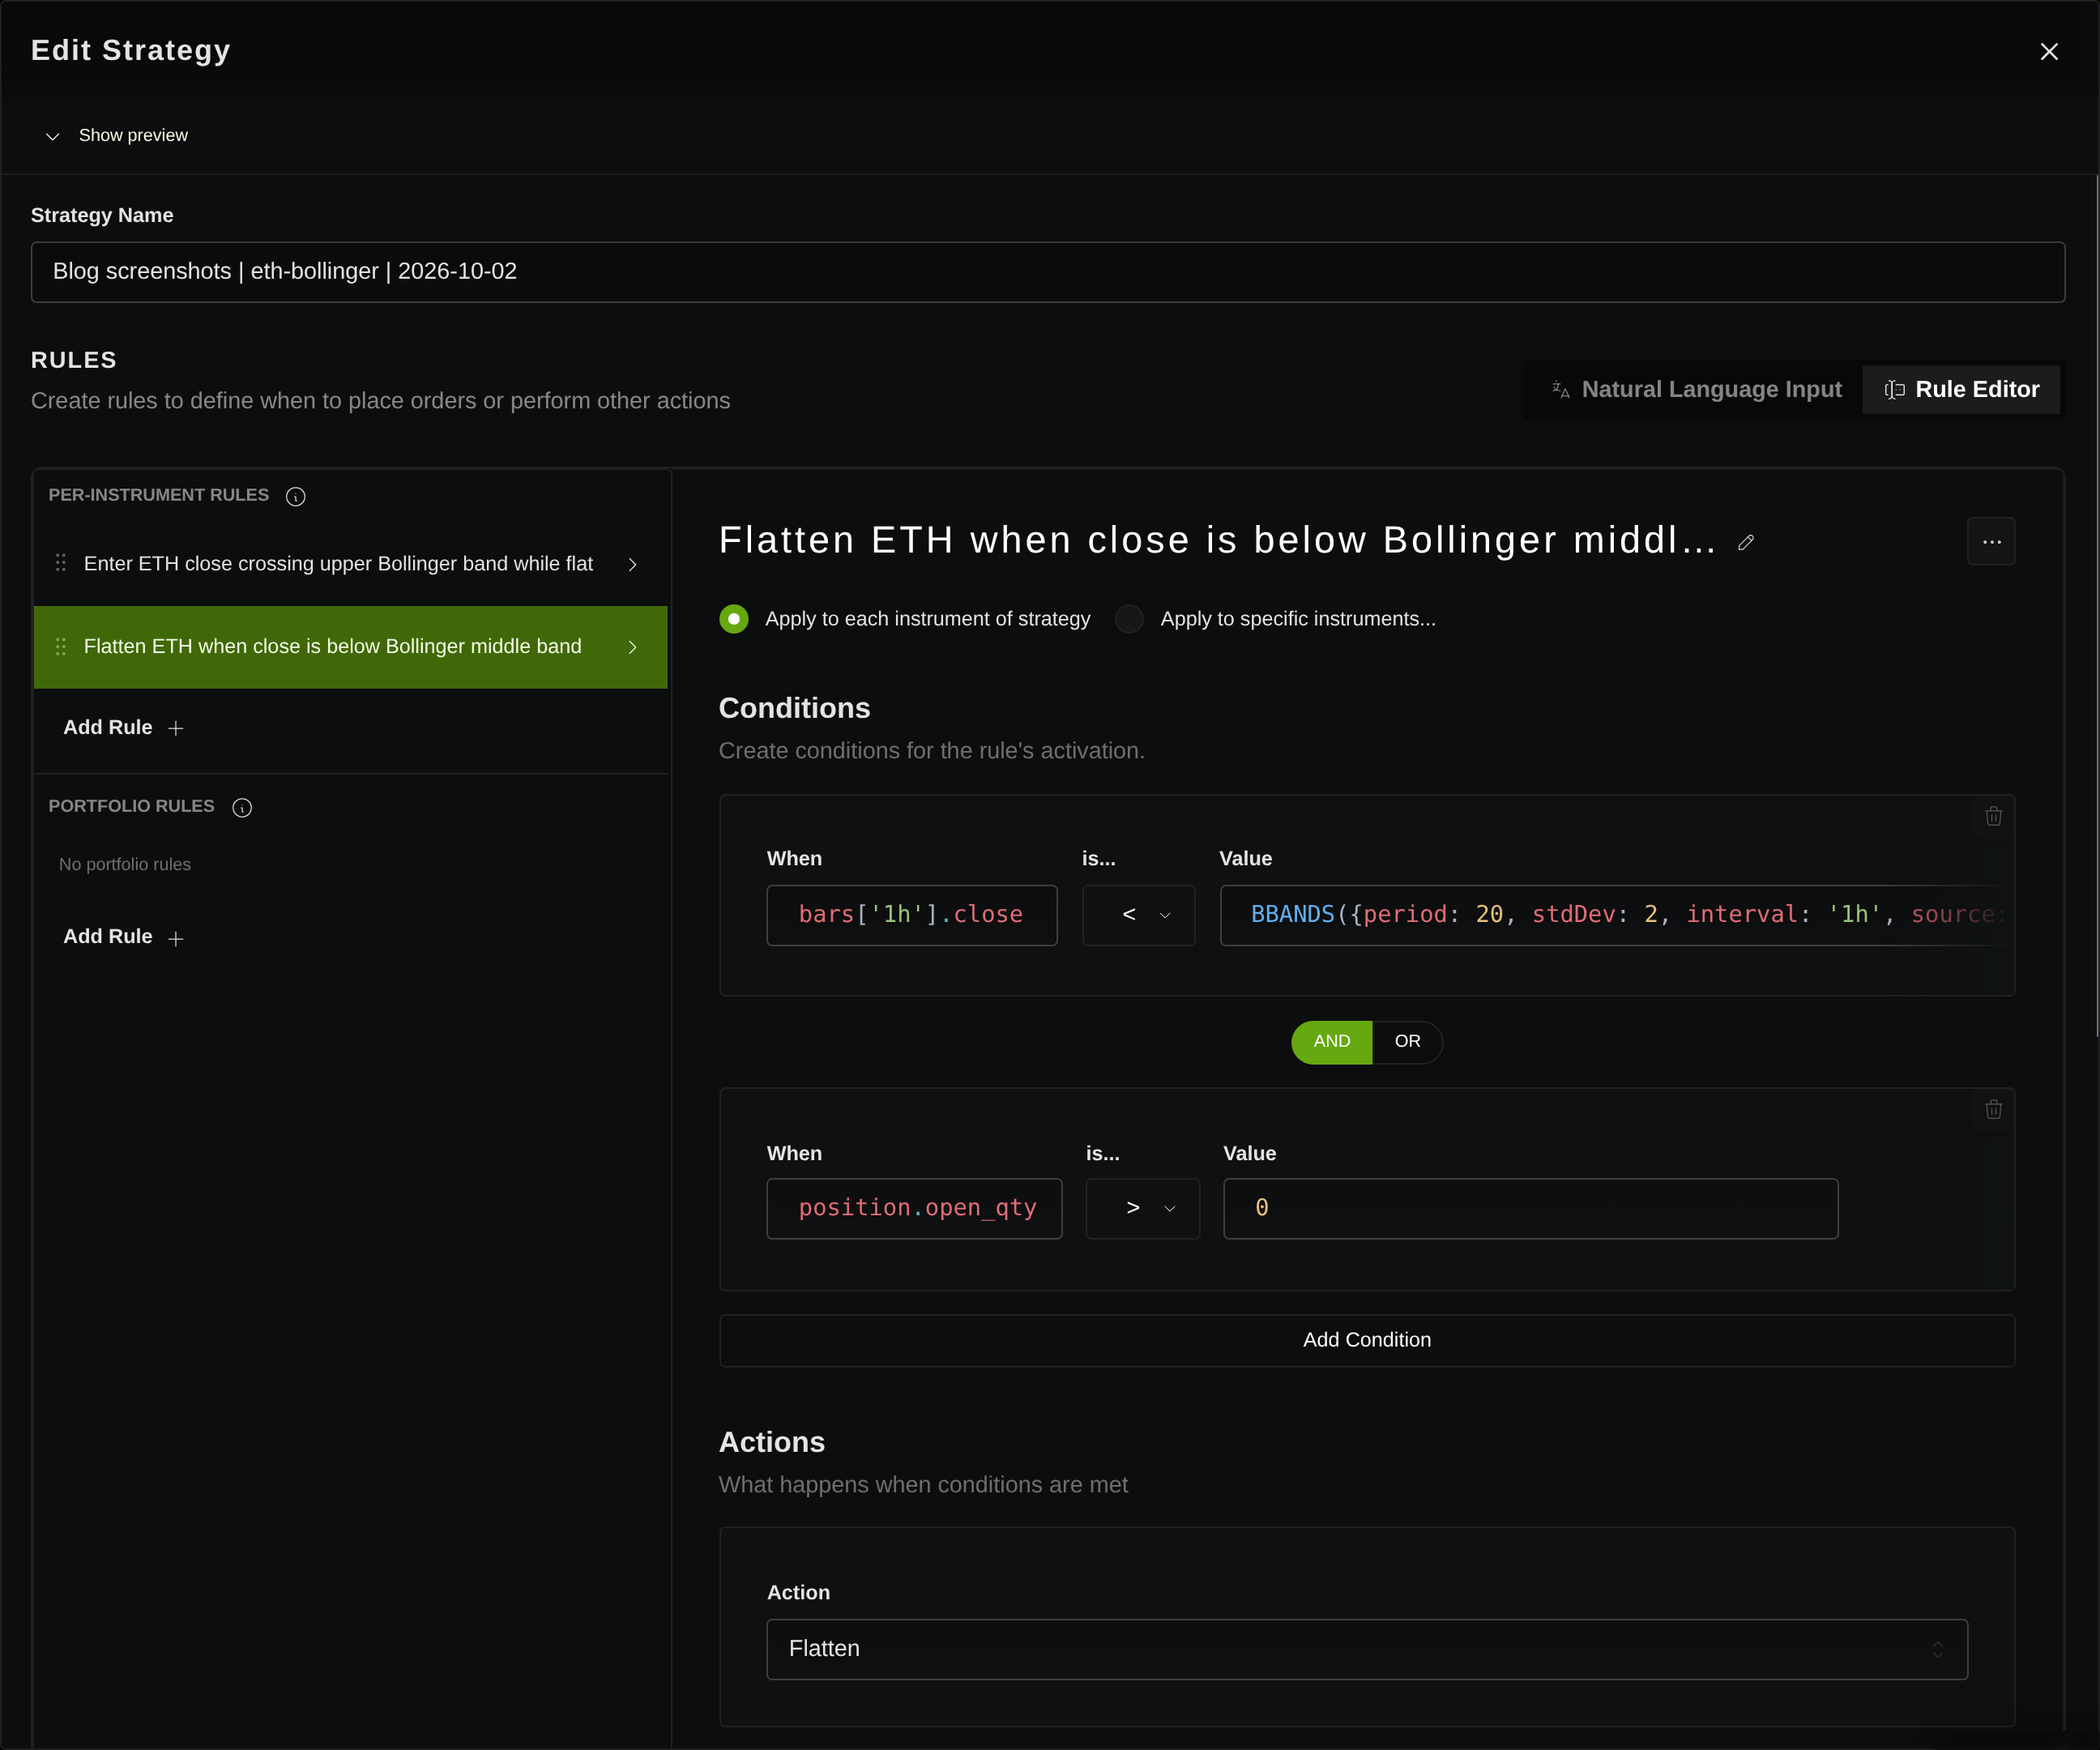
Exit: while holding ETH, the latest completed close is strictly below its middle band. Submit an order to sell the held quantity after that candle completes. Equality alone does not trigger either rule.
This exit uses a level condition rather than requiring a fresh downward crossing. It can still close a position when price is already below the middle band. Returning inside the upper band does not trigger this exit; mixing the two would change the hypothesis.
Require the order record to show that the signal candle was available before the fill. The intended baseline is a subsequent tradable price, with recorded execution costs. Do not assume a setting’s name establishes this ordering, and do not award an entry at the beginning of the candle whose final close generated it. Check at least the first entry and first exit against their timestamps and candles.
Warmup matters too. A 20-period calculation needs 20 observations, and a crossing needs a valid previous comparison as well. Supply preceding history and inspect when the first eligible signal occurs. For the parameter comparison below, give every run enough preceding candles for the longest lookback plus a previous valid observation. Warmup candles supply context; they should not silently extend the evaluation window.
Stratifyre’s rule reference documents Crossing Up and ordinary comparisons. Check the saved rule’s operands, interval, position guard, and action quantity against the definitions above. An AI-generated strategy still needs that inspection.
Fix costs and order handling before comparing periods
Use fees applicable to the selected account, pair, and order. Binance’s spot commission FAQ distinguishes standard, tax, and special commission components; its numerical examples are fictional, not current fee quotes. Do not copy those example rates into an ETH experiment.
Record the supported fee model and both entry and exit costs. Also declare a slippage assumption and keep it identical across variants. If the simulator’s model cannot represent your intended charges, describe the approximation before interpreting net results.
Check quantity rounding, rejected orders, partial fills, and pending orders. “One position” should also prevent duplicate entries while an entry order remains pending. At the window end, choose and record whether any remaining position is liquidated or valued as open; apply the same policy to every run.
Compare a small neighboring set
Before viewing outcomes, select 18, 20, and 22 periods, each with multiplier 2. These are neighboring sensitivity tests, not three recommended settings. Keep the market, dates, price source, timing, sizing, costs, and exit policy fixed. Changing the period changes both the outer bands and the middle-band exit.
For each completed run, record:
- Net return after modeled costs and the largest equity decline.
- Completed trade count and any open position at the end.
- Typical losing-trade size and time held.
- Fees and the number of rapid entries followed by exits.
- How much of the result comes from the largest winning trade.
A higher return with a much larger drawdown presents a different decision from a modest return with smaller losses. A run dominated by one exceptional ETH move needs that concentration made visible. Neither observation selects a reliable live setting by itself.
Keep the later window untouched until the initial comparison and selection rule are written down. Then apply the same frozen plan to that window. If you revise after seeing its outcome, it becomes development data; it is no longer an untouched check.
Inspect false breakouts on the chart
Define a review label in advance: for example, an entry followed by a middle-band exit within three completed hourly candles. This labels short-lived trades for inspection; it is not another exit rule, and such a trade need not be a loss.
Open several labeled trades, several longer-lived trades, and the largest loss. For each, check:
- The signal: did the close cross its own upper band, or did only the wick reach it?
- The fill: was it after the signal became available, and did costs worsen the entry?
- The exit: did a completed close fall below the middle band, or was the position closed by the end-of-window policy?
- The context: were entries clustered in sideways price action, or did price continue along the band?
If the trade log contradicts the intended rule, resolve that discrepancy before comparing profitability. If the rules are correct but repeated short-lived trades consume the result, that is evidence about this breakout hypothesis. Adding a squeeze, volume filter, or protective stop creates a new experiment; save the baseline before changing it.
What the executed demonstration actually shows
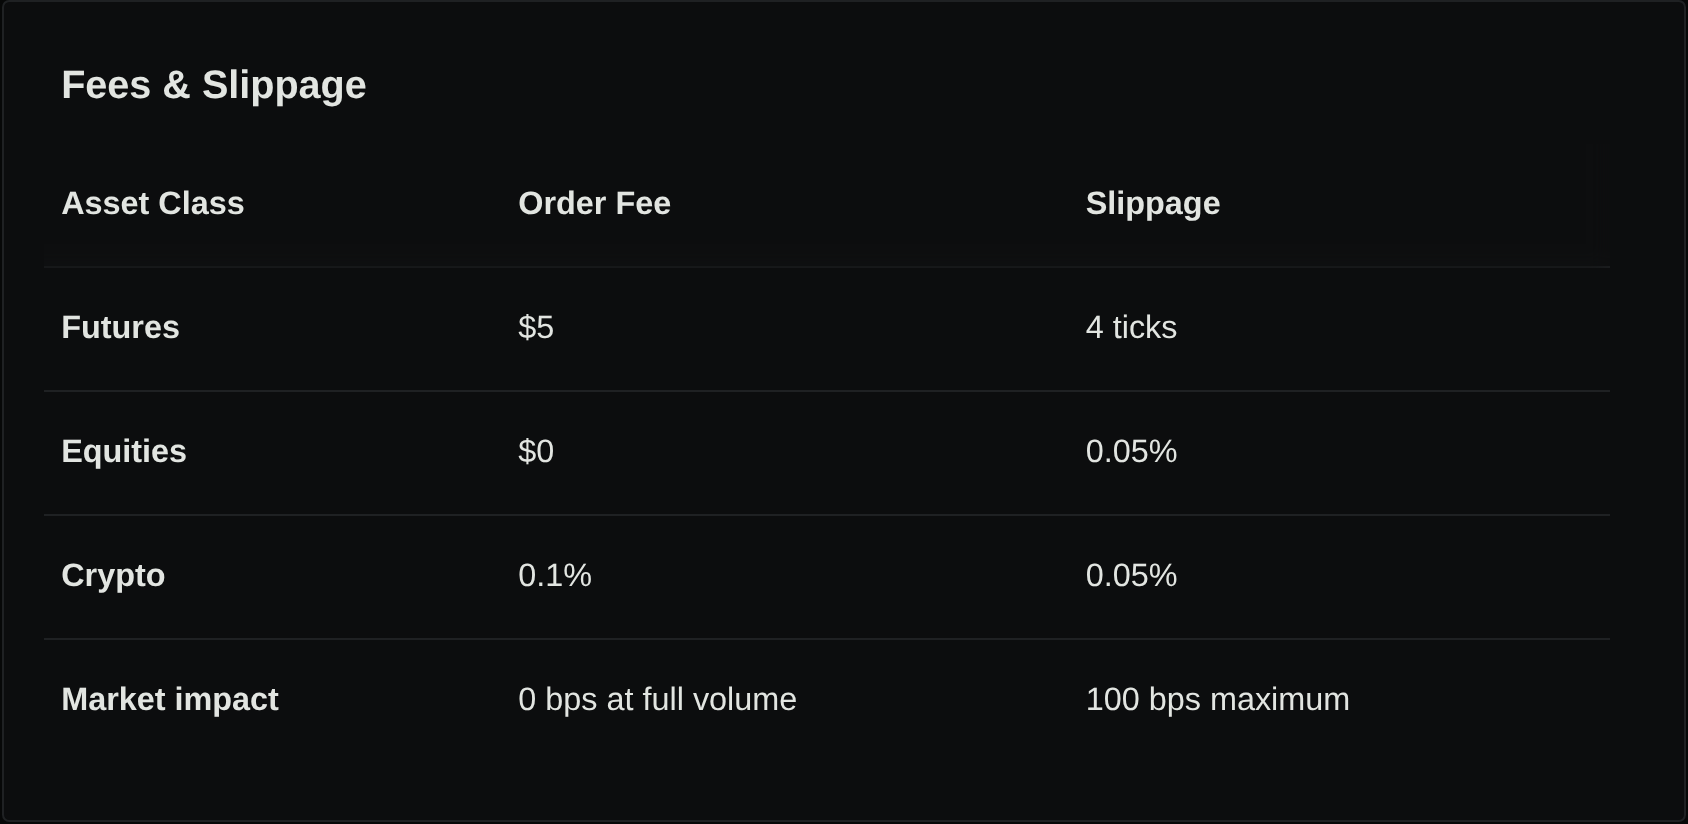
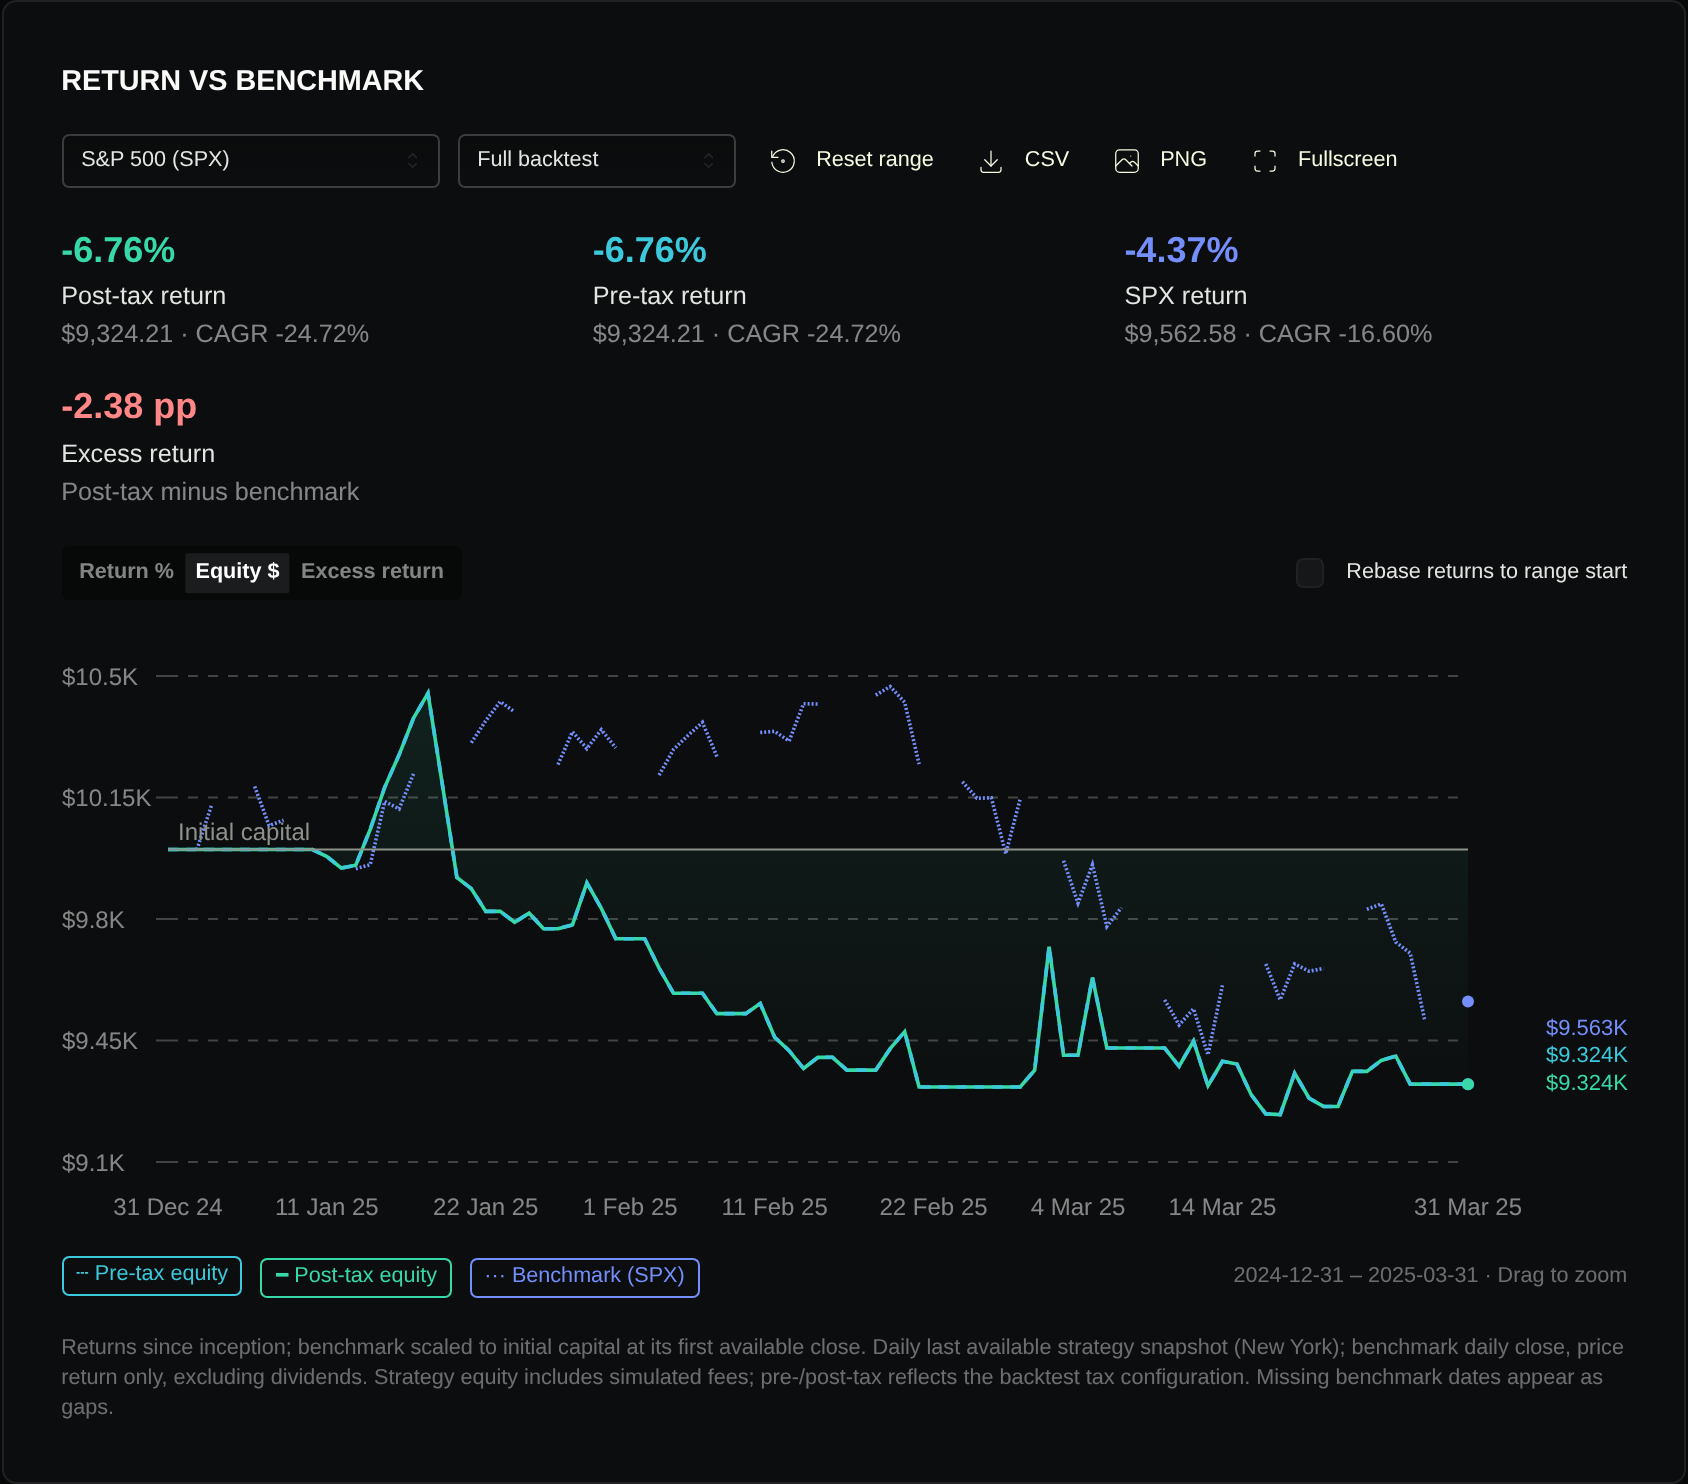
The dedicated demo account completed 39 trades for CRYPTO:BINANCE:ETHUSDT from January 1 through March 31, 2025. The report shows 673.11 profit and 10,673.11 ending equity from 10,000 starting capital. These are the simulator’s observed outputs, not evidence of a profitable, executable breakout strategy: the configured 0.10% crypto commission returned zero fees, and the first recorded trade does not reconcile with the chart’s replayed rule state.
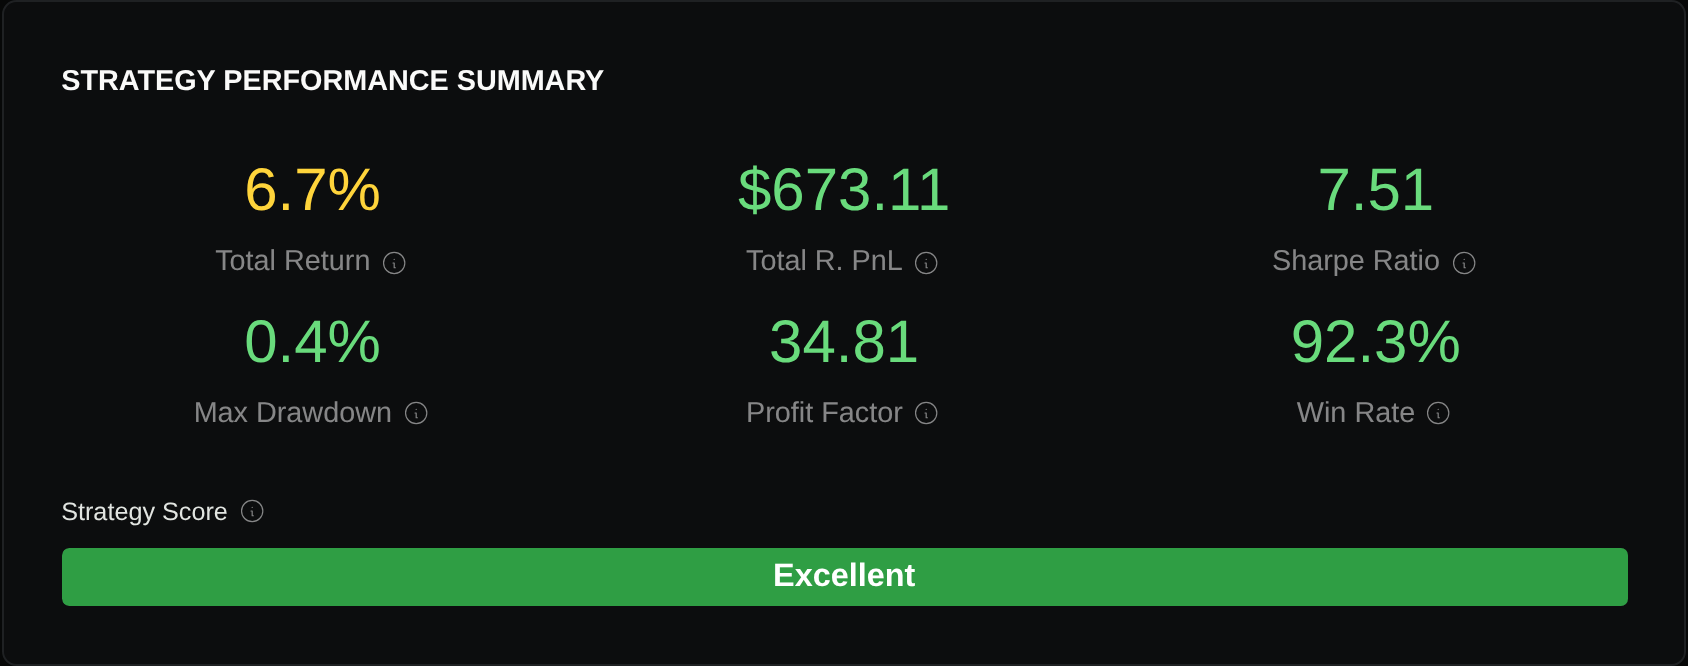
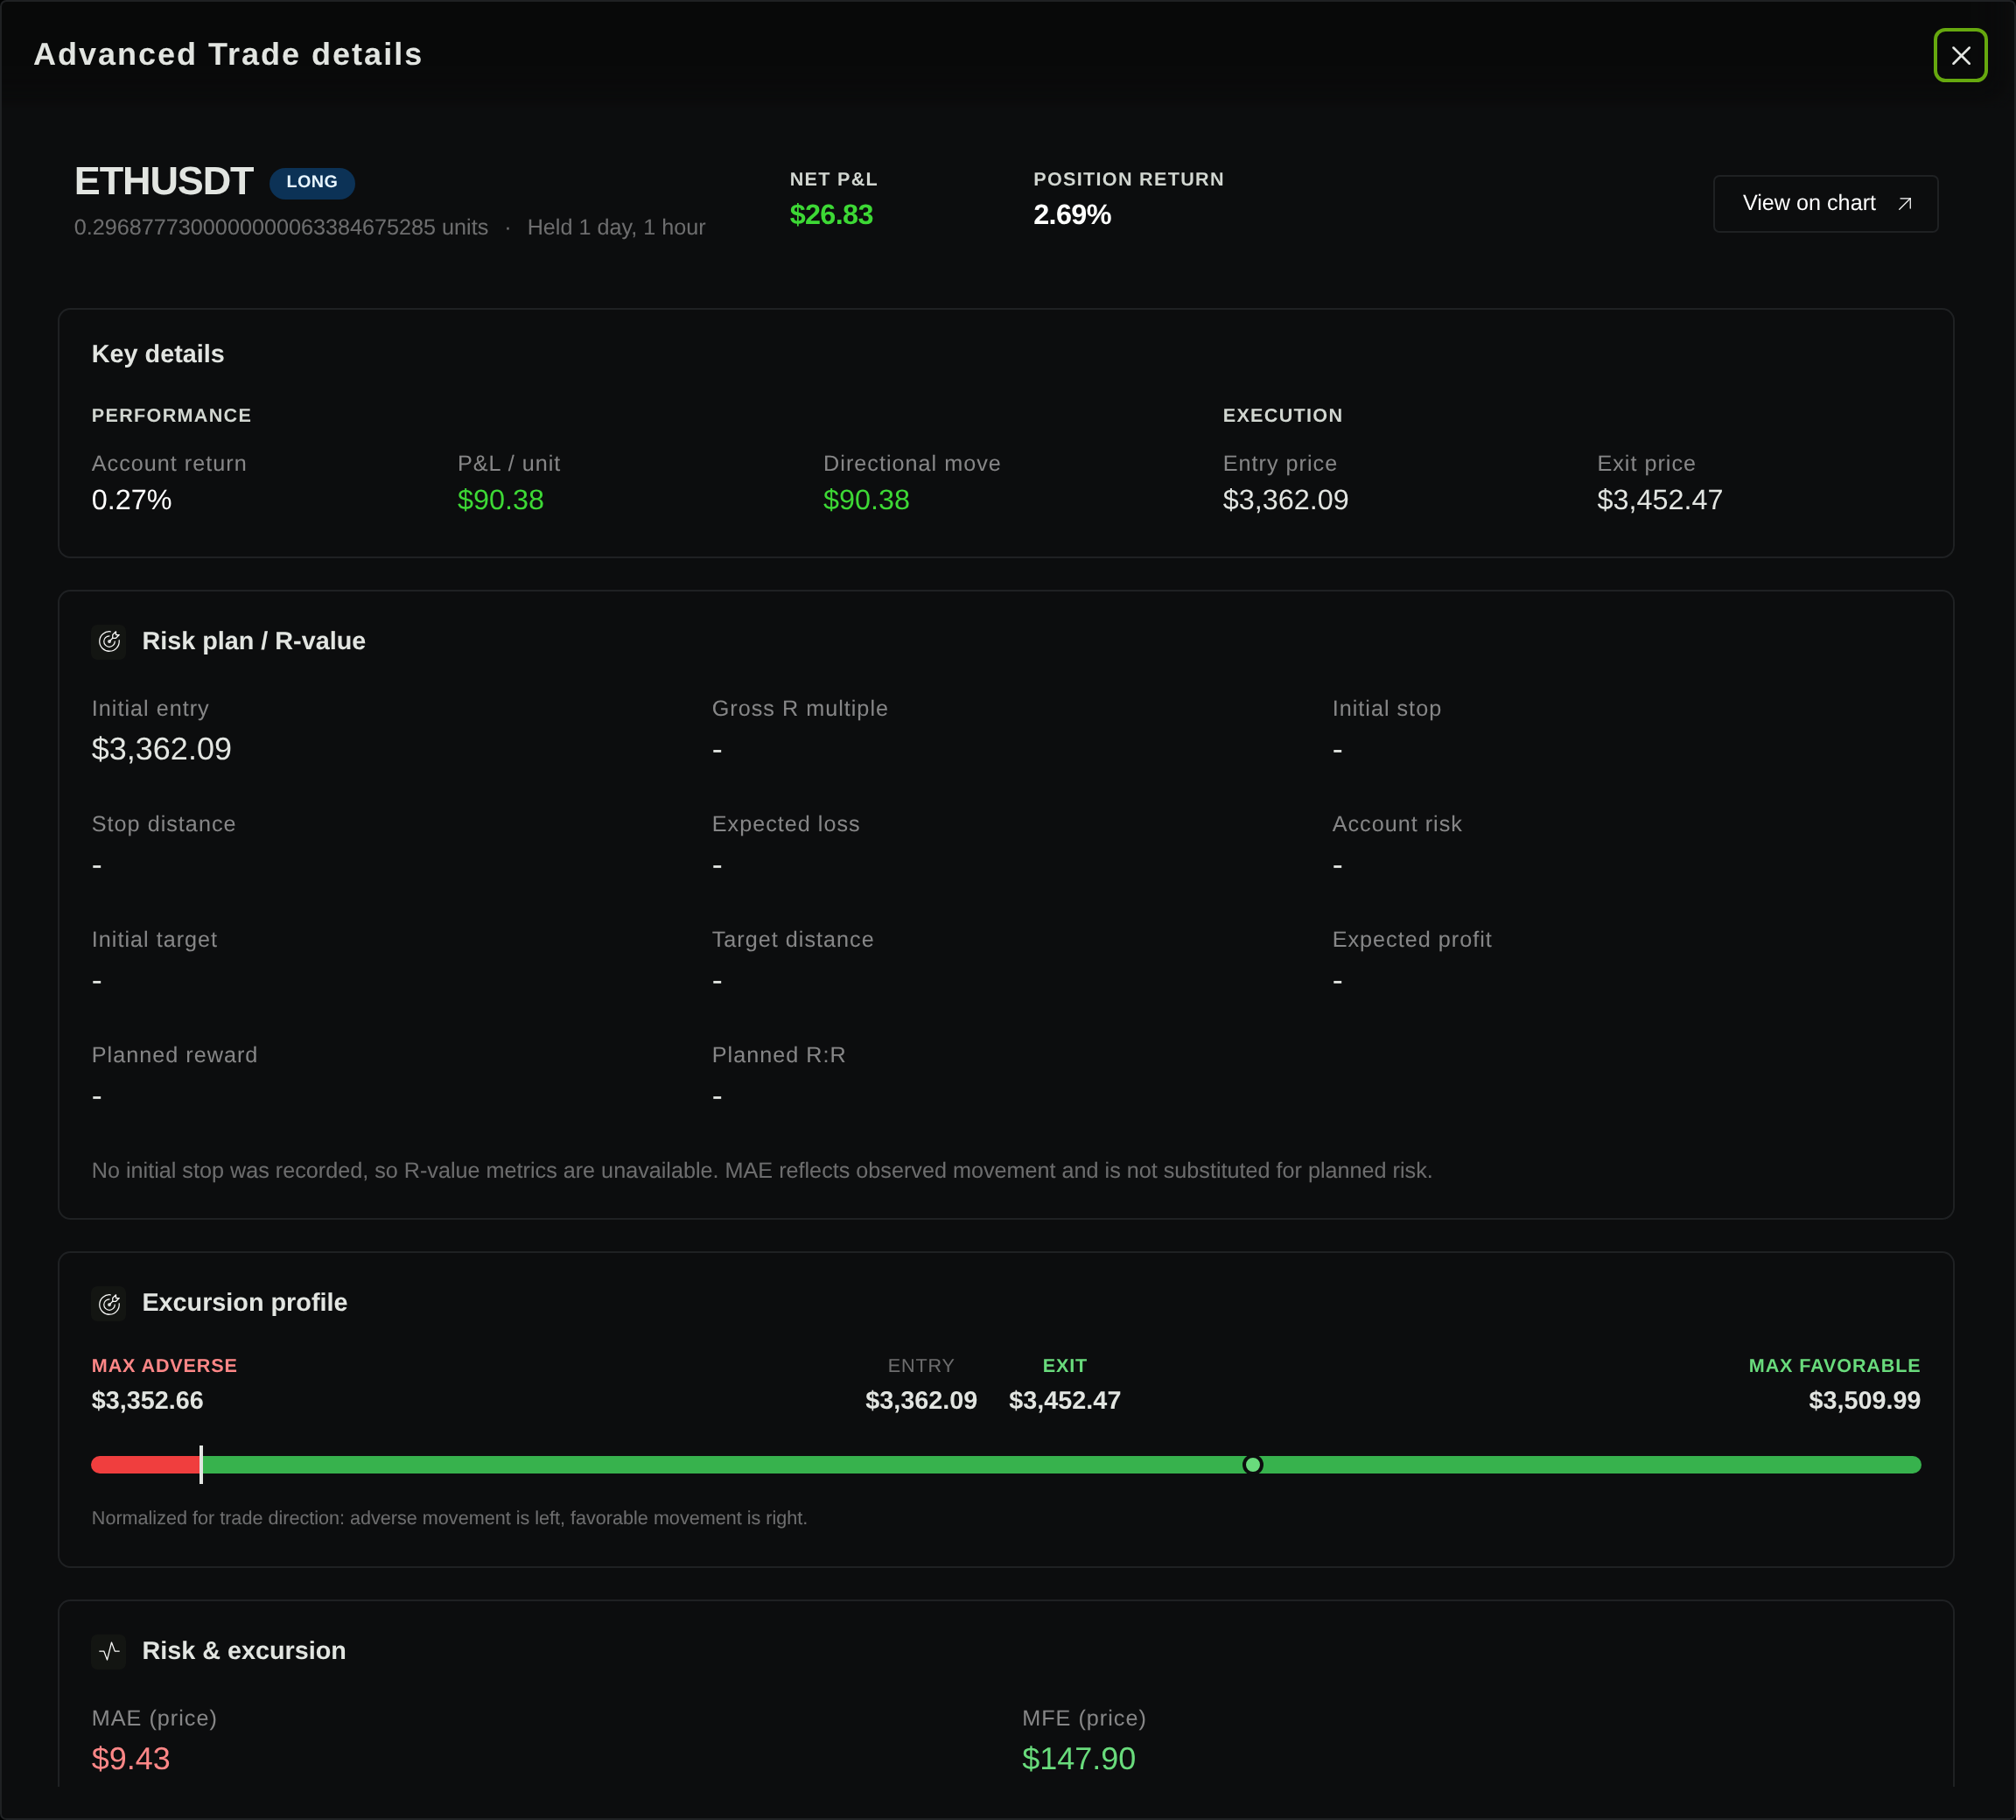
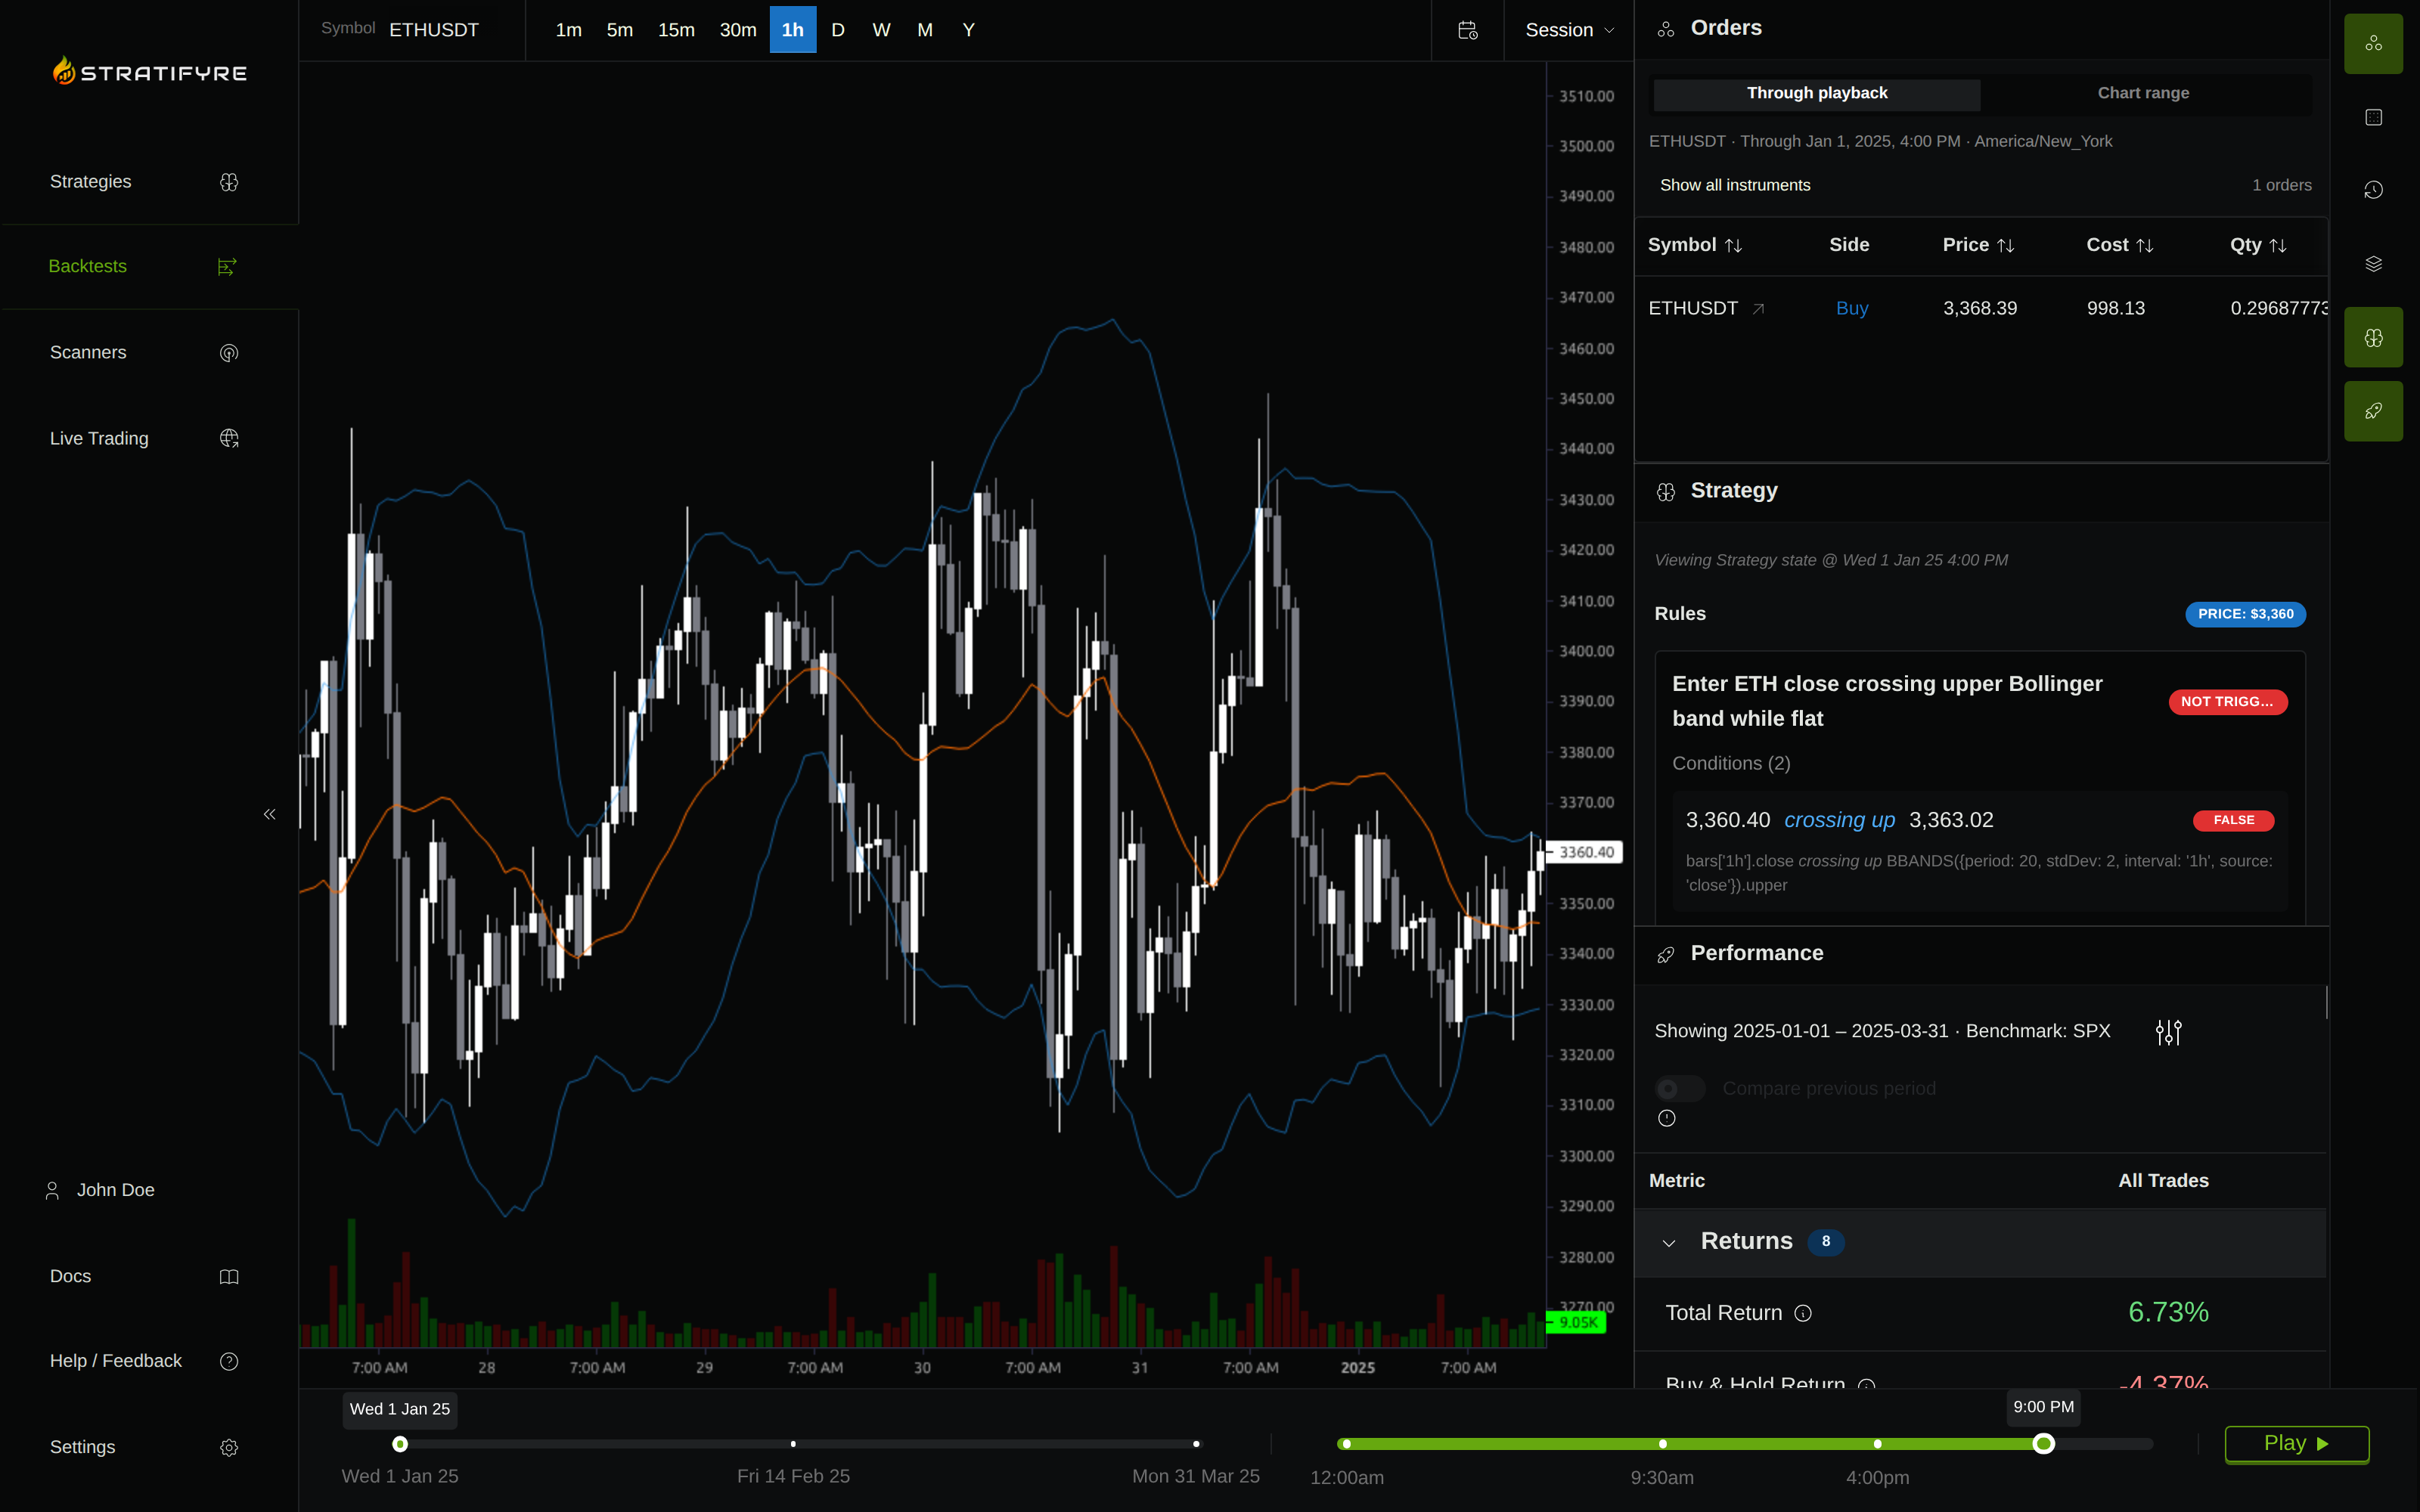
The proposed 18/20/22 comparison, six-month initial window and reserved later window have not been executed here. Resolve the fee and replay discrepancies before using this demonstration to choose a period or claim an advantage.
Use Stratifyre’s backtest setup guide to configure the explicit rule, then inspect the false breakouts before choosing what to test next.
Put your strategy rules to the test
Build your strategy, inspect historical trades, and review the assumptions behind your results.
Build and test your strategy