How to backtest a Bitcoin moving-average crossover without coding
A real Bitcoin EMA crossover backtest: the saved rules, 24 trades, a losing account result, and the cost checks to make before trusting it.
A Bitcoin moving-average crossover is easy to describe: buy when the fast average crosses above the slow average, sell when it crosses back below. The useful question is what those rules actually did.
We ran an hourly EMA(20)/EMA(50) strategy on Binance BTC/USDT spot for January–March 2025 in Stratifyre. It completed 24 trades and reduced a $10,000 simulated account to $9,324.21. That losing result is useful: it gives us actual fills and an account history to examine rather than a chart that merely makes the idea look plausible.
Define a cross before choosing settings
An exponential moving average, or EMA, weights recent prices more heavily and still responds with a delay. It cannot identify a turning point in advance. Fidelity’s EMA guide explains the weighting and lag.
For this run, the fast average used 20 hourly bars and the slow average used 50. These are example settings, not parameters established to be profitable.
An upward cross means the fast EMA moves from at-or-below the slow EMA to above it. That differs from “fast is above slow,” which can remain true for many bars. A state condition can cause repeated buys unless another rule prevents them.
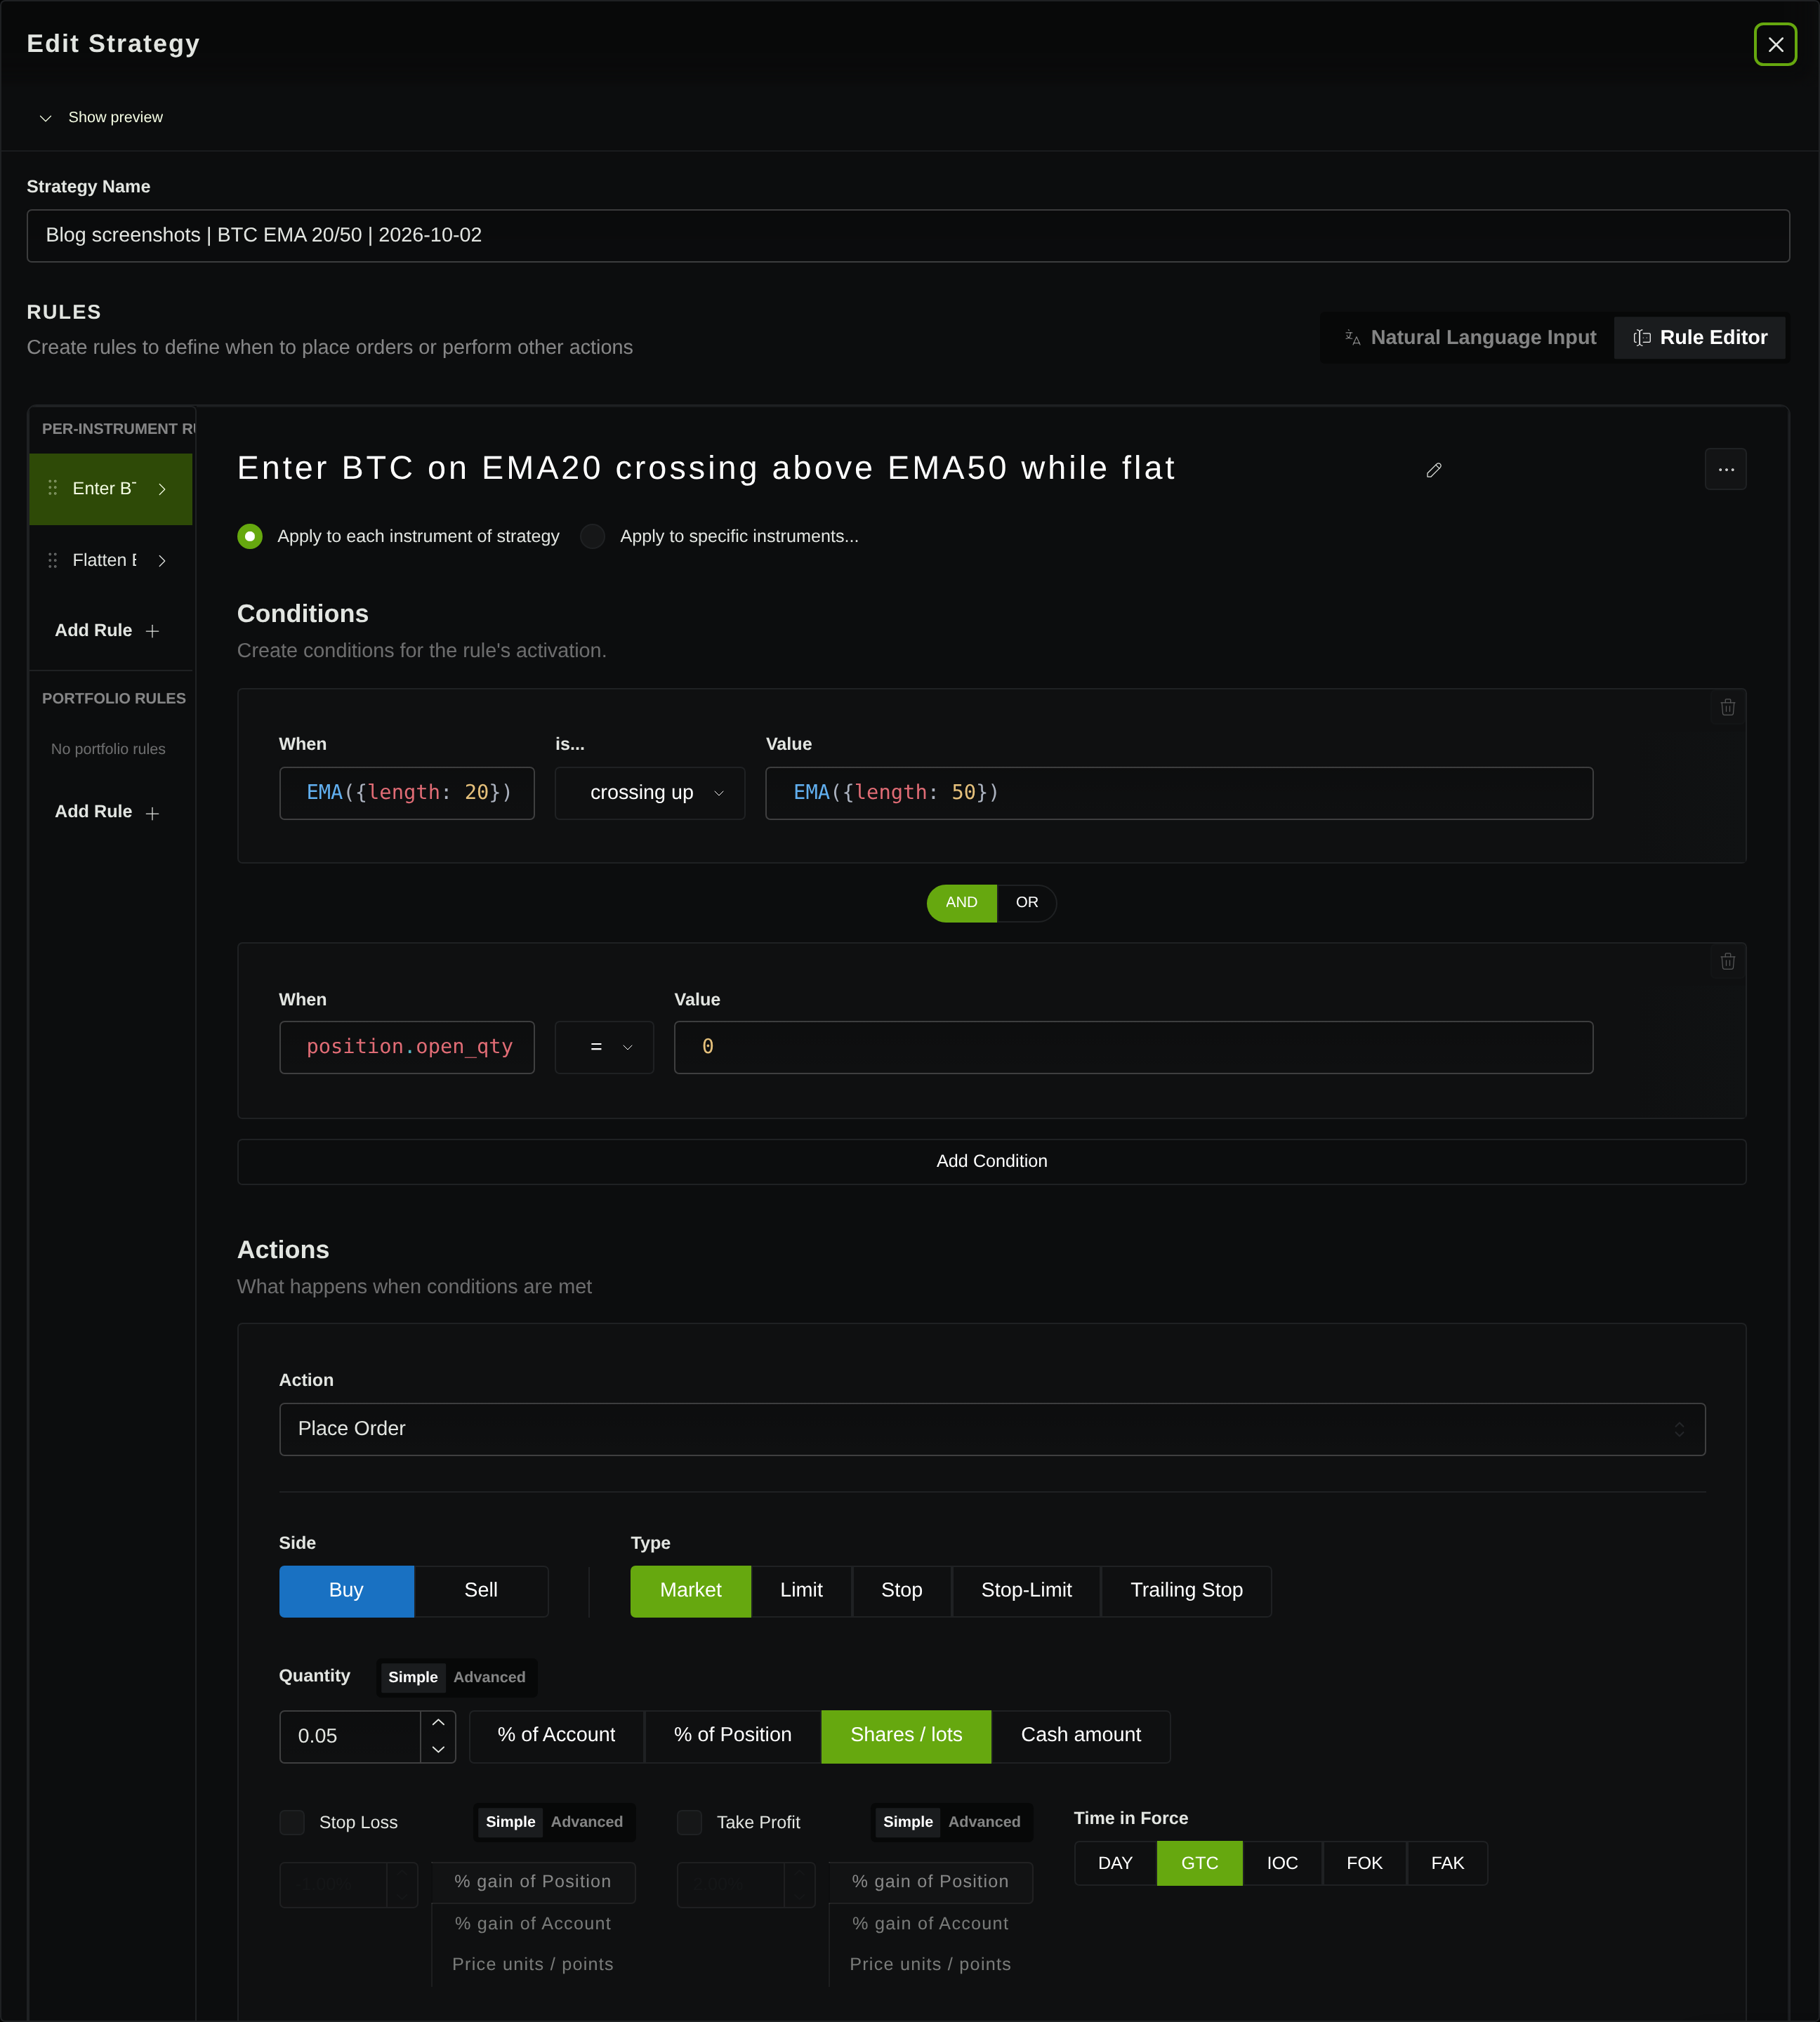
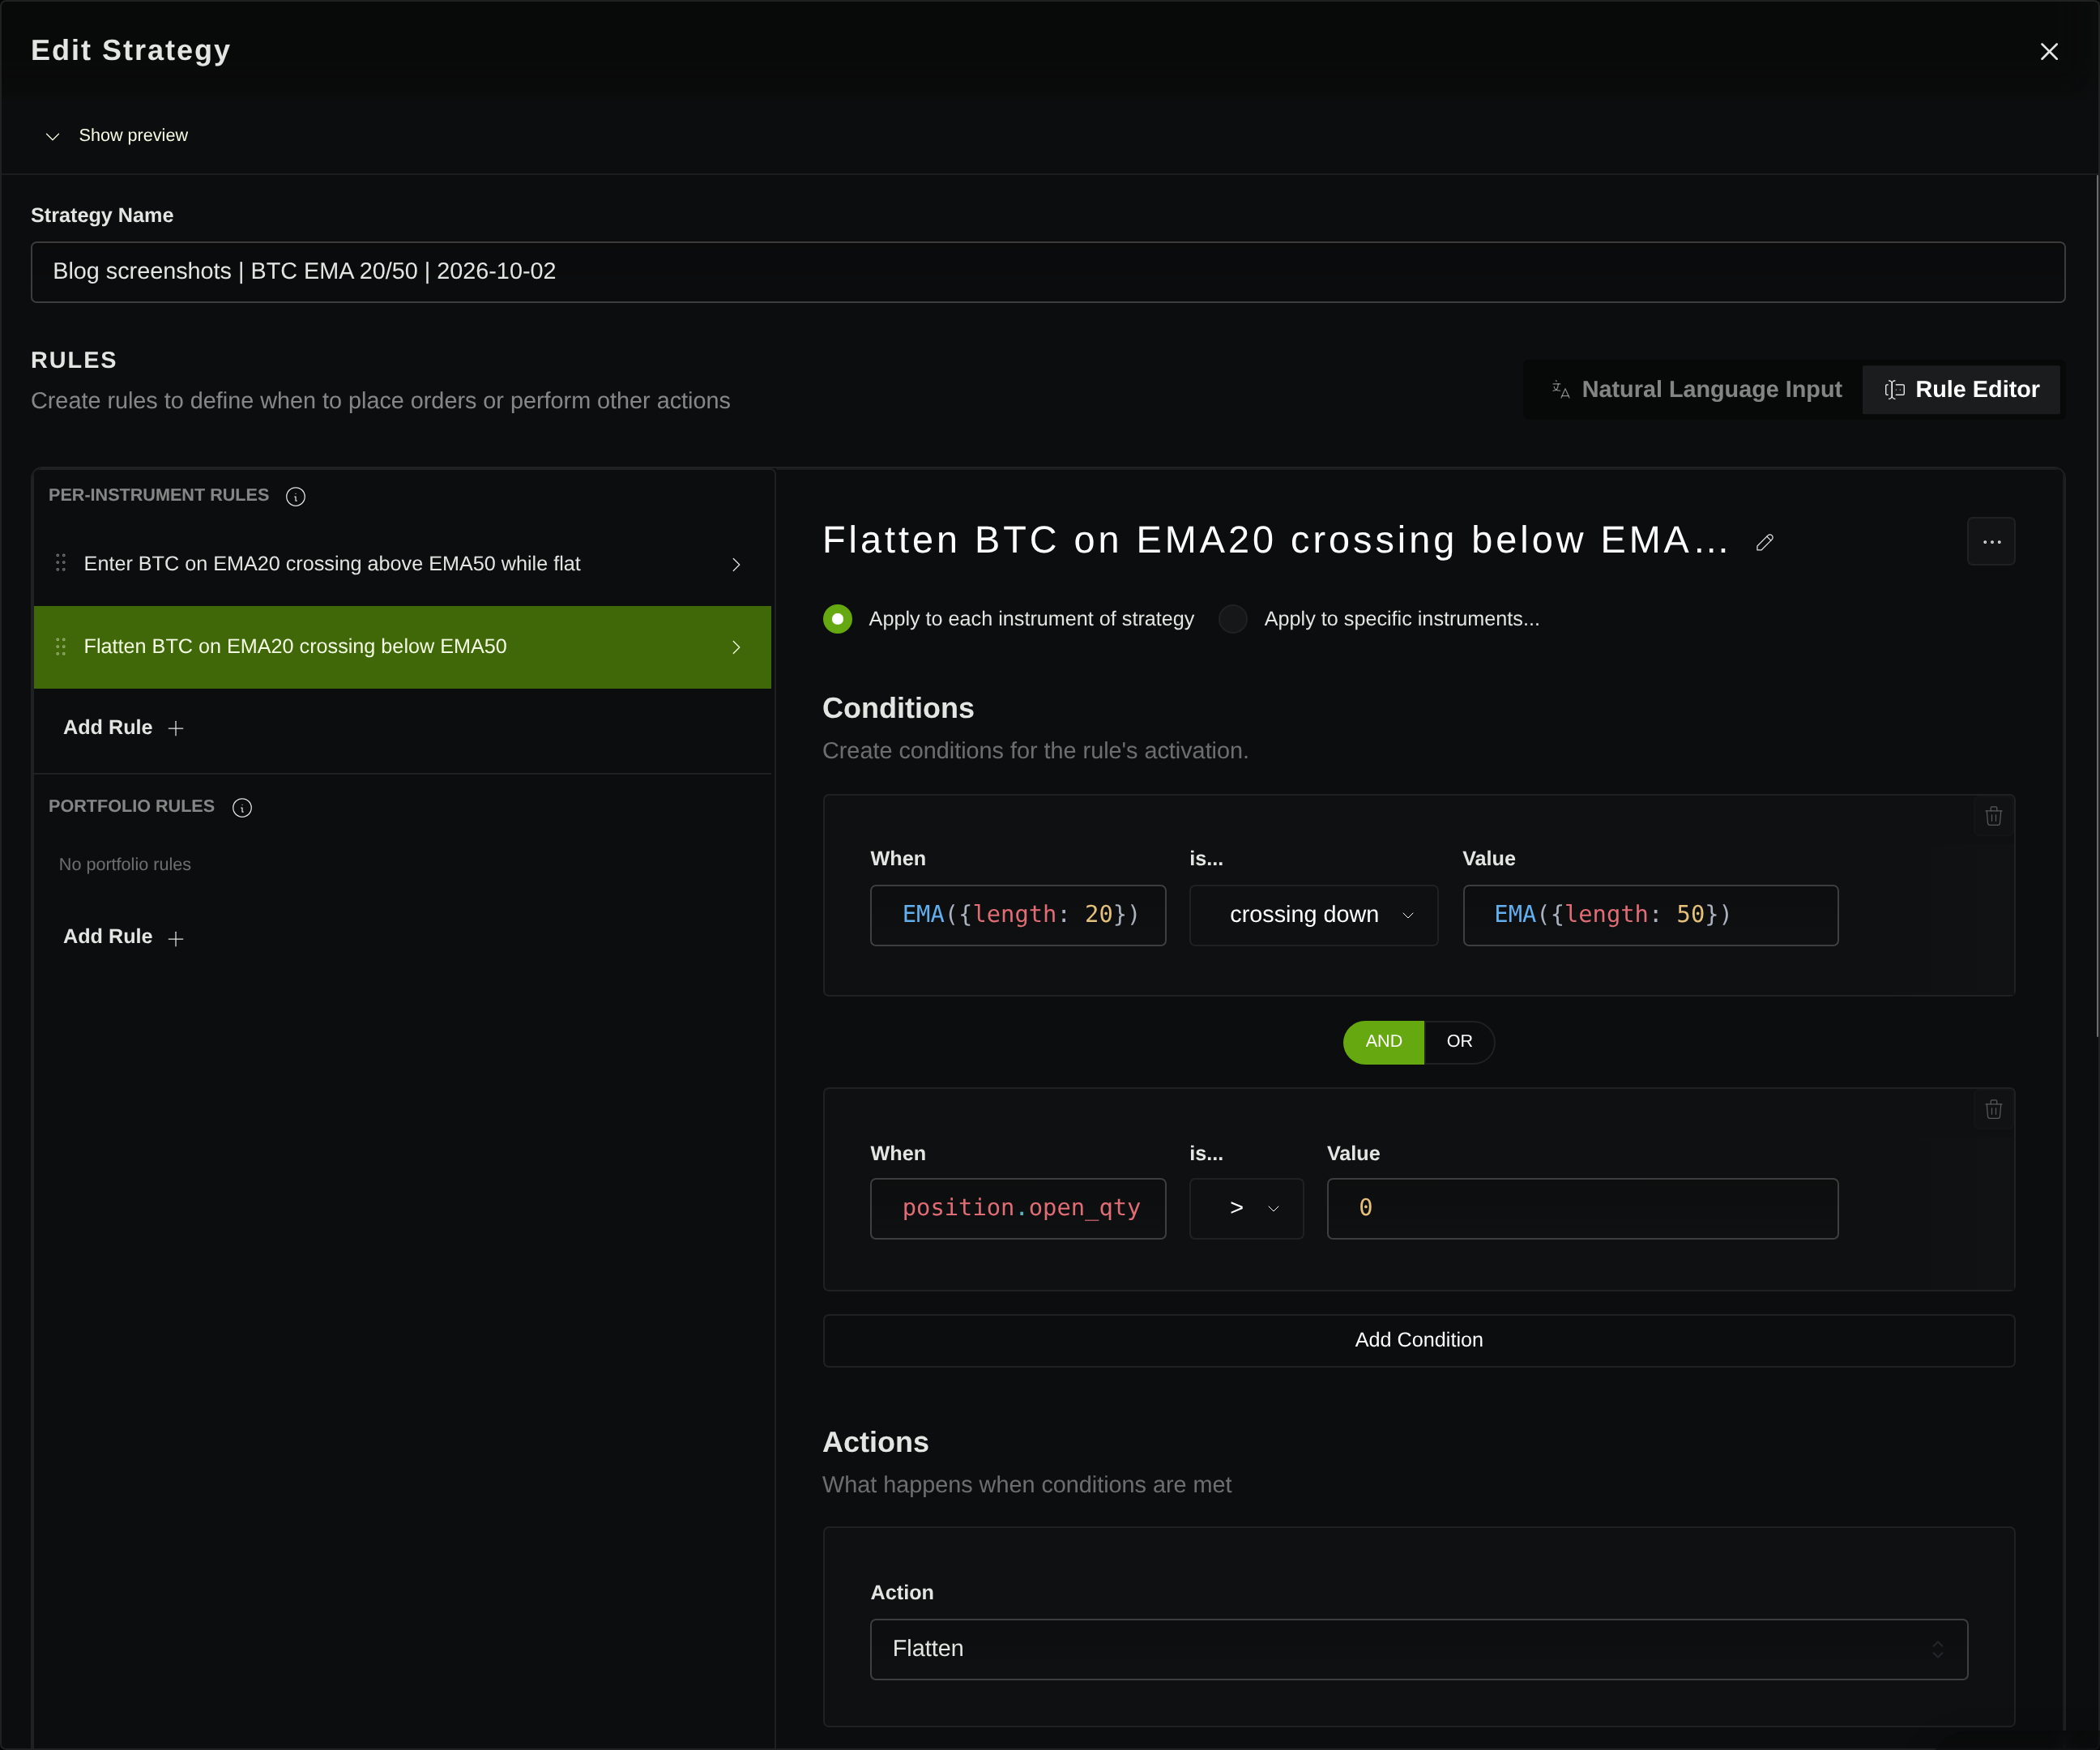
In the rule builder, keep entry and exit separate. Use the crossing-up and crossing-down operators, then add the position condition to each rule. Read the saved rules before starting the run; the strategy’s name alone does not establish what it will trade.
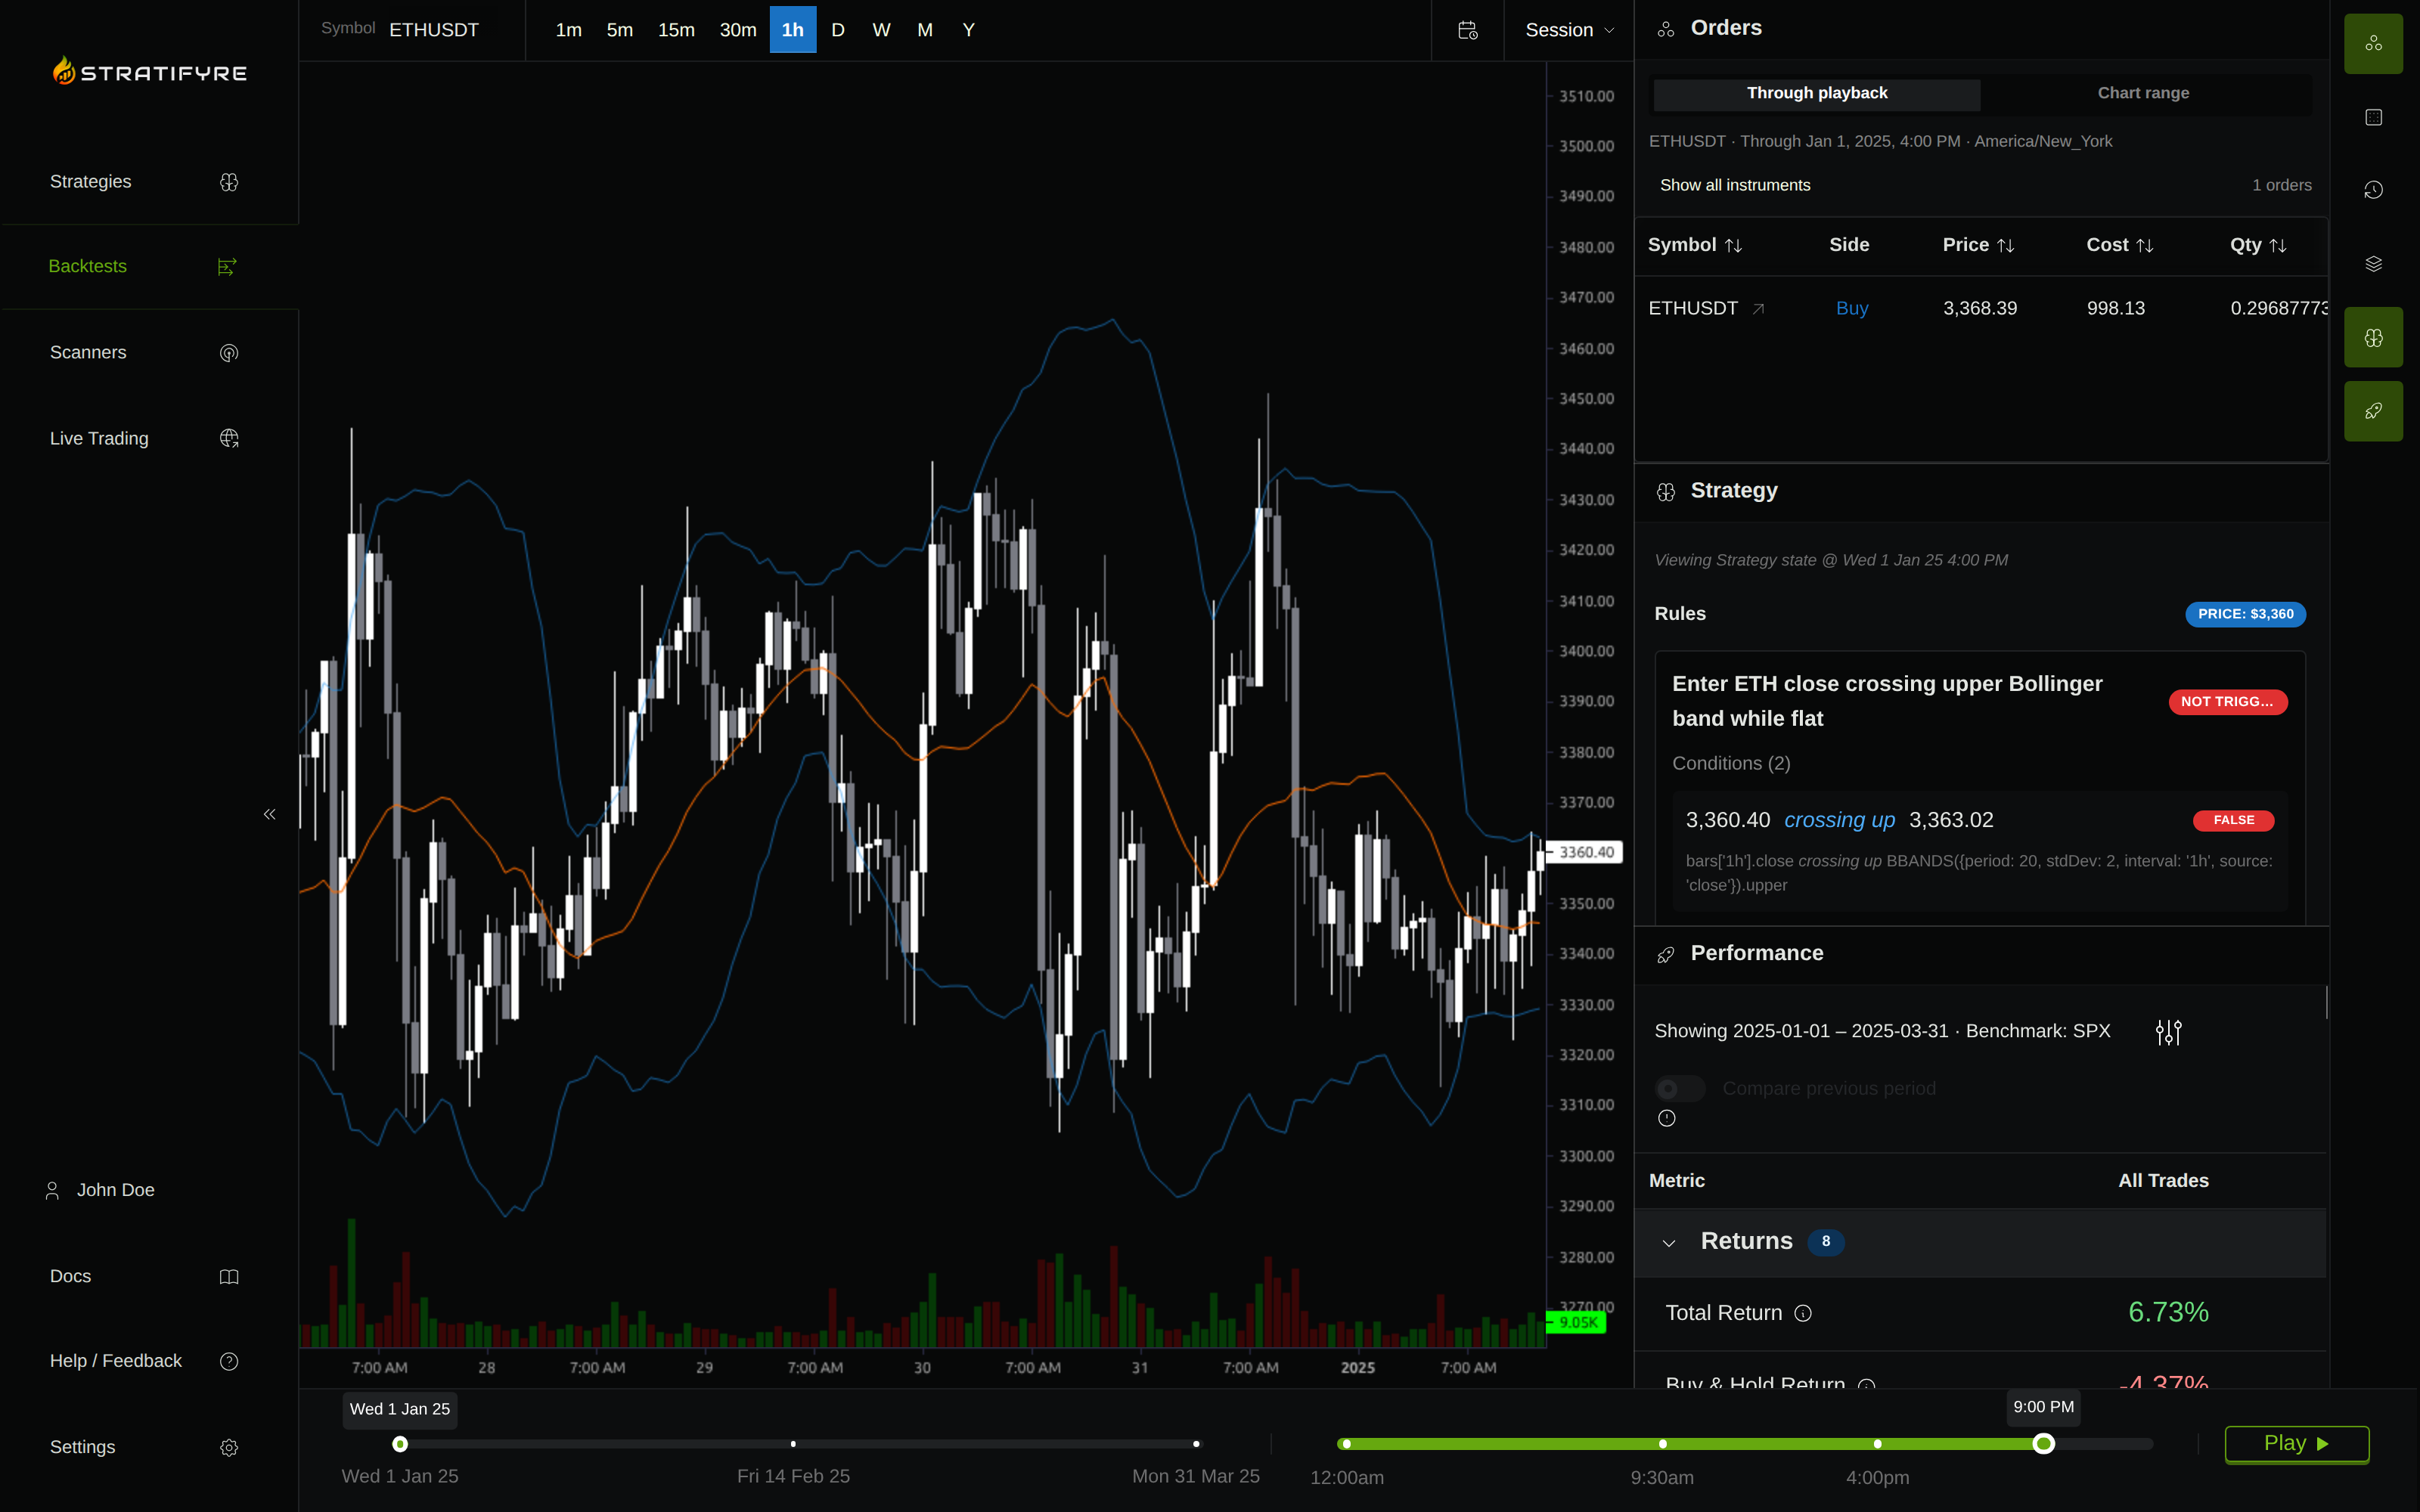
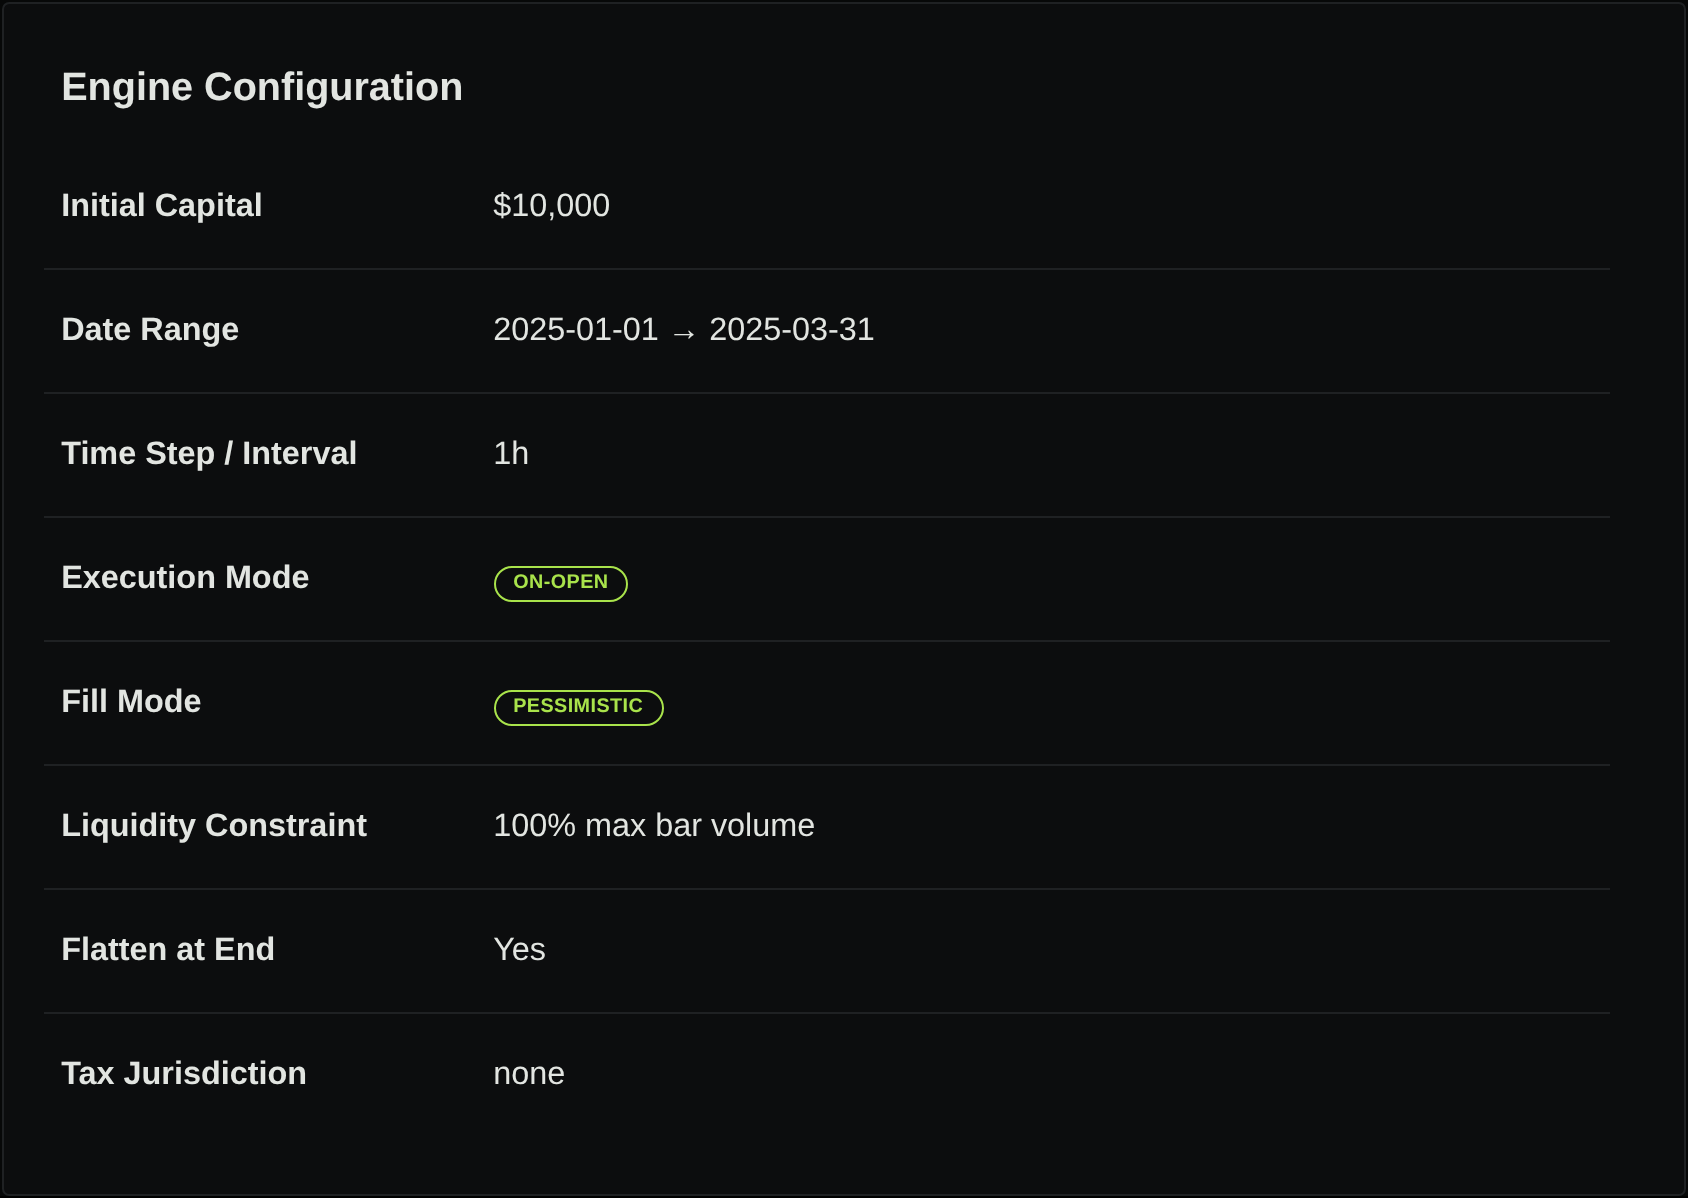
The product screenshots below come from a fresh run in our dedicated demo account with the same saved rules and execution settings. It reproduced the 24 trades and $9,324.21 ending account. Select an image to inspect the full-size capture.
Record the market and execution settings
“Bitcoin” does not identify a dataset. This run selected Binance BTC/USDT spot, rather than a Bitcoin perpetual contract or another exchange’s candles. Binance’s spot candle specification distinguishes opening time, closing time, and candle interval; UTC is the default candle timezone.
| Setting | Recorded input |
|---|---|
| Instrument | Binance BTC/USDT spot |
| Interval | One hour |
| Start date | January 1, 2025 |
| End date | March 31, 2025, inclusive |
| Starting account | $10,000 |
| Entry quantity | Fixed 0.05 BTC |
| Direction | Long only; no adding to an open position |
| Execution | On-open |
| End-of-run positions | Flatten at end |
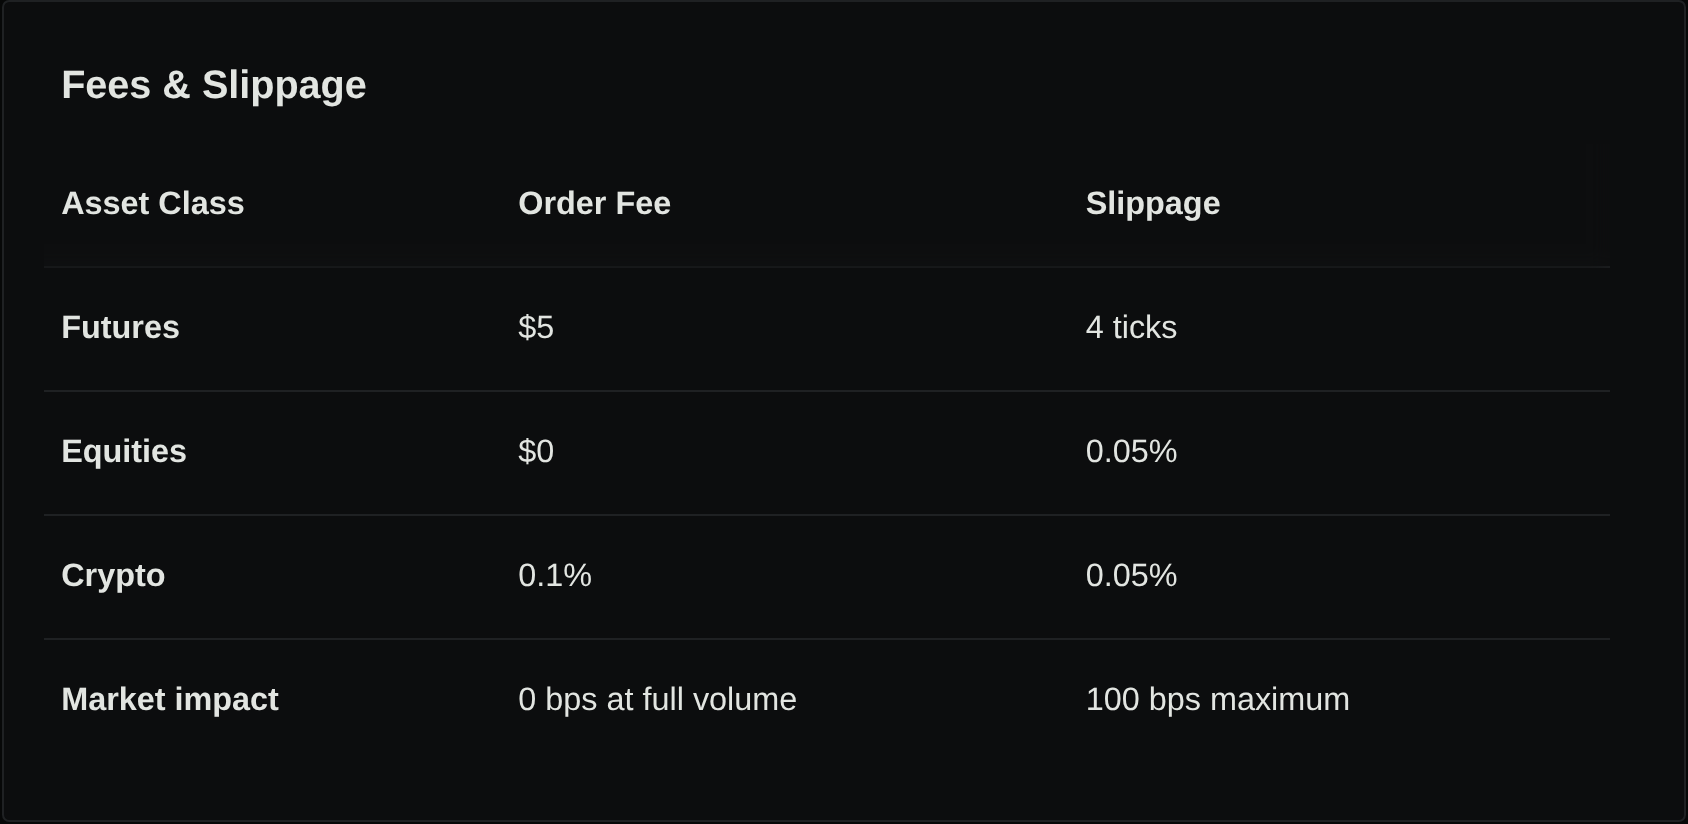
| Configured crypto slippage | 0.05% |
| Configured crypto commission | 0.10%; returned trade fees were zero |
| Taxes | None |
The fixed quantity matters. Buying 0.05 BTC does not invest the entire account, and the cash required changes with Bitcoin’s price. This result cannot be compared directly with a fully invested Bitcoin price chart.
Inspect the beginning of the run to establish that its indicators are ready before treating the first signal as comparable with later signals. Record the initialization behavior rather than assuming every backtesting engine starts its EMAs the same way.
What the recorded run returned
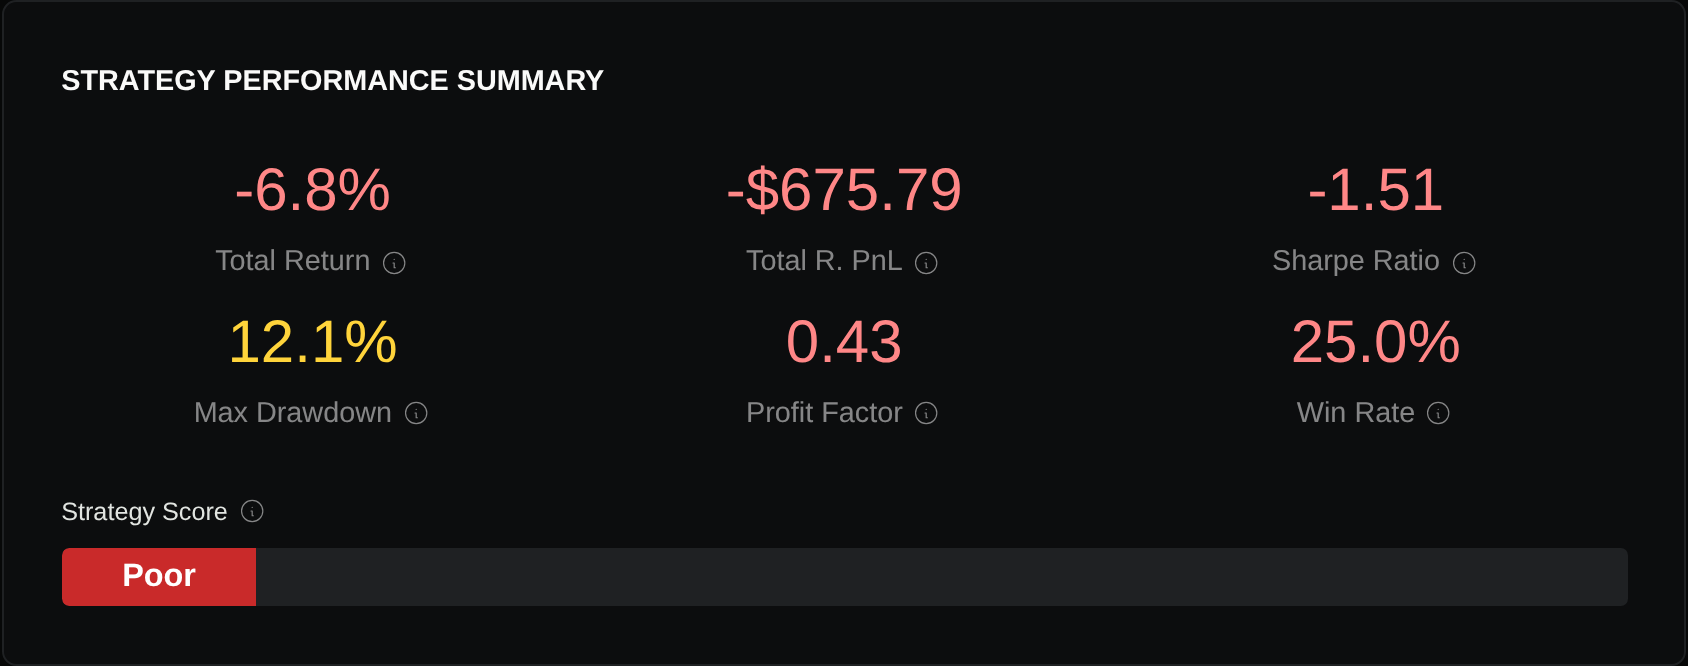
- Reported account return
- -6.76%
- Completed trades
- 24
- Reported maximum drawdown
- 12.14%
Six trades won and eighteen lost: a 25% win rate. The reported profit factor was 0.43, meaning the positive trade P&L was smaller than the absolute negative trade P&L. These measures describe this particular historical simulation; they do not establish how the strategy would behave in another period.
The completed trade P&Ls total approximately −$675.79, matching the change from $10,000 to $9,324.21. The run reports no remaining unrealized P&L after final flattening.
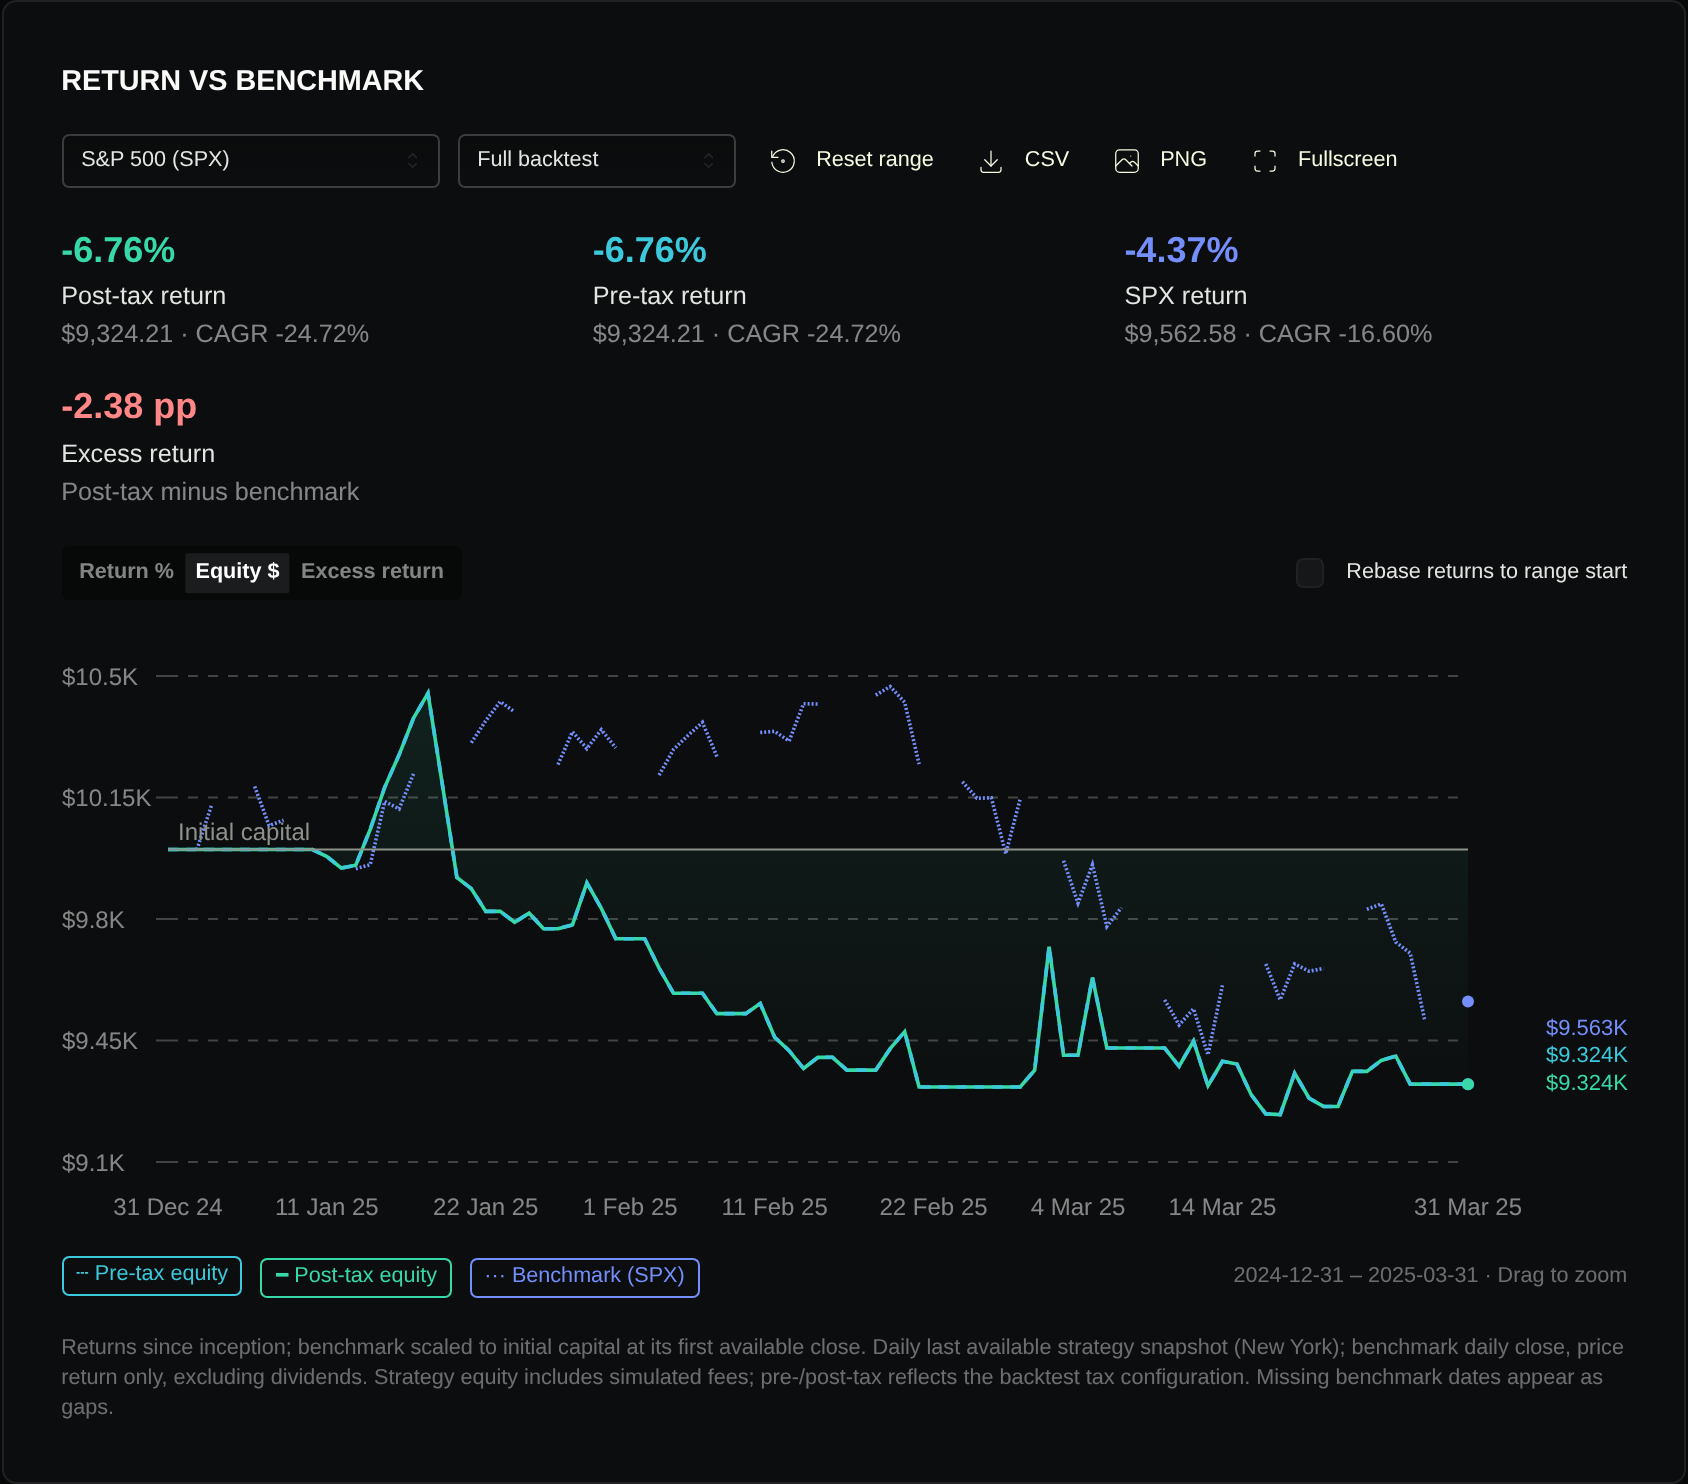
The account finished below its starting value
Recorded Binance BTC/USDT backtest · January–March 2025
View recorded equity data
| UTC time | Equity ($) |
|---|---|
| 2025-01-01 00:00 | 10000.00 |
| 2025-01-01 22:00 | 10000.00 |
| 2025-01-02 20:00 | 10000.00 |
| 2025-01-03 17:00 | 10000.00 |
| 2025-01-04 15:00 | 10000.00 |
| 2025-01-05 13:00 | 10000.00 |
| 2025-01-06 11:00 | 10000.00 |
| 2025-01-07 09:00 | 10000.00 |
| 2025-01-08 07:00 | 10000.00 |
| 2025-01-09 04:00 | 10000.00 |
| 2025-01-10 02:00 | 10000.00 |
| 2025-01-11 00:00 | 10000.00 |
| 2025-01-11 22:00 | 9980.28 |
| 2025-01-12 20:00 | 9955.89 |
| 2025-01-13 17:00 | 9944.31 |
| 2025-01-14 15:00 | 10022.45 |
| 2025-01-15 13:00 | 10147.07 |
| 2025-01-16 11:00 | 10156.80 |
| 2025-01-17 09:00 | 10291.93 |
| 2025-01-18 07:00 | 10339.95 |
| 2025-01-19 04:00 | 10450.47 |
| 2025-01-20 02:00 | 10186.10 |
| 2025-01-21 00:00 | 9919.74 |
| 2025-01-21 22:00 | 9908.22 |
| 2025-01-22 20:00 | 9824.47 |
| 2025-01-23 17:00 | 9821.87 |
| 2025-01-24 15:00 | 9851.13 |
| 2025-01-25 13:00 | 9793.98 |
| 2025-01-26 11:00 | 9799.06 |
| 2025-01-27 09:00 | 9772.03 |
| 2025-01-28 07:00 | 9772.03 |
| 2025-01-29 04:00 | 9783.05 |
| 2025-01-30 02:00 | 9863.29 |
| 2025-01-31 00:00 | 9875.05 |
| 2025-01-31 22:00 | 9743.19 |
| 2025-02-01 20:00 | 9743.19 |
| 2025-02-02 17:00 | 9743.19 |
| 2025-02-03 15:00 | 9743.19 |
| 2025-02-04 13:00 | 9606.22 |
| 2025-02-05 11:00 | 9586.00 |
| 2025-02-06 09:00 | 9586.00 |
| 2025-02-07 07:00 | 9586.00 |
| 2025-02-08 04:00 | 9527.29 |
| 2025-02-09 02:00 | 9527.29 |
| 2025-02-10 00:00 | 9527.29 |
| 2025-02-10 22:00 | 9522.88 |
| 2025-02-11 20:00 | 9459.22 |
| 2025-02-12 17:00 | 9459.22 |
| 2025-02-13 15:00 | 9369.24 |
| 2025-02-14 13:00 | 9364.44 |
| 2025-02-15 11:00 | 9405.88 |
| 2025-02-16 09:00 | 9393.39 |
| 2025-02-17 07:00 | 9364.80 |
| 2025-02-18 04:00 | 9364.80 |
| 2025-02-19 02:00 | 9364.80 |
| 2025-02-20 00:00 | 9407.91 |
| 2025-02-20 22:00 | 9471.96 |
| 2025-02-21 20:00 | 9318.53 |
| 2025-02-22 17:00 | 9316.15 |
| 2025-02-23 15:00 | 9316.15 |
| 2025-02-24 13:00 | 9316.15 |
| 2025-02-25 11:00 | 9316.15 |
| 2025-02-26 09:00 | 9316.15 |
| 2025-02-27 07:00 | 9316.15 |
| 2025-02-28 04:00 | 9316.15 |
| 2025-03-01 02:00 | 9316.15 |
| 2025-03-02 00:00 | 9378.35 |
| 2025-03-02 22:00 | 9789.39 |
| 2025-03-03 20:00 | 9380.72 |
| 2025-03-04 17:00 | 9407.40 |
| 2025-03-05 15:00 | 9434.42 |
| 2025-03-06 13:00 | 9495.67 |
| 2025-03-07 11:00 | 9428.20 |
| 2025-03-08 09:00 | 9428.20 |
| 2025-03-09 07:00 | 9428.20 |
| 2025-03-10 04:00 | 9428.20 |
| 2025-03-11 02:00 | 9428.20 |
| 2025-03-12 00:00 | 9407.72 |
| 2025-03-12 22:00 | 9452.00 |
| 2025-03-13 20:00 | 9319.65 |
| 2025-03-14 17:00 | 9383.73 |
| 2025-03-15 15:00 | 9382.77 |
| 2025-03-16 13:00 | 9295.27 |
| 2025-03-17 11:00 | 9293.21 |
| 2025-03-18 09:00 | 9236.53 |
| 2025-03-19 07:00 | 9236.53 |
| 2025-03-20 04:00 | 9345.31 |
| 2025-03-21 02:00 | 9295.34 |
| 2025-03-22 00:00 | 9260.09 |
| 2025-03-22 22:00 | 9260.09 |
| 2025-03-23 20:00 | 9290.01 |
| 2025-03-24 17:00 | 9457.97 |
| 2025-03-25 15:00 | 9423.60 |
| 2025-03-26 13:00 | 9376.94 |
| 2025-03-27 11:00 | 9368.91 |
| 2025-03-28 09:00 | 9324.21 |
| 2025-03-29 07:00 | 9324.21 |
| 2025-03-30 04:00 | 9324.21 |
| 2025-03-31 02:00 | 9324.21 |
| 2025-04-01 00:00 | 9324.21 |
Reconcile a losing trade
One returned losing trade bought 0.05 BTC at 94,988.220375 and sold at 94,276.688075, with a reported ten-hour duration.
Its price P&L is:
(94,276.688075 − 94,988.220375) × 0.05 = −35.576615, approximately −$35.58.
The returned trade record reports the same loss and a zero fee. Price subtraction explains the dollar loss; it does not by itself verify that the moving averages crossed at the intended time.

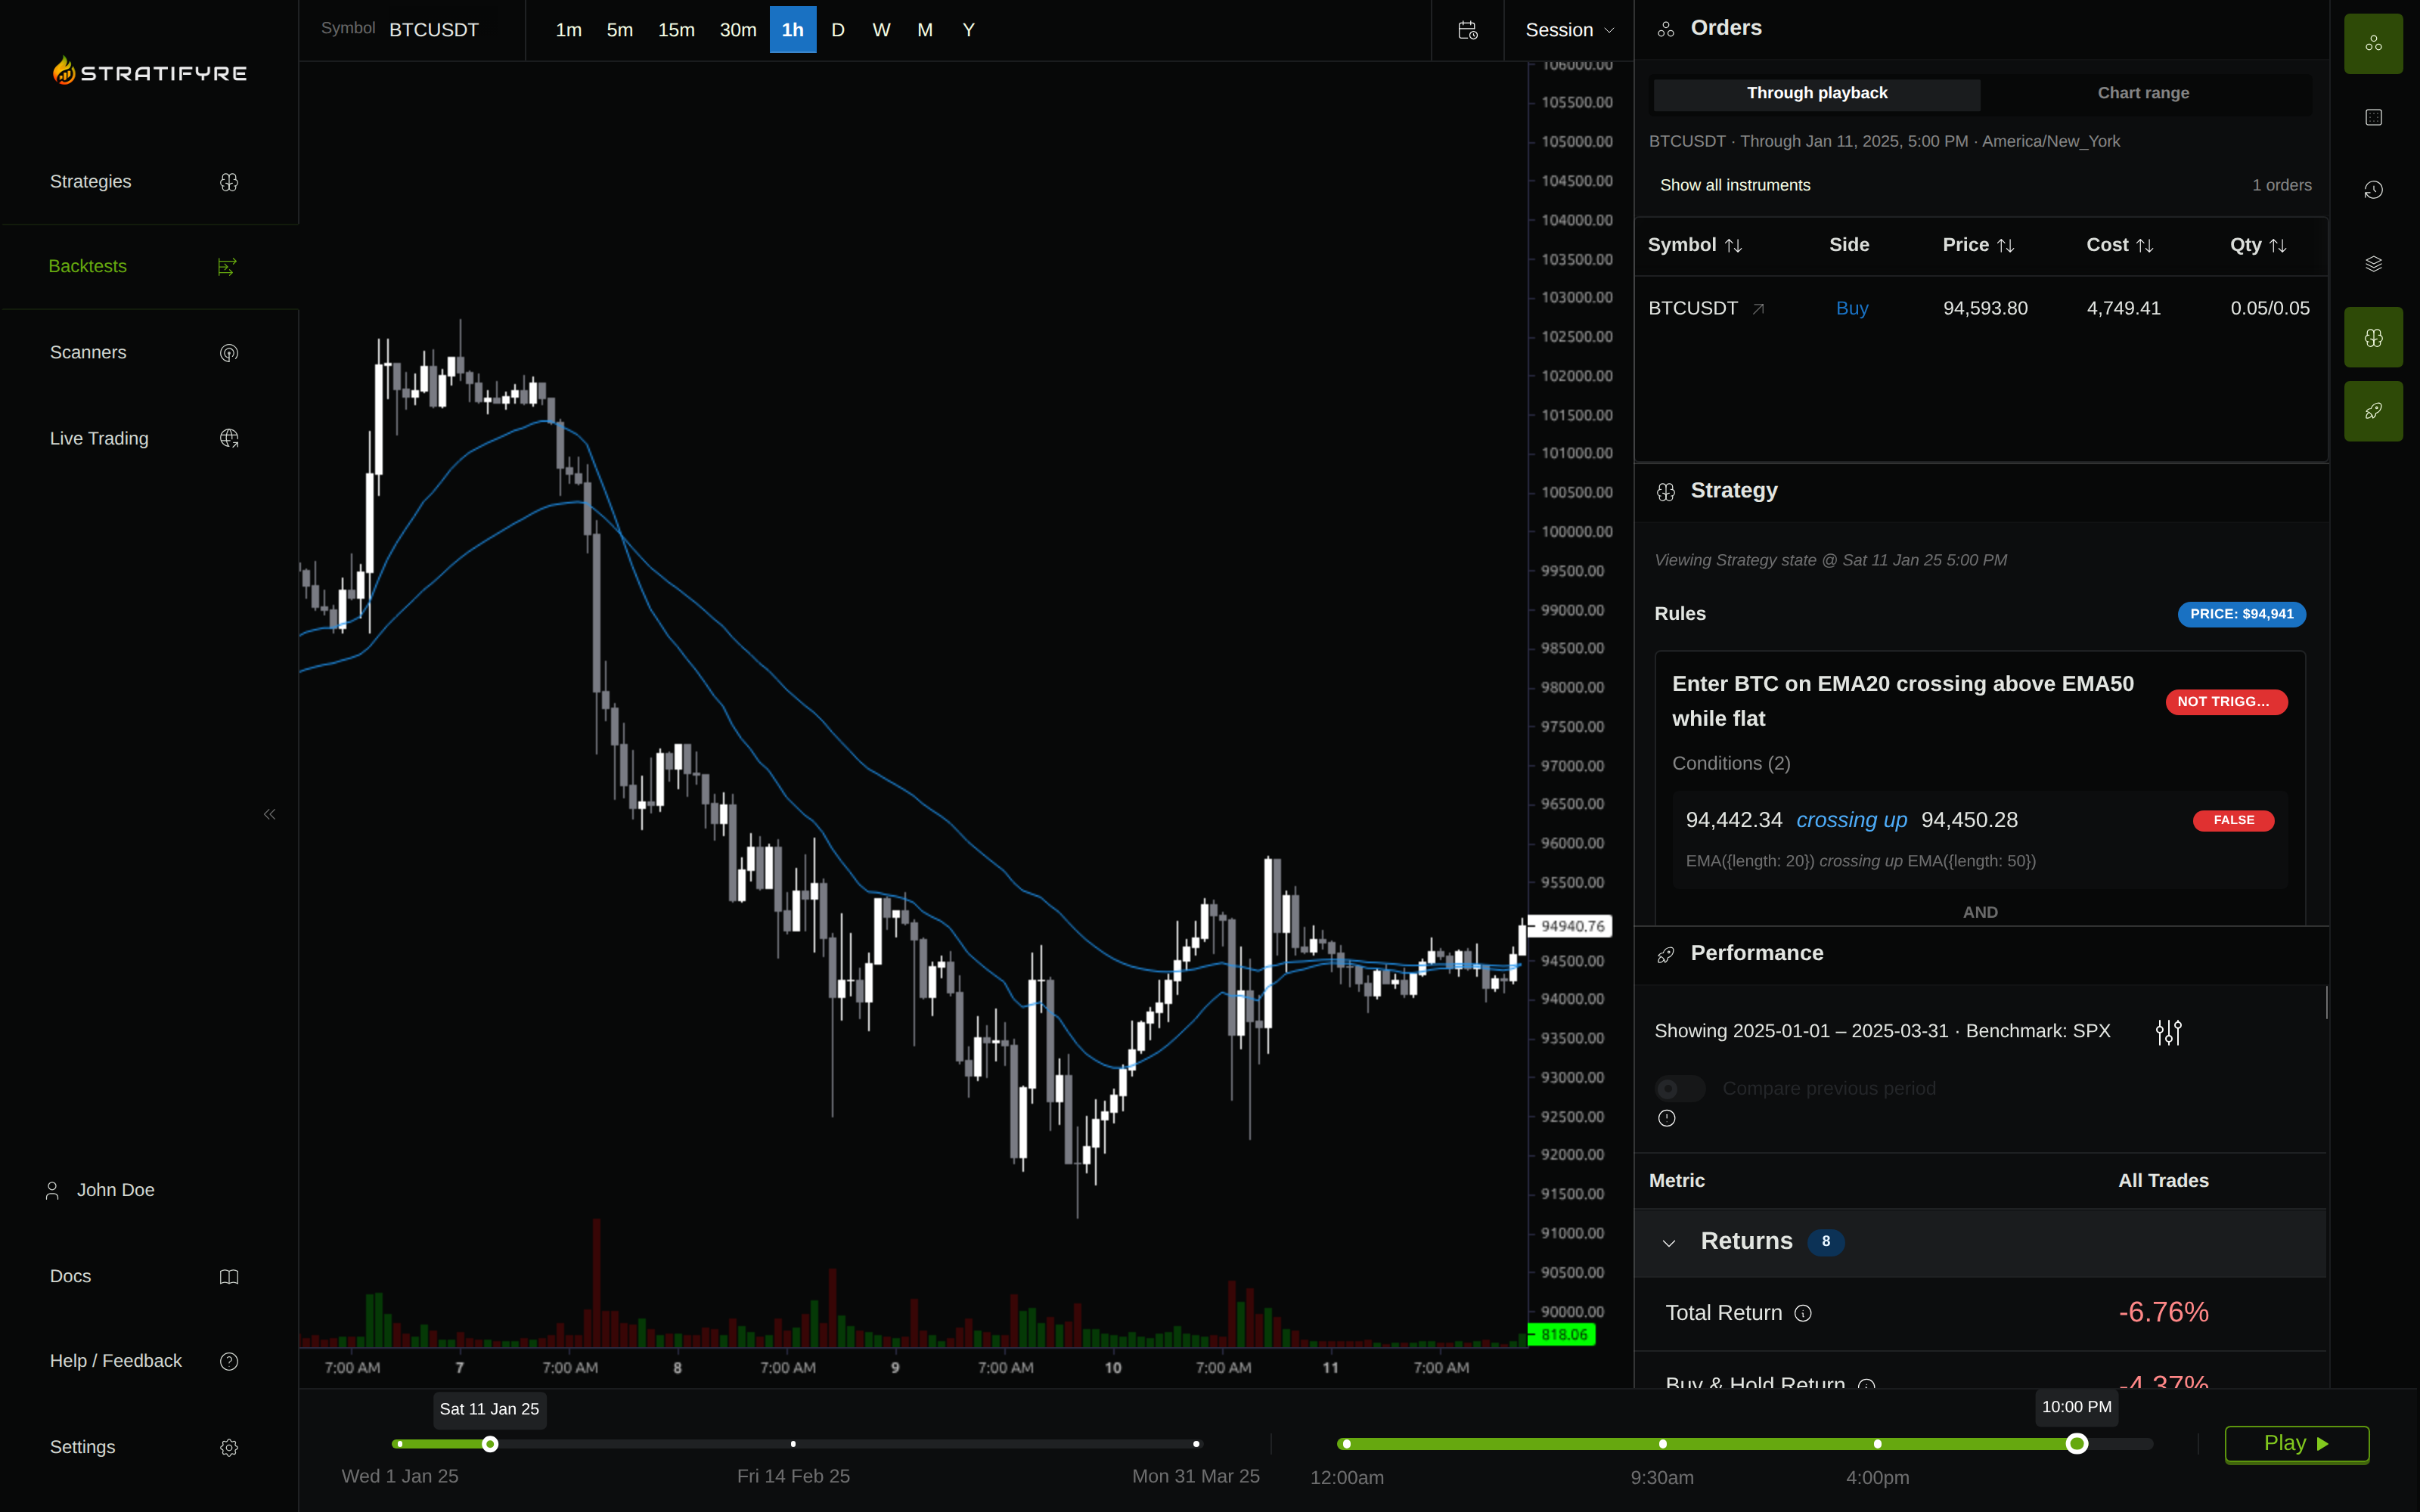
Open the trade on the product chart and check the signal bar, the two EMA values, and the subsequent fill. A correctly executed crossover can still lose when a move reverses quickly. An entry while the averages had already been above for several bars instead suggests that a state condition was used in place of a cross.
The largest reported winner was approximately $241.79, and the largest reported loser approximately −$266.36. Inspect both before deciding that a filter or a different period would improve the rules.
Check the charges before calling a result after-fee
This run reports zero commissions. Its saved settings contain a 0.10% crypto commission, but all 24 returned trades have a zero fee. A nonzero setting is insufficient evidence that a charge reached the account.
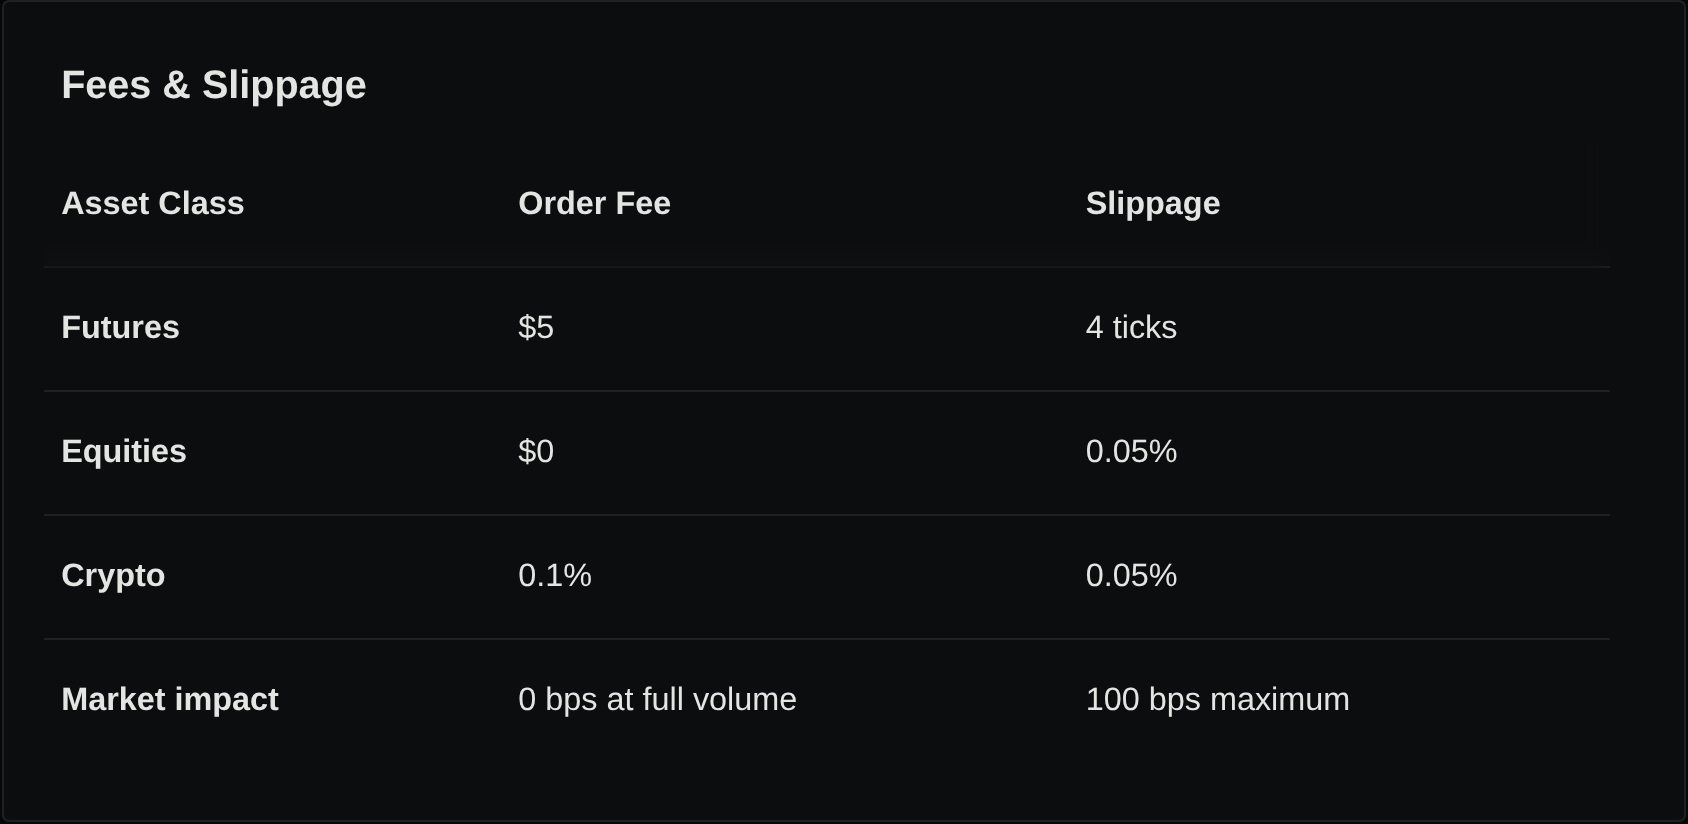
Treat the displayed figures as the platform’s reported result with zero returned commissions, rather than as a verified result after the requested exchange fee. Reconcile the actual charges and ending account before using this run for a break-even calculation or a fee-sensitivity comparison.
For another run, record the venue’s applicable maker/taker tariff and any assumed discount. Binance’s spot fee schedule distinguishes account tiers; the example input above is not a claim about your current trading fee.
Choose the next comparison before rerunning
This one run establishes that these saved rules produced trades and lost account value on this window. It does not establish whether the crossover improved on holding Bitcoin, whether nearby periods behave similarly, or whether it survives realistic trading costs.
For a meaningful benchmark, keep the same venue, dates, starting account, allocation, charges, and final-position treatment. Comparing a partially invested crossover account against Bitcoin’s raw price return confuses exposure with strategy behavior.
After reconciling costs, define a separate later window before looking at its results. Keep the rules fixed for that evaluation. Changing the periods after seeing every losing window turns those windows into development data.
Use Stratifyre’s backtesting workflow to start with two explicit rules, run one bounded test, and explain an actual losing trade before changing the strategy.
Put your strategy rules to the test
Build your strategy, inspect historical trades, and review the assumptions behind your results.
Build and test your strategy