Gold futures session backtests: compare hours without changing your setup
Define two gold-futures entry windows, control costs and overnight exposure, and check whether a session restriction survives later data.
A gold futures session backtest should answer a narrow question: does this setup behave differently when new entries are restricted to these hours? A profitable morning trade does not establish the best time to trade gold, and a session name is too vague to reproduce.
Start with two precisely timed windows and one unchanged strategy. The outright-contract recipe below remains a research design; actual Stratifyre screenshots now document four completed continuous-GC demonstrations over its development and later dates. Their cost and target-price discrepancies prevent a winning-session conclusion.
Start with a specific gold contract
Use the December 2025 COMEX Gold futures contract as an example research target. Before running it, confirm that your data source supplies that exact expiry, its identifier, and the required historical bars. A generic GC label does not establish which contract supplied each price.
Standard Gold futures, GC, represents 100 troy ounces. Its $0.10-per-ounce price increment makes one tick worth $10 per contract. Micro Gold, MGC, represents 10 ounces and has a $1 tick value; changing to MGC requires a separate data and cost check. CME’s gold contract reference specifies these terms.
GC’s ordinary Globex schedule opens Sunday at 17:00 Chicago time and ends Friday at 16:00, with a daily 16:00–17:00 break. Treat that as the normal schedule, then apply the product-specific holiday exceptions for each historical date. CME’s Gold overview gives the regular hours; its trading-hours calendar provides holiday schedules.
Do not import a schedule from another gold product. CME currently describes 1OZ as trading 24/7, subject to maintenance windows; that does not establish GC or MGC weekend availability. CME’s 1-Ounce Gold FAQ describes that separate product.
For a first experiment, a single dated contract avoids having a roll rule change the price series midway through the comparison. It also limits the period you can study. For a longer test, record the continuous-series construction, roll dates, adjustments, and treatment of positions across rolls before comparing sessions.
Write the clock policy before the entry rule
Choose these equal-length illustrative entry windows:
| Variant | Eligible entry time in Chicago |
|---|---|
| A: earlier window | 03:00 inclusive to 06:00 exclusive |
| B: later window | 07:00 inclusive to 10:00 exclusive |
These are research windows, not claims about liquidity or a universal “London” or “New York” session. Both use the named timezone America/Chicago. If your question instead concerns London-local hours, define Europe/London and convert each timestamp separately.
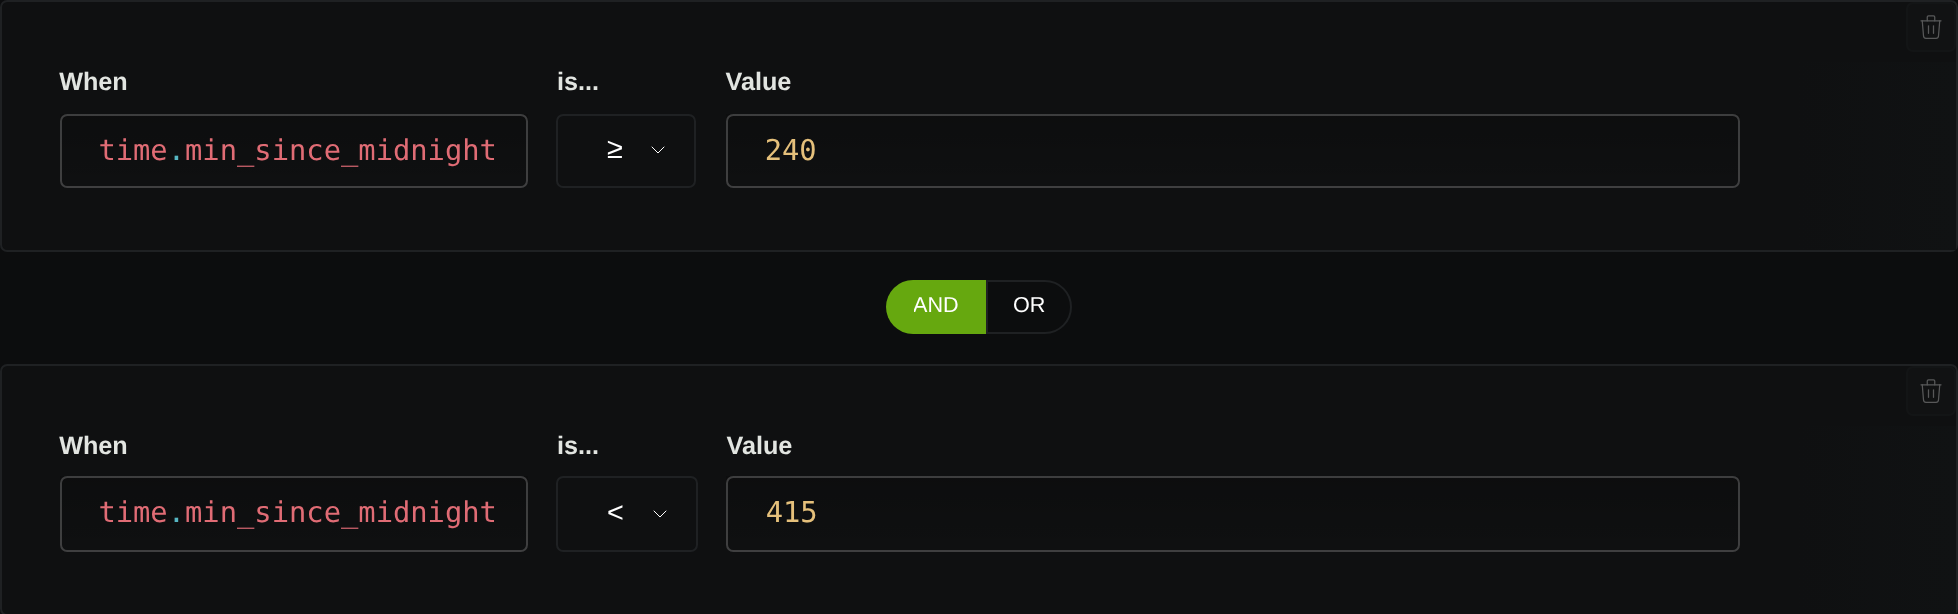
The captured runs use FUT:CME:GC.v.0, the available volume-continuous instrument, rather than a verified December outright contract. Their rule clock uses New York minutes since midnight: 240–415 for A and 480–655 for B, with the upper boundary exclusive. New York is one hour ahead of Chicago during the tested August–October 2025 dates; the five-minute earlier signal cutoff leaves room for a following entry bar. This conversion does not establish correct year-round DST, holiday, roll, or Globex handling.
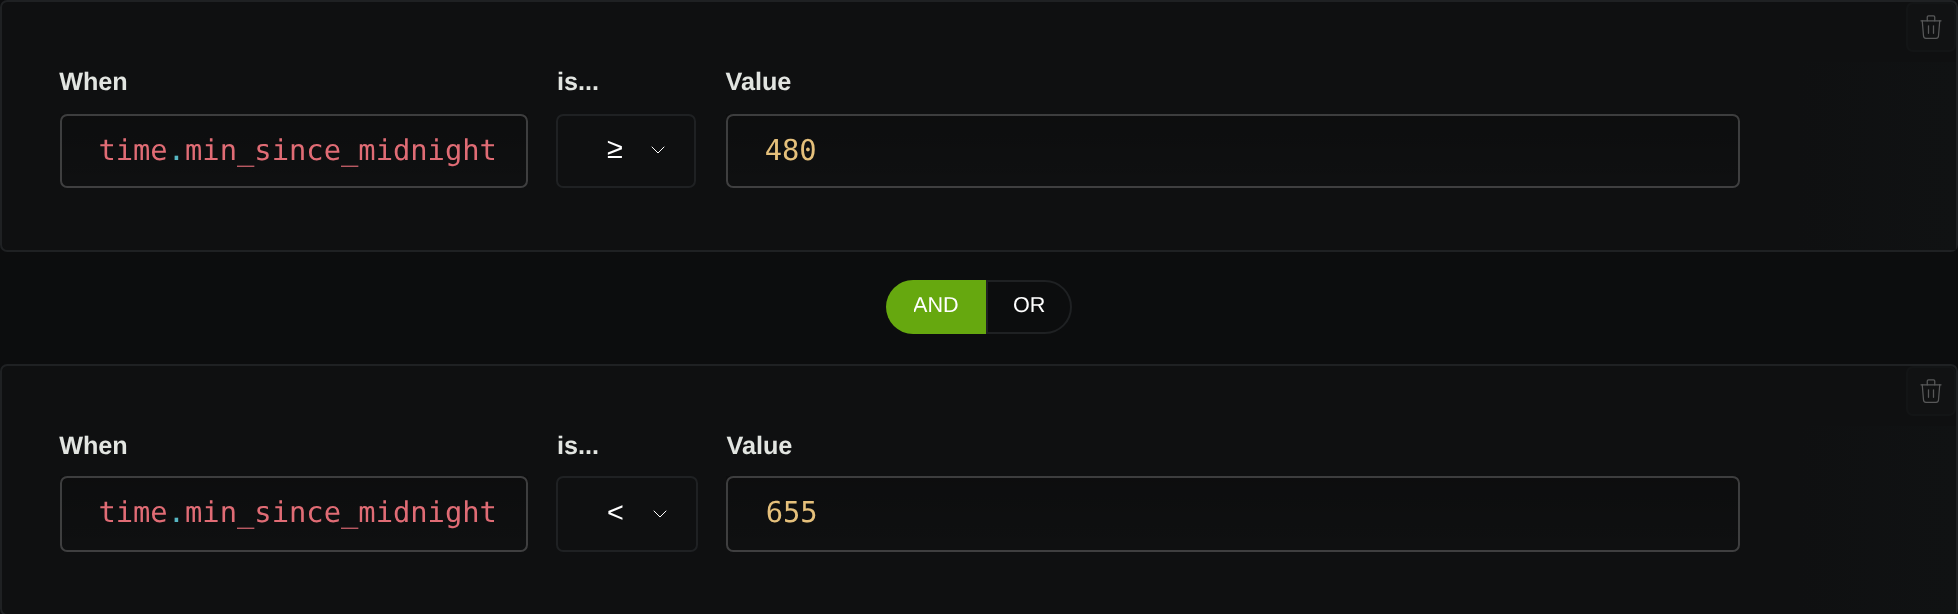
Chicago time follows daylight saving time. A 07:00 Chicago entry corresponds to 13:00 UTC in standard time and 12:00 UTC in daylight time. A fixed UTC filter therefore tests different local hours across the year. NIST’s daylight-saving reference explains the US transitions.
Check what your backtesting tool’s clock actually means. A field labeled “minutes since midnight” might use a different timezone, and an “RTH” flag might describe an equity schedule. Neither label proves that a gold contract’s Globex calendar is enforced. Confirm the clock, holidays, timestamp convention, and window boundaries against individual bars before trusting the comparison.
Keep UTC timestamps in the trade export, plus a Chicago-local display and the exchange trade date where available. A local calendar date and an overnight exchange session are different ways to group trades; choose one consistently for daily totals.
Freeze everything except entry eligibility
The following specification is deliberately simple. Its numbers define a teaching experiment, not an investment recommendation or verified executable configuration.
| Setting | Proposed value for both variants |
|---|---|
| Instrument | December 2025 GC; exact dataset must be confirmed |
| Signal bars | Completed five-minute bars |
| Entry signal | Close above the highest high of the preceding 20 bars; exclude the signal bar |
| Entry timing | Next available five-minute bar open, provided that entry time is inside the window |
| Position | One long contract; one position at a time; no pending duplicate entry |
| Initial capital | $50,000, with margin feasibility checked separately |
| Protective exits | Fixed 20-tick stop and 40-tick target from the filled entry |
| Maximum holding time | 60 minutes from entry; common 15:00 Chicago flattening cutoff |
| Warmup | At least 100 preceding complete bars; identical full-session history |
| Development period | August 4–September 12, 2025 |
| Later validation period | September 15–October 31, 2025 |
The signal history should continue outside the entry windows. Rebuilding the 20-bar lookback only from eligible bars would change the setup along with the clock restriction.

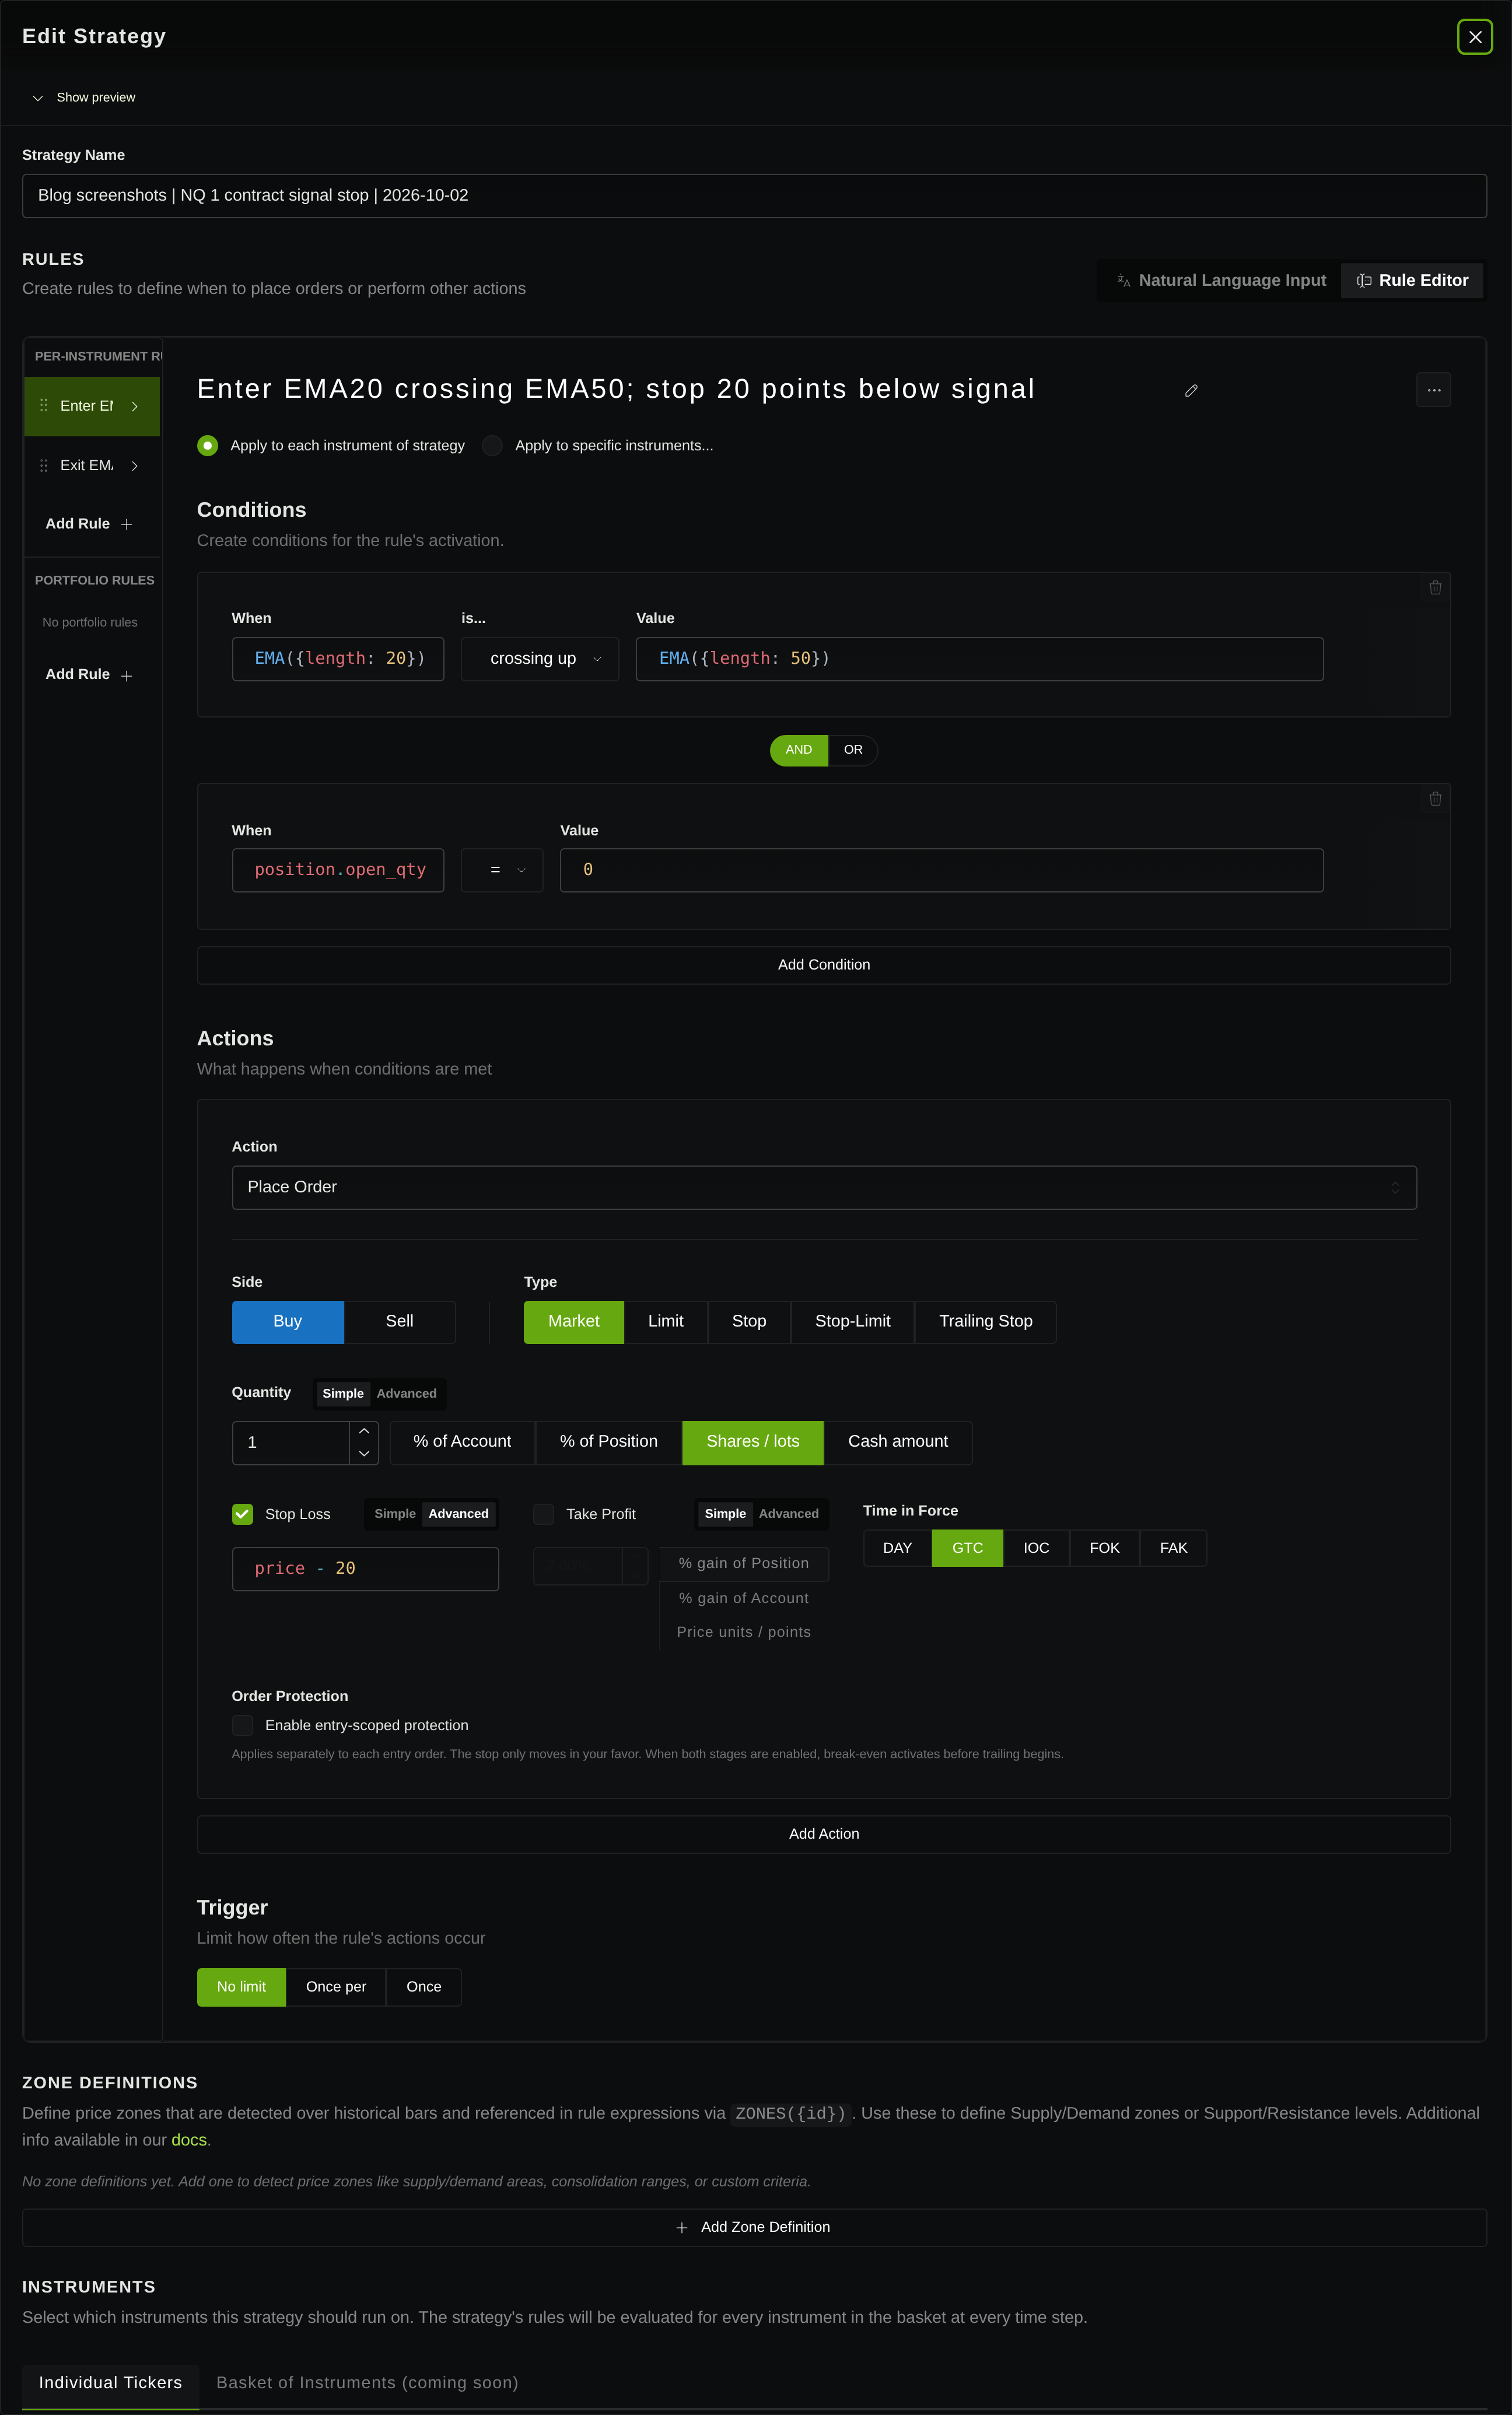
bar.close > highest(bars['5m'].high,20)[1] to exclude the current bar from the high window. Both variants retain the same signal, flat-position and no-pending-buy conditions.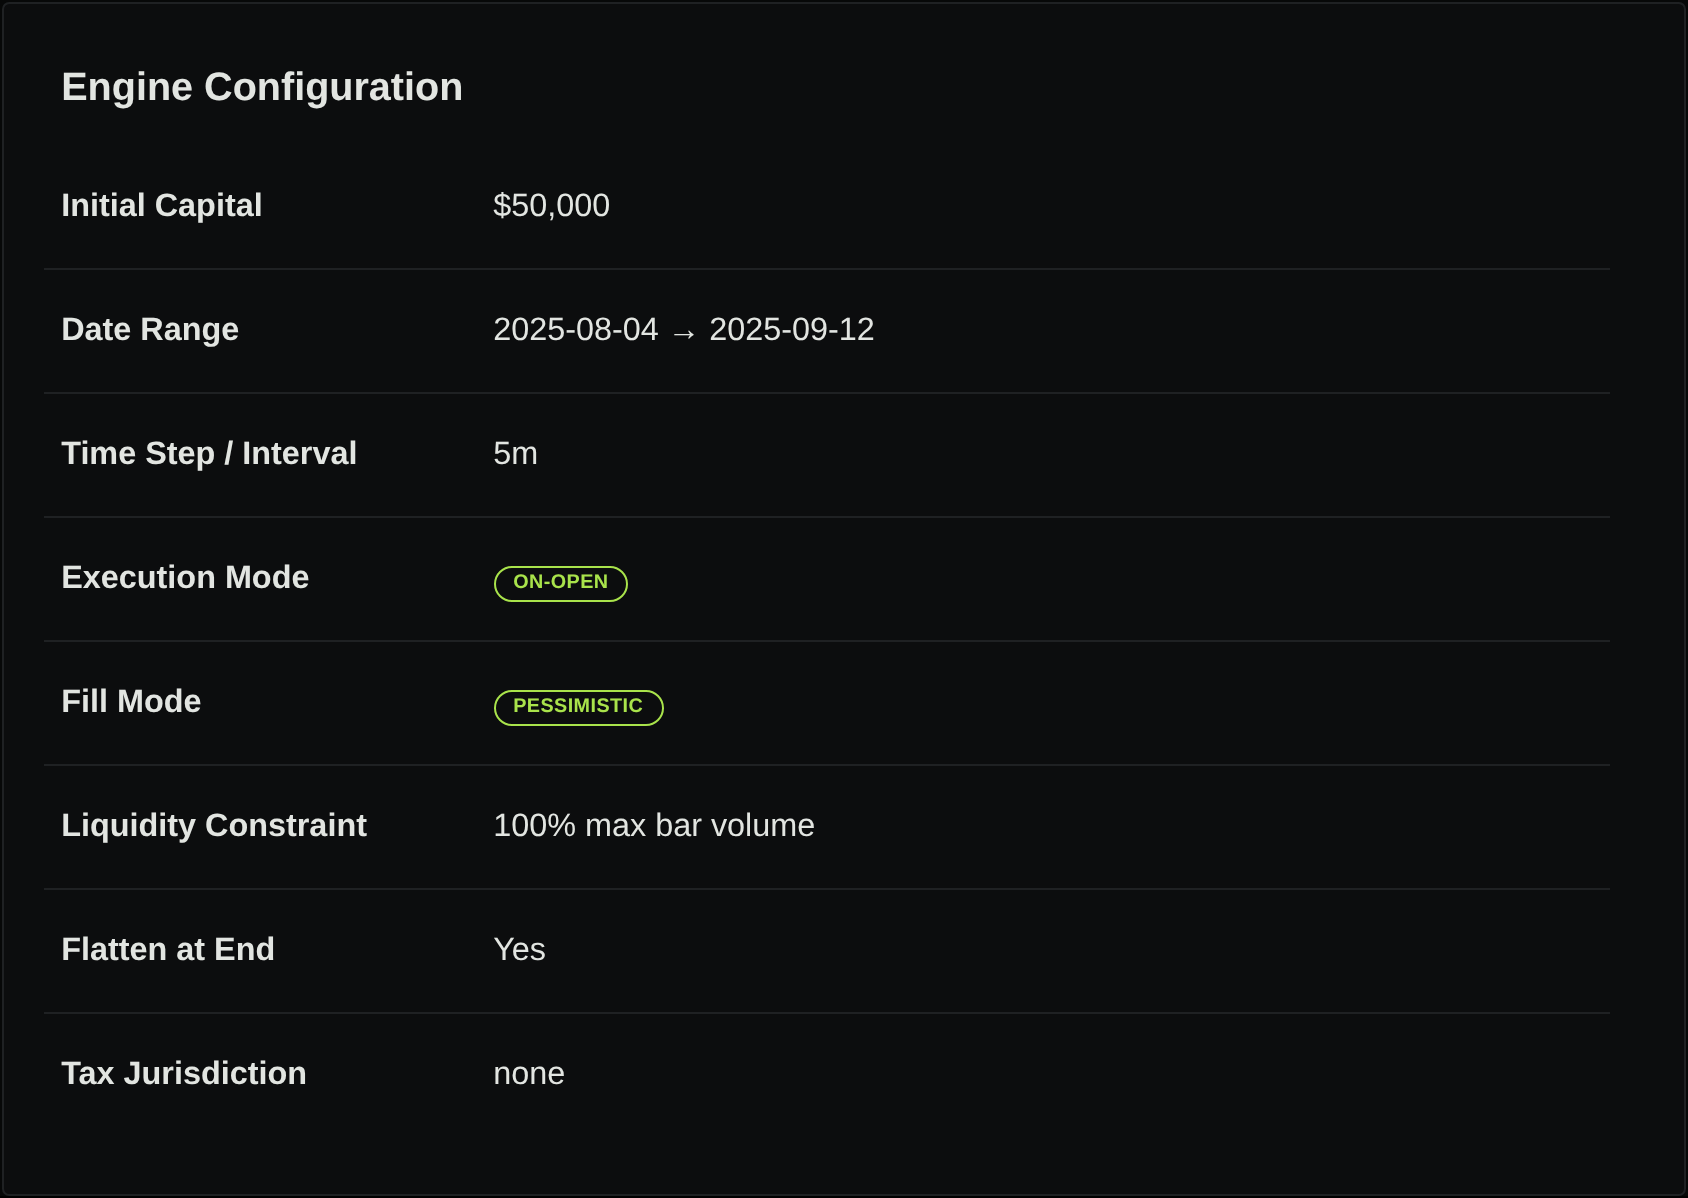
Verify that the execution model can implement the proposed timing. A bar’s timestamp might mark its opening time; a completed-bar decision happens later. A signal near the window’s end cannot justify an entry after the cutoff. Cancel any unfilled entry order when its eligibility ends, and keep protective exits active after entry hours finish.
The common holding-time and flattening rules make exposure comparable. If one variant instead closes at its window’s end, you are changing both entry hours and exit timing. Record that as a separate experiment.
The demonstration preserves a first-fill stop two price points below entry, but its four-point target is resolved at submission and its 60-minute timer starts at submission. Those anchors differ from the fully fill-anchored recipe above. The common flattening condition uses New York minute 960, corresponding to Chicago 15:00 during this sample; neither variant flattens at its entry-window end.
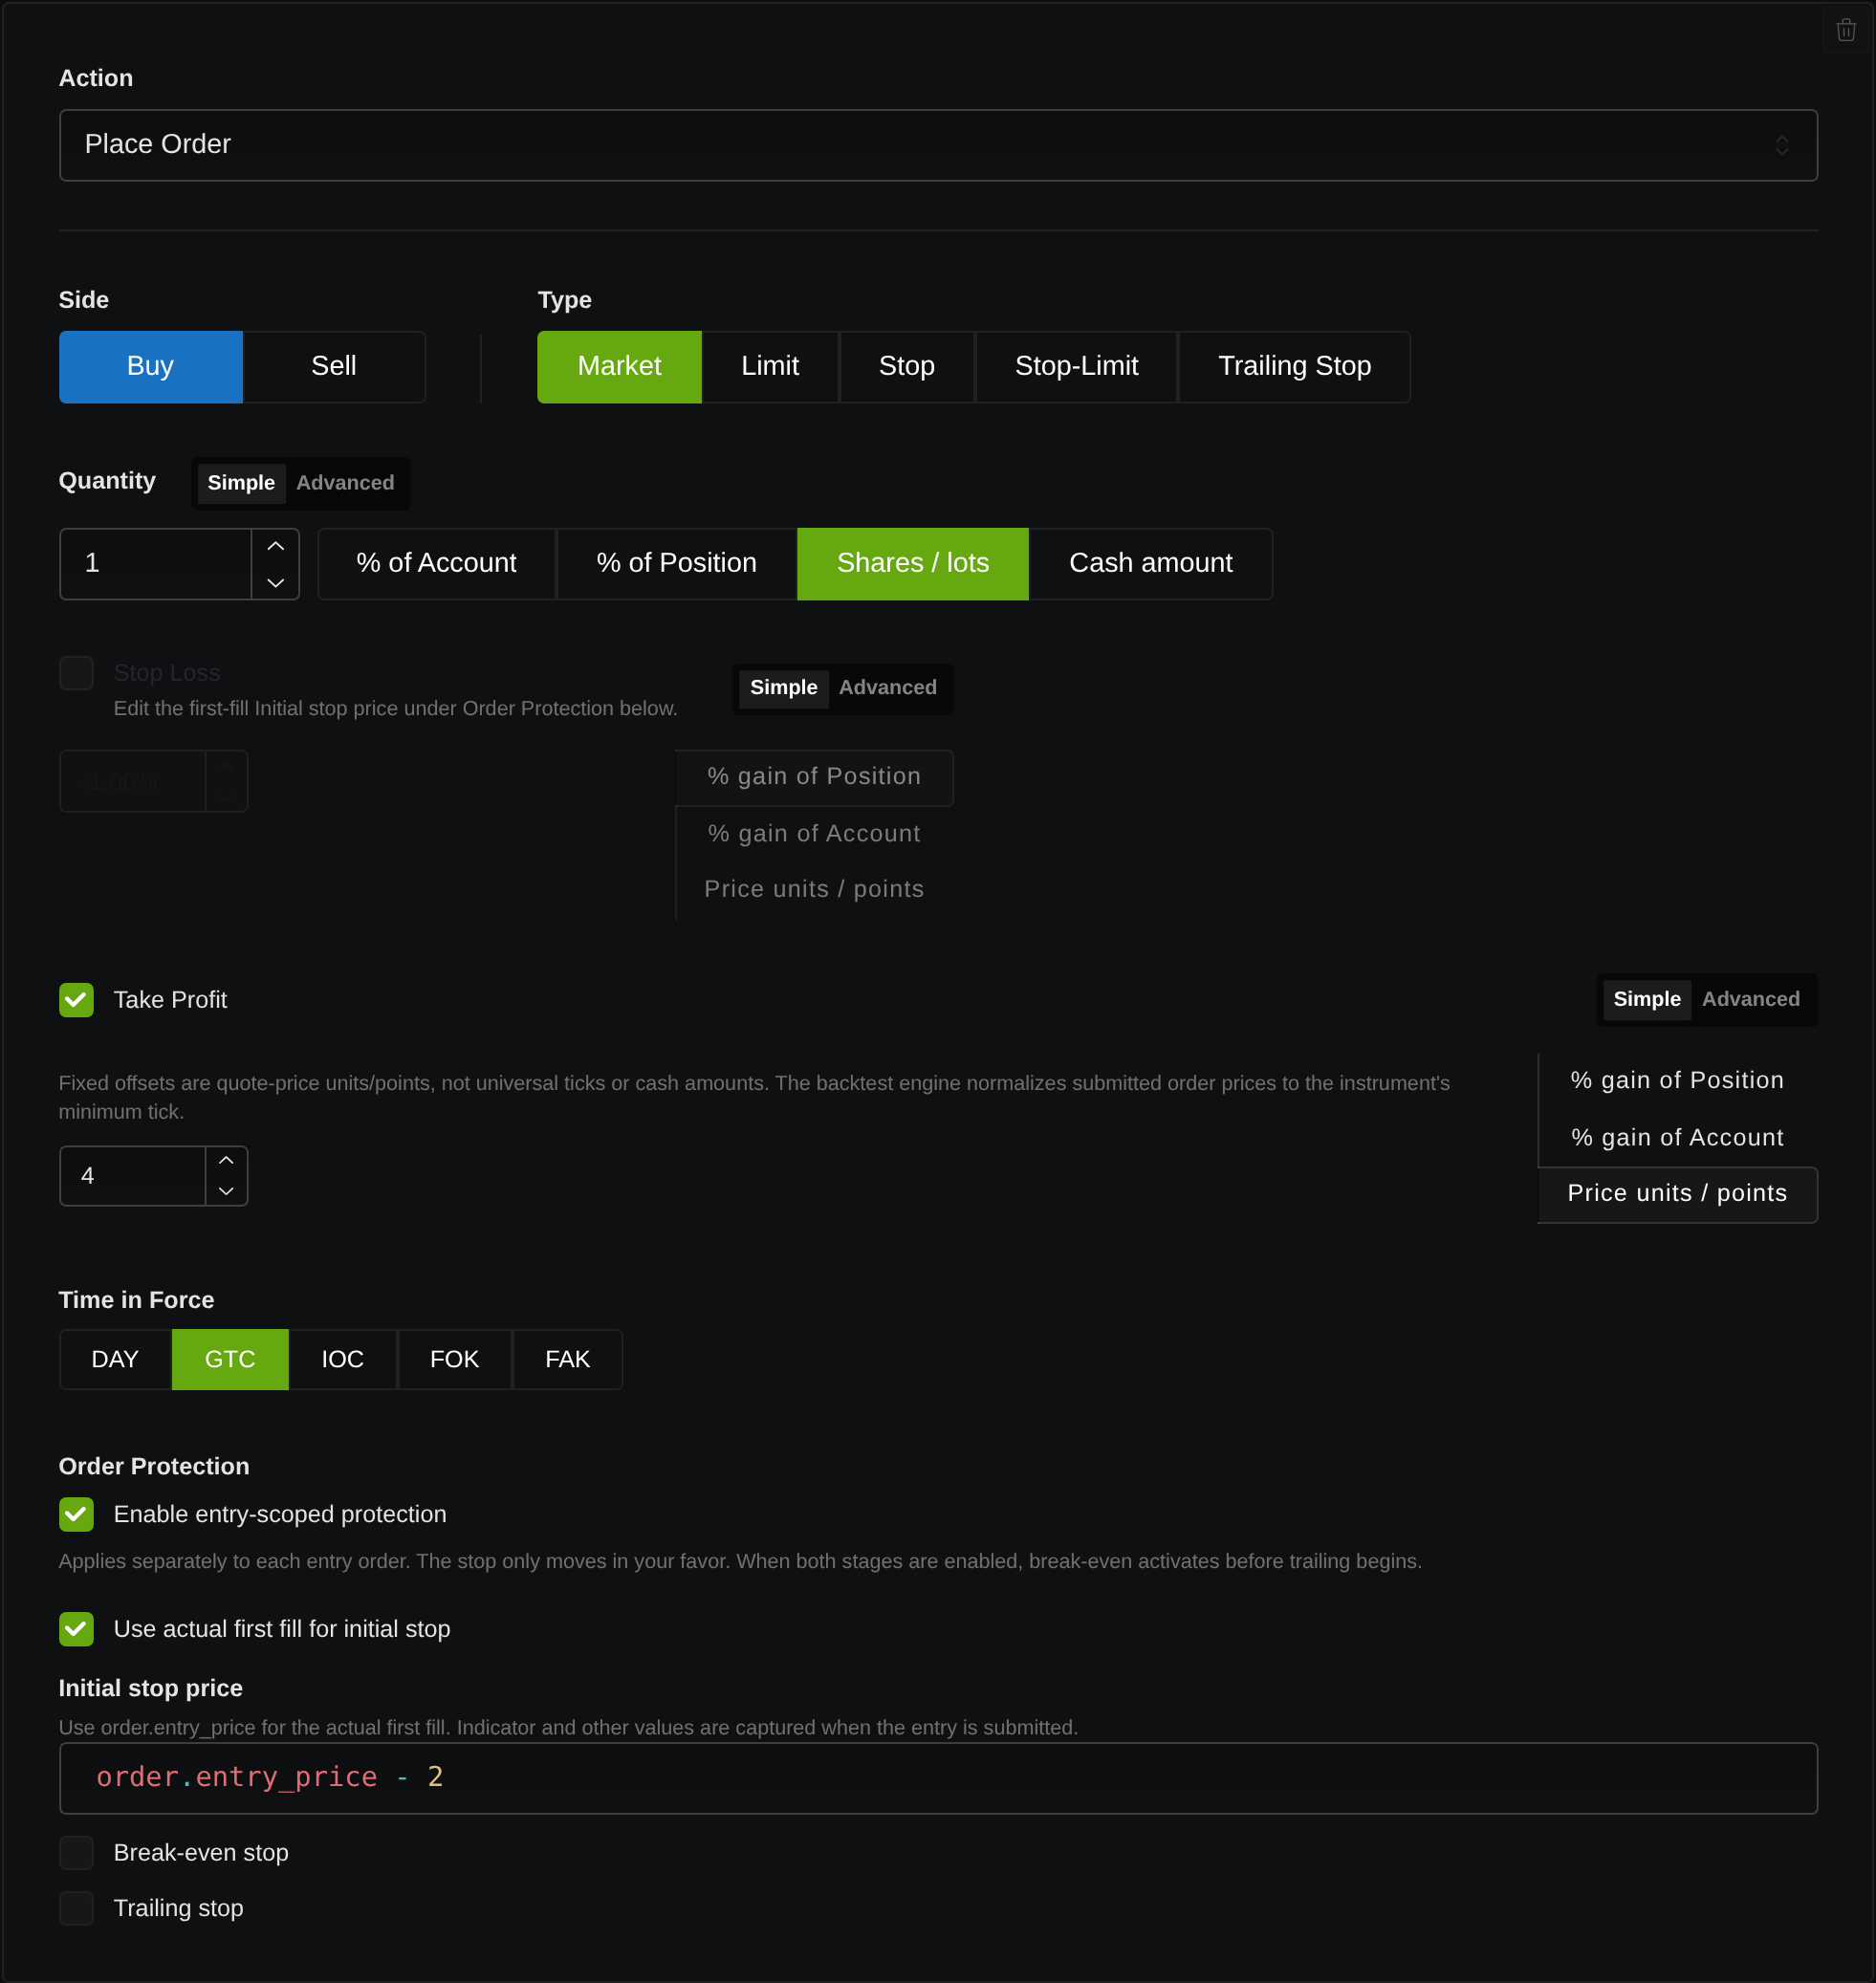
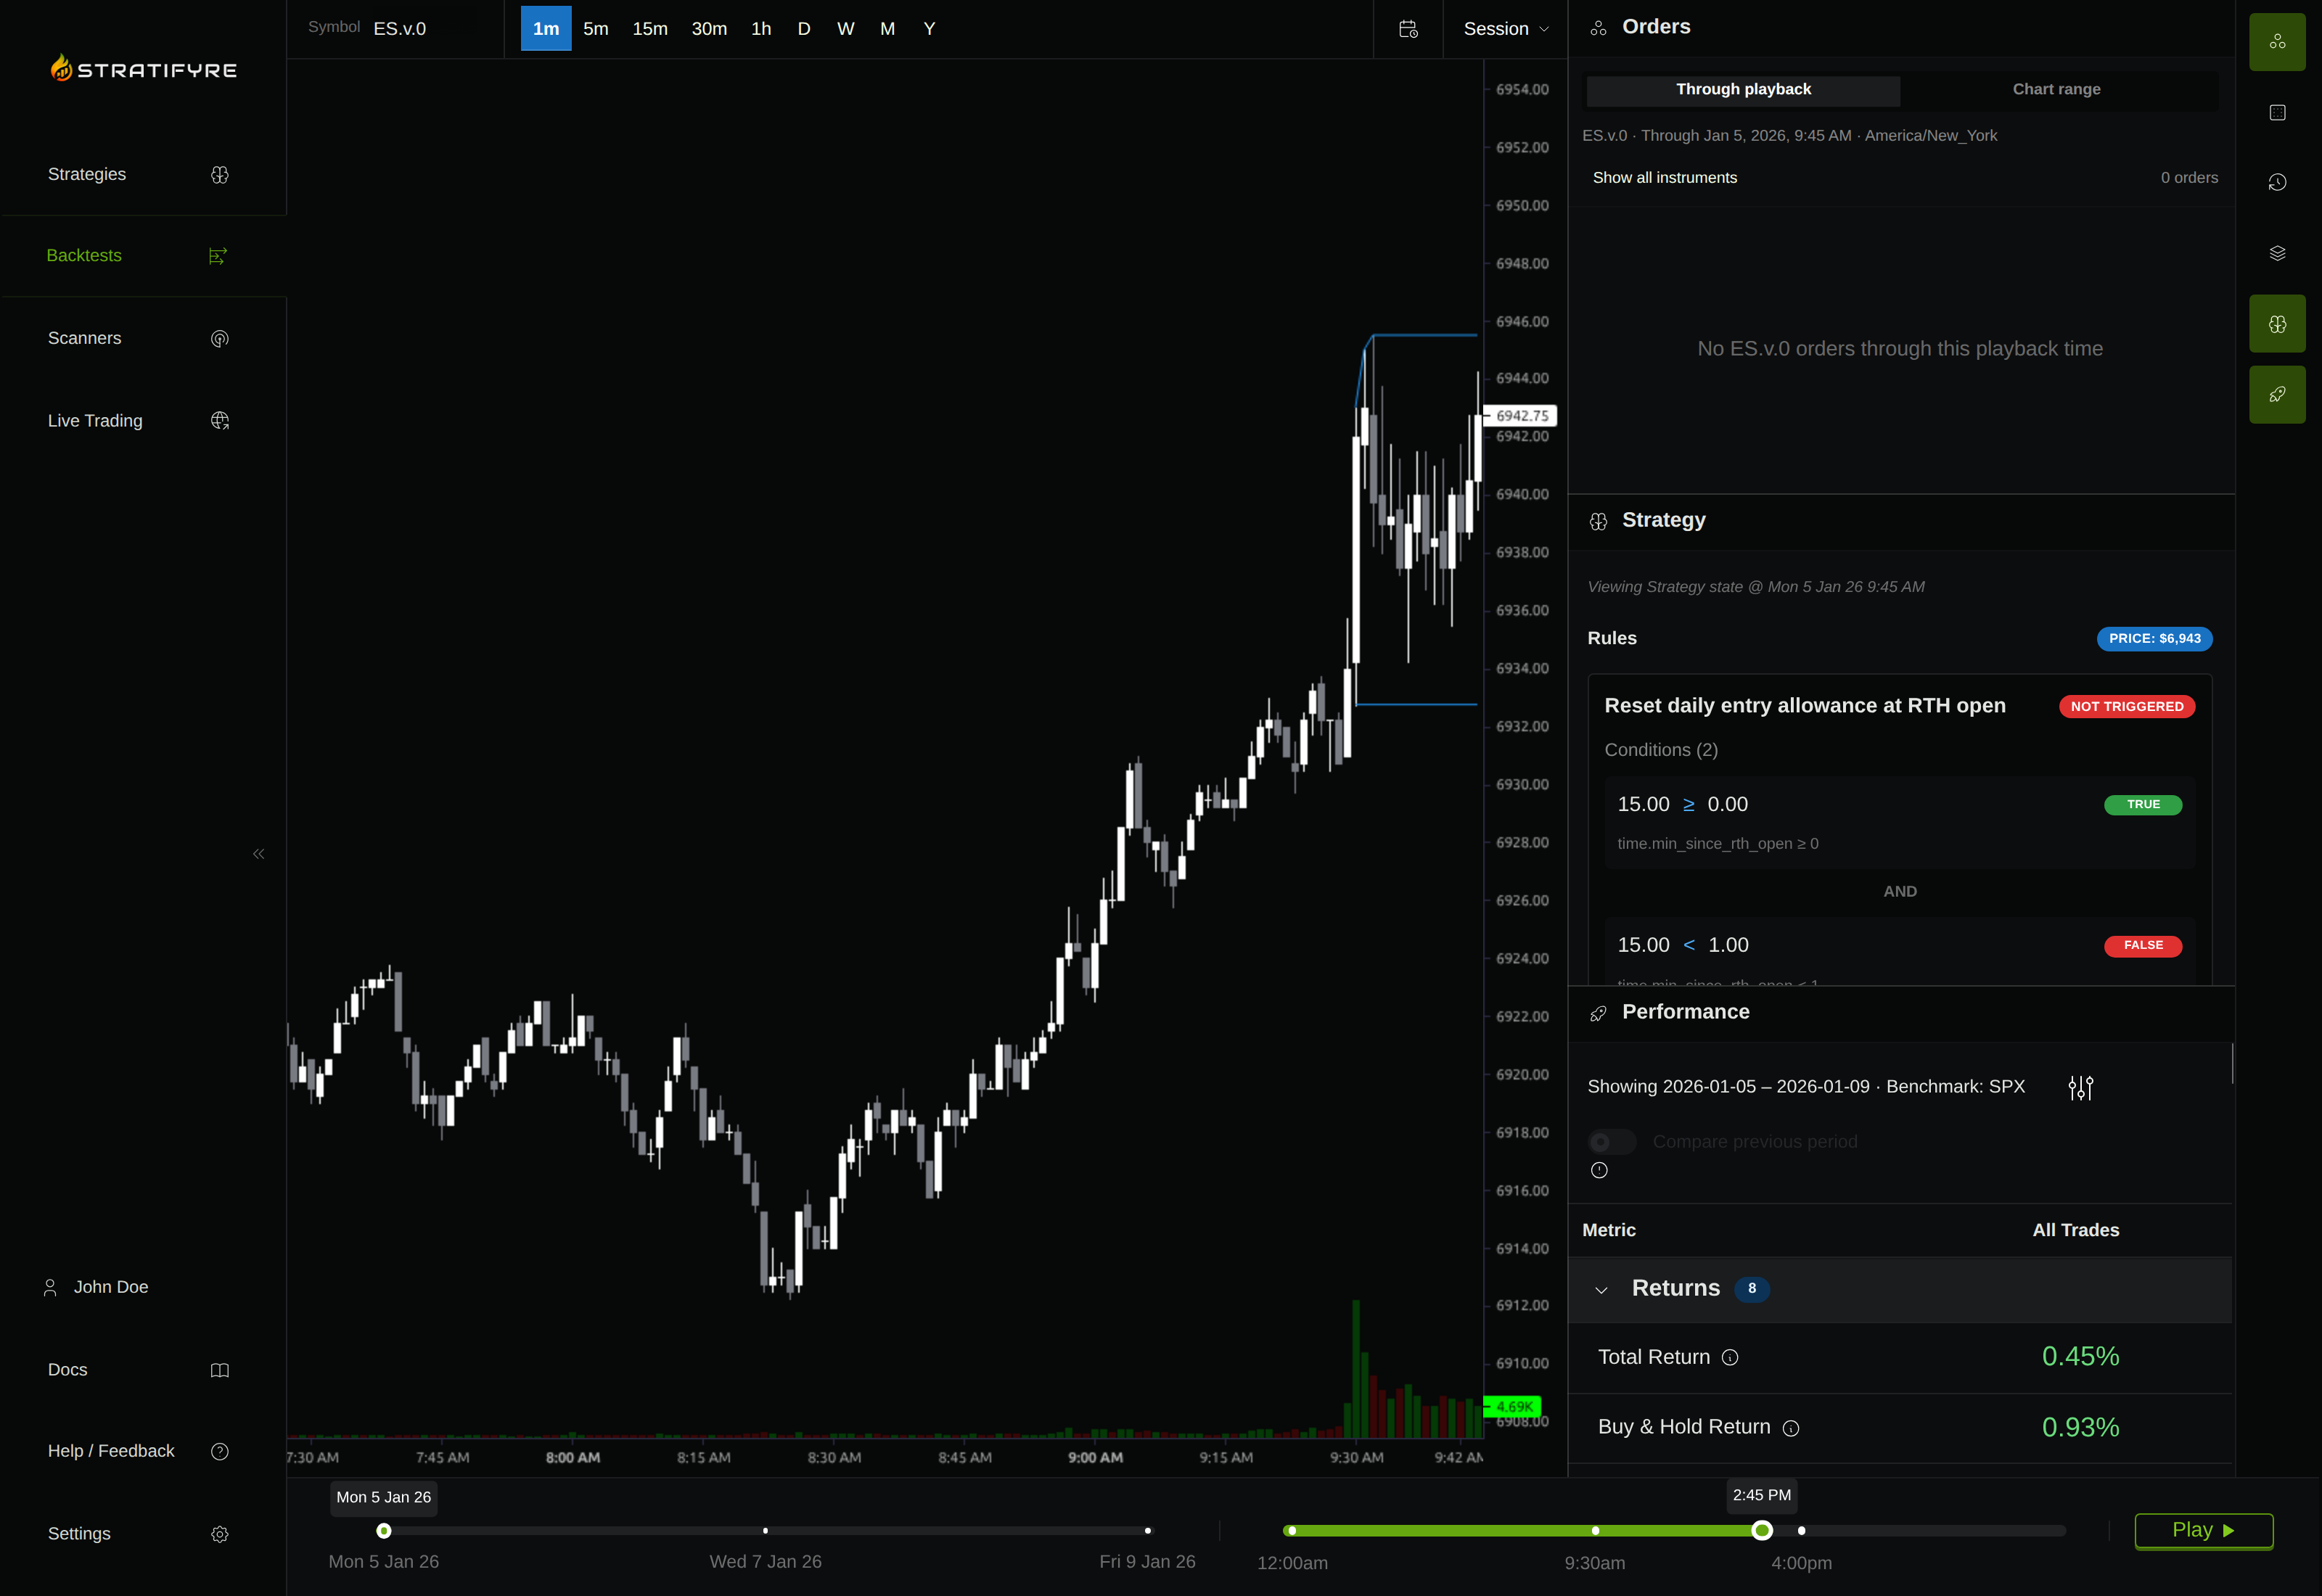
order.entry_price - 2 as the first-fill initial stop. The target is not first-fill anchored; the selected trade below shows why that distinction matters.
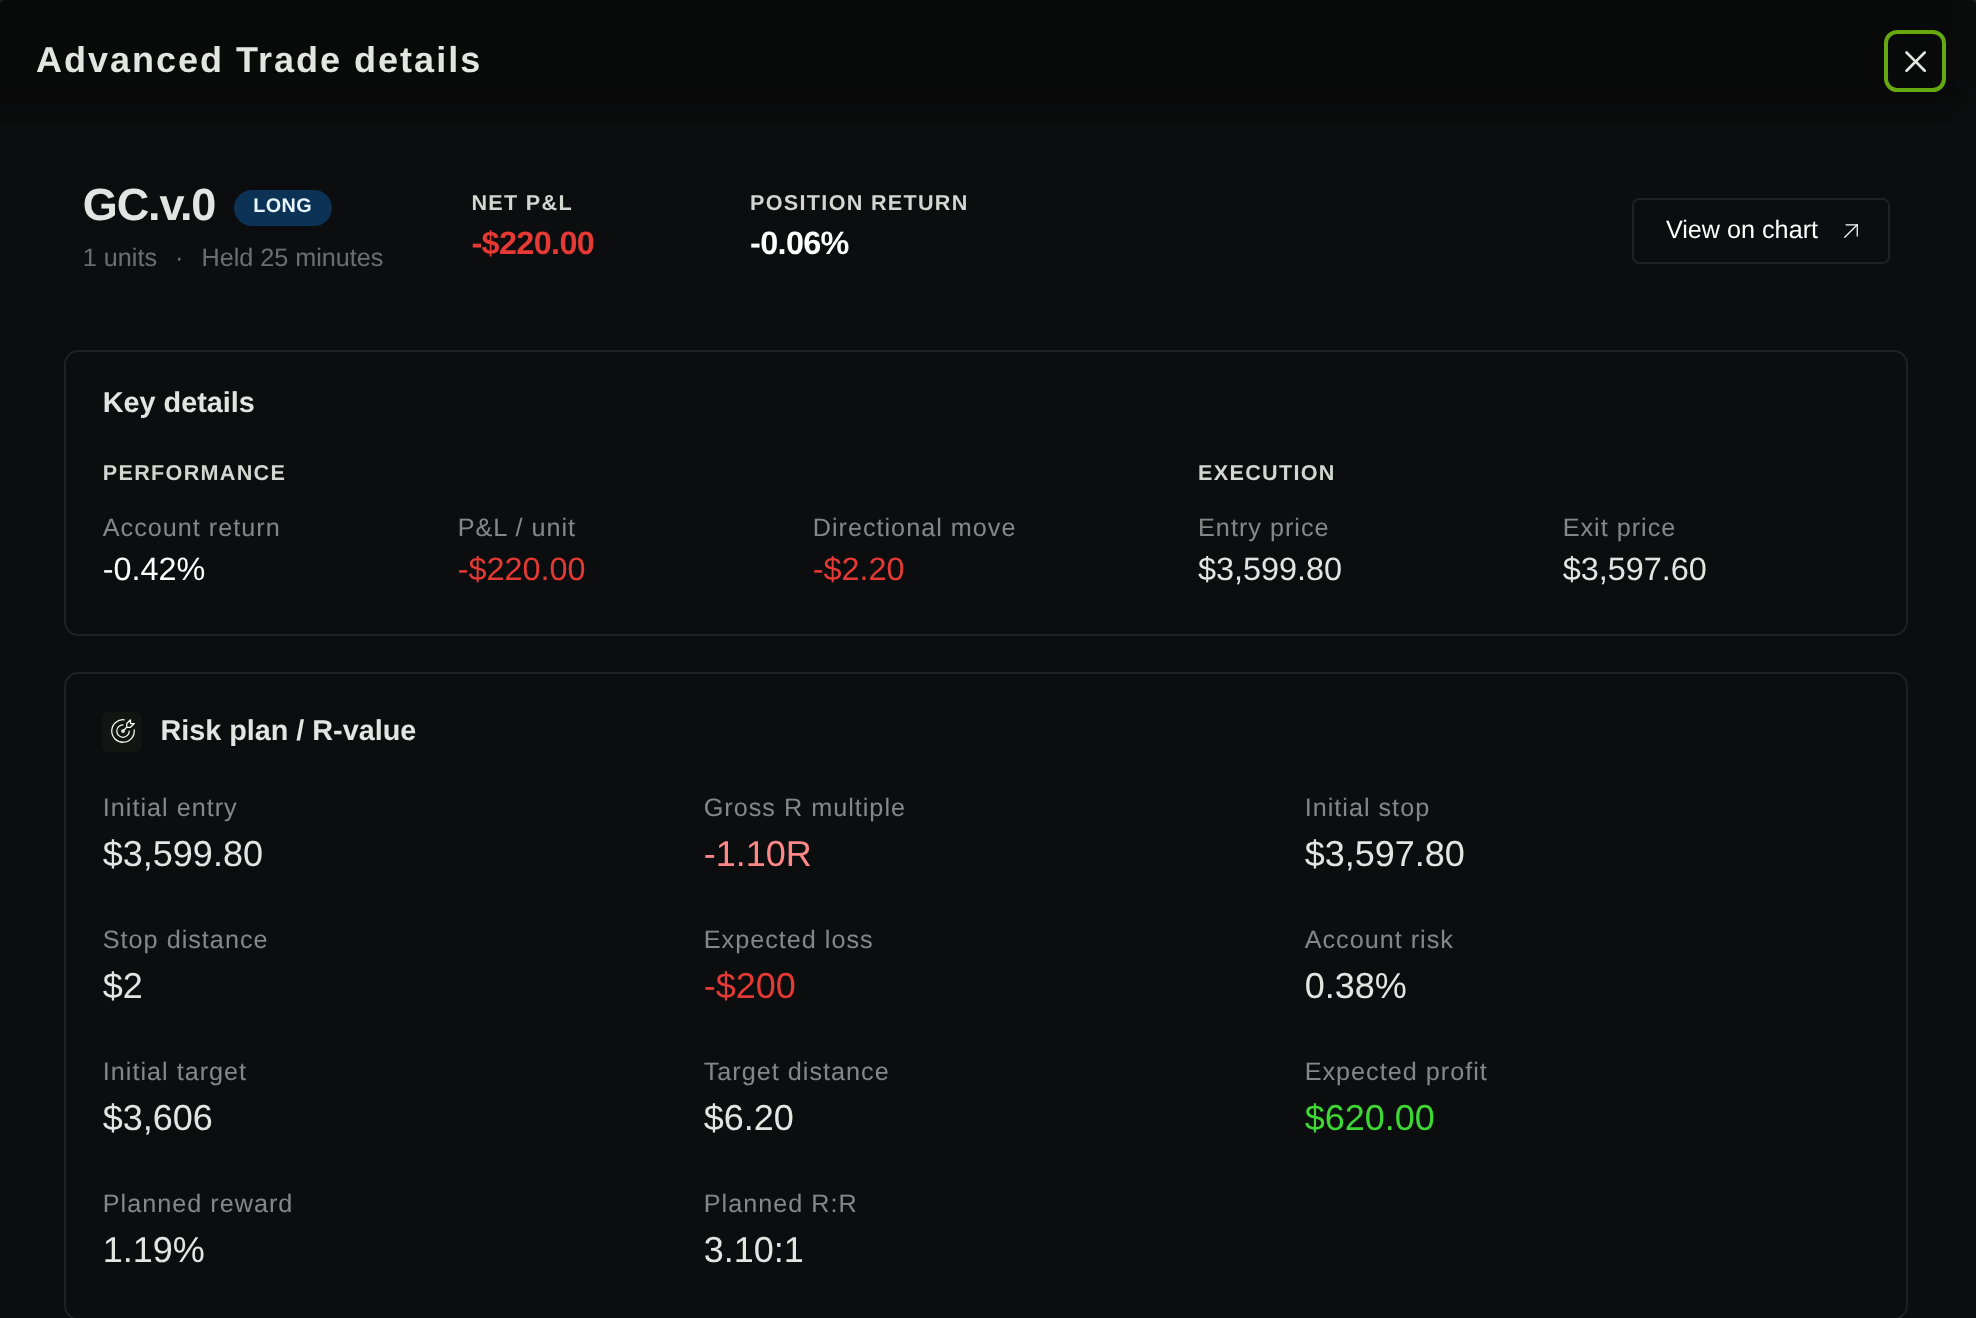
Also verify how stops, gaps, missing bars, and a bar touching both stop and target are handled. Do not assume the stop always fills at its requested price or that five-minute OHLC data reveals the order of intrabar touches. Check holiday and roll-boundary trades individually, including whether the scheduled flattening action had a tradable price.
Convert costs into ticks before comparing returns
For one GC contract, the proposed 20-tick stop represents $200 of price risk before fees, slippage, or a worse gap fill. The 40-tick target represents $400 of gross price movement.
As an illustrative cost calculation, assume $6 in total round-trip fees and one adverse tick on entry plus one on exit:
Round-trip cost = $6 + (2 × $10) = $26
Tick equivalent = $26 ÷ $10 = 2.6 ticks
These are hypothetical inputs, not a CME fee quote or a measured fill estimate. Use the appropriate exchange, clearing, broker, and regulatory charges for your account, and disclose whether the simulator already includes slippage in fill prices. Do not subtract the same slippage twice.
Apply the same initial cost assumption to both variants for a controlled comparison, then test a prespecified worse-cost case. Equal assumptions do not prove equal real execution quality across hours. Spread or depth evidence is needed to support a session-specific fill estimate.
Compare opportunities, exposure, and downside
Run A and B separately using identical data coverage and configuration except the entry window. Keep the full eligible-date list, including days with zero trades. Missing data must be identified rather than counted as a quiet session.
Record a compact comparison:
- Eligible days and qualifying signals: did the restriction leave enough opportunities to study?
- Completed trades and net P&L per trade: did the typical trade cover its modeled costs?
- Net P&L per eligible day: did fewer trades improve the outcome or merely reduce activity?
- Maximum drawdown and worst trade: what downside accompanied the result?
- Time in market and exits outside the entry window: did the variants carry comparable exposure?
Separate a better average trade from a better total outcome. A window can eliminate weak trades while also eliminating most profitable opportunities. Inspect whether a few unusual days account for the apparent difference; a small sample cannot support a broad session claim.
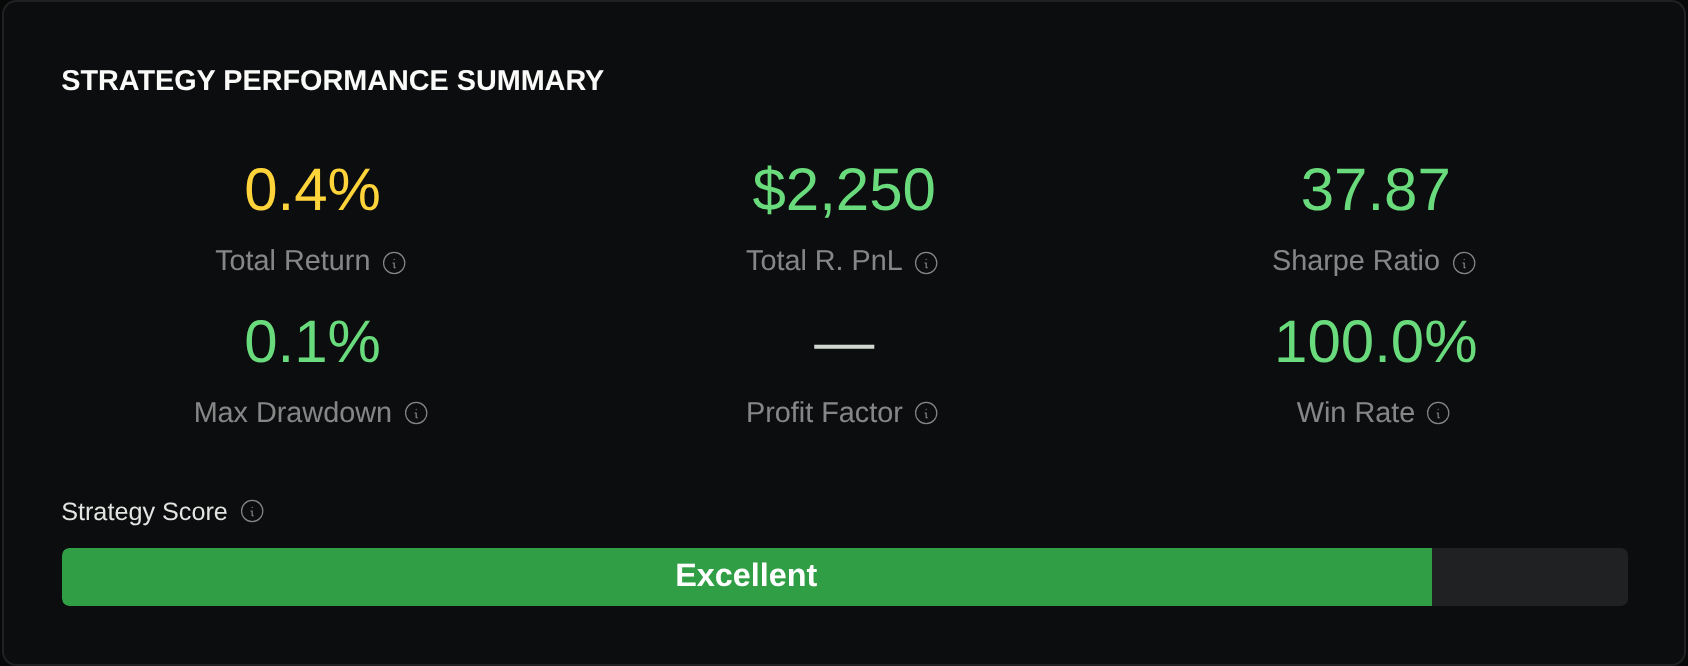
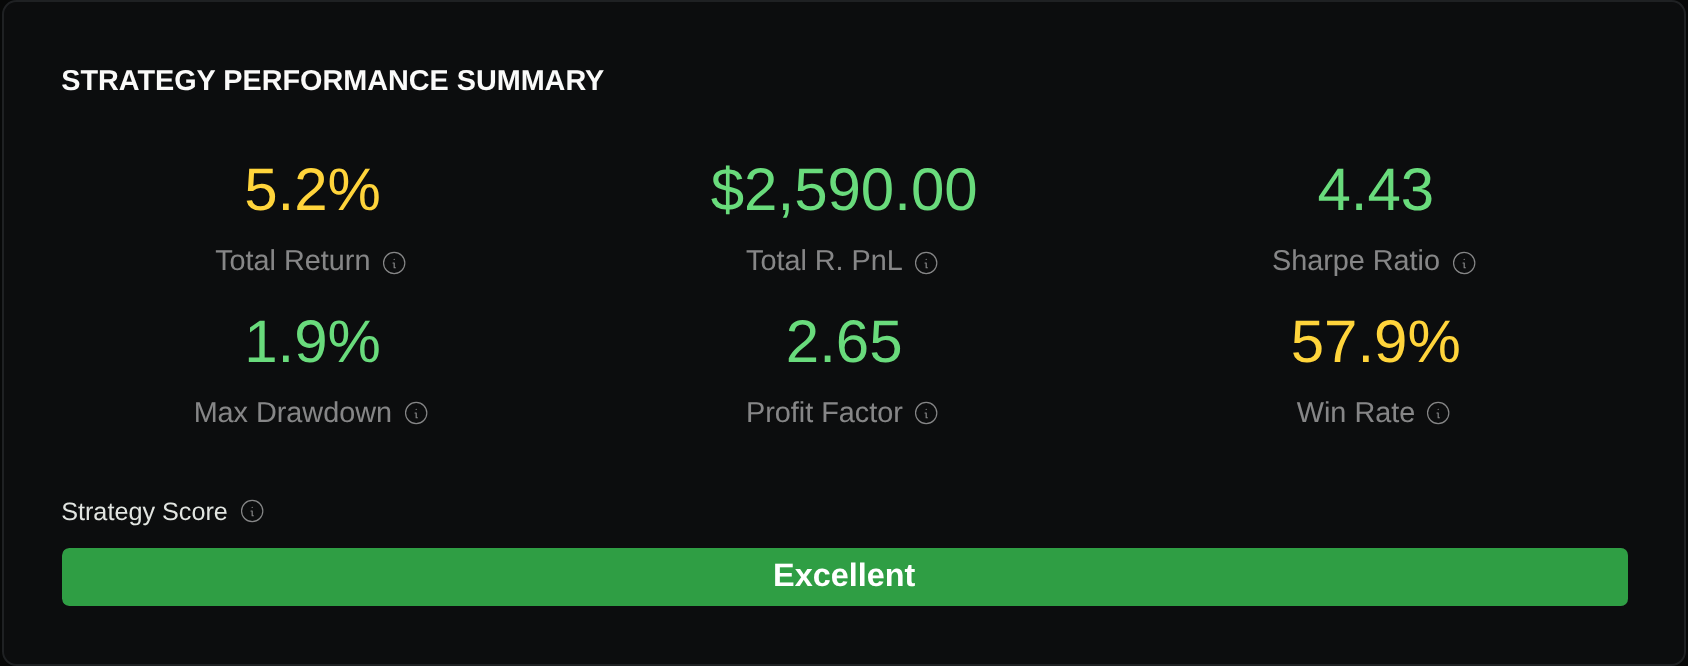
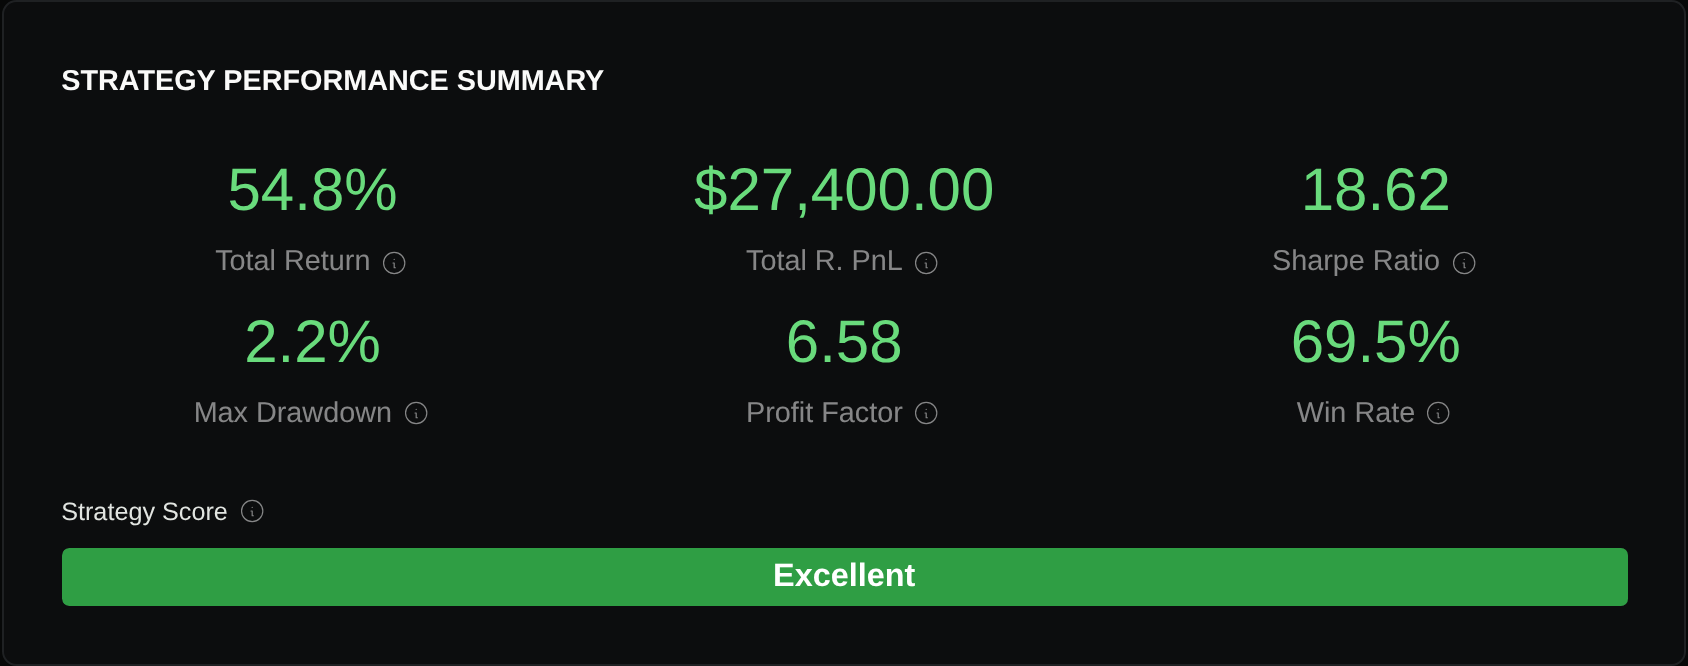
The actual development runs completed with 19 trades for A and 59 for B. The following cards show the product’s provisional $2,590 and $27,400 P&L outputs, respectively. All recorded trade fees are zero despite a $3 futures-fee setting, and the target-distance discrepancy remains unresolved; the displayed results and scores cannot establish which session is preferable after costs.
An hour-of-day export grouping is not a replacement for separate restricted runs. Removing trades afterward can change neither the original position occupancy nor the capital available when later signals occurred. Also distinguish grouping by entry time from allocating P&L to the hours during which a position was held.
Check later data without moving the windows
Freeze the rules, costs, and two windows after development. Apply them unchanged to the reserved later period, and compare each variant on the same valid dates. Keep losing and empty results in the record.
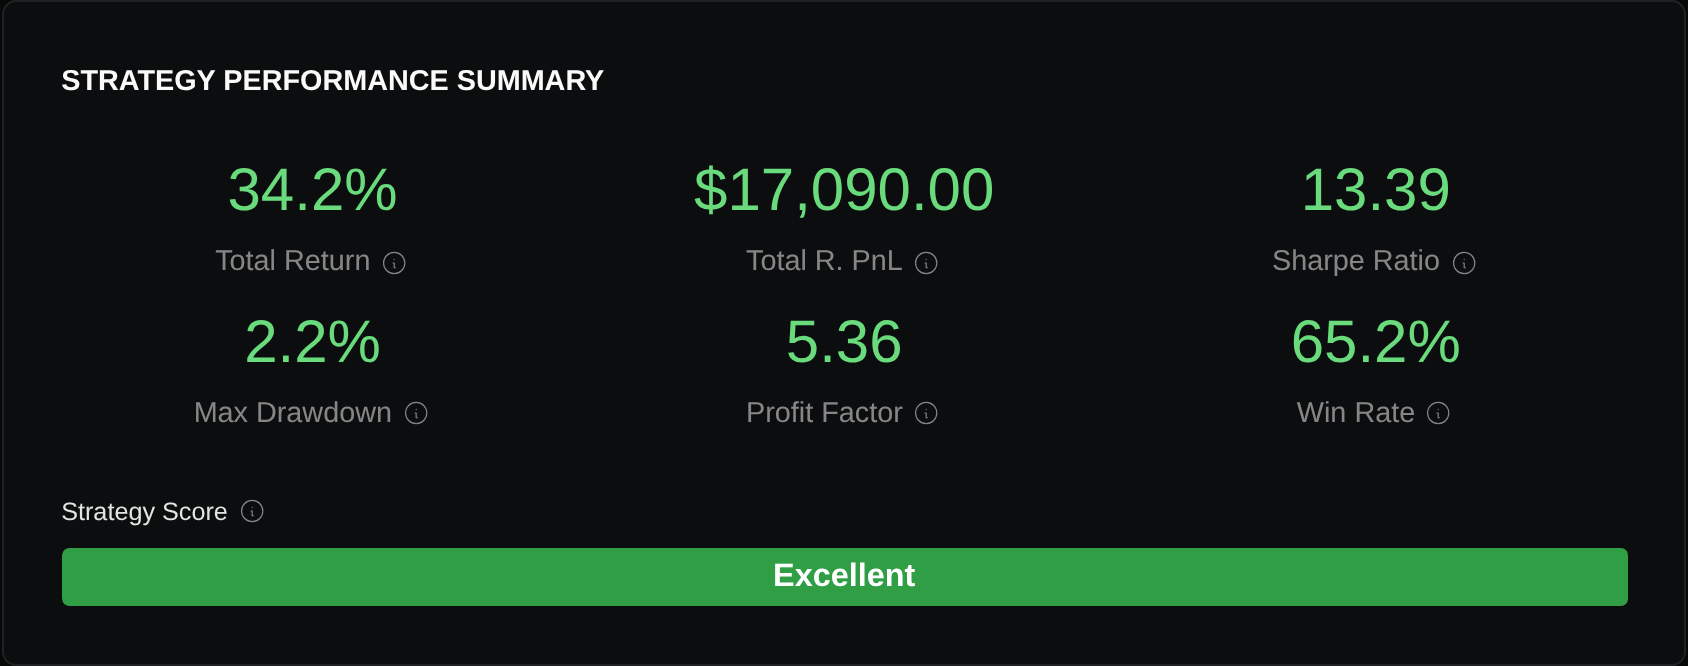
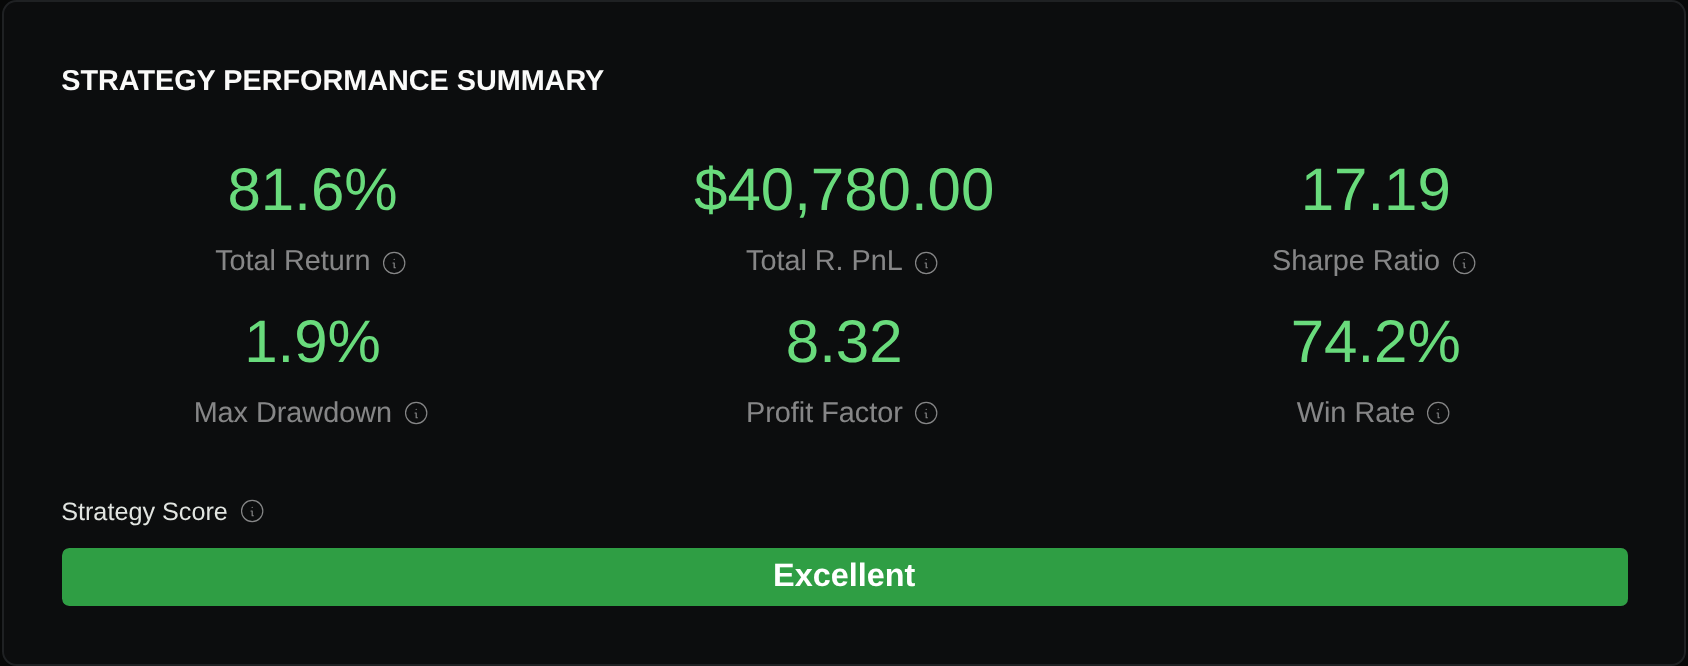
The separate later demonstrations use September 15–October 31, 2025 and the same saved rules: 46 trades for A and 66 for B. Their provisional reports show $17,090 and $40,780 P&L. These additional completed runs preserve the open execution and fee limitations; they do not turn the displayed difference into an independently validated result.
If the difference disappears, the useful finding is that the session restriction did not carry through that test. If it persists, check boundary trades, drawdown, cost sensitivity, and contract coverage before treating it as more than a hypothesis. Searching many windows and reporting only the best one adds a selection problem that a single later comparison does not erase.
To test a defined restriction on your own gold setup, use the backtest configuration guide to organize the common assumptions, then verify the contract calendar and clock before running either variant.
Put your strategy rules to the test
Build your strategy, inspect historical trades, and review the assumptions behind your results.
Build and test your strategy