Futures trailing drawdown: what proves a loss-floor breach?
Check the active loss floor against marked account equity. Learn why profitable closing trades and a low drawdown report cannot prove prop-evaluation compliance.
A futures strategy can finish a day profitably after its open positions have crossed a loss limit. To investigate a trailing-drawdown breach, you need the account equity at the moment of the test, the floor active then, and the rule that connects them.
An end-of-day balance answers a different question: where did the account finish? This guide uses an actual executed ES backtest to show what a report and trade list establish, what their observations miss, and how to keep an illustrative floor calculation separate from a firm-specific compliance decision.
Separate floor updates from breach monitoring
“End-of-day trailing” describes when a floor moves. It does not necessarily mean losses are checked only at the close.
Topstep’s current standard Trading Combine rule raises its Maximum Loss Limit with the highest end-of-day balance, never lowers it, and locks it at the starting balance. Its monitoring includes realized and unrealized P&L during the trading day; touching the limit triggers liquidation. A later exit above the floor does not reverse the earlier breach. Topstep Maximum Loss Limit.
Apex’s current Intraday Trailing Drawdown accounts use a peak that includes unrealized gains, so an open profit can raise the floor immediately. Apex also documents EOD accounts with a floor calculated at the closing cutoff and enforced during the next session. These are different account models. Apex intraday rules, Apex EOD rules.
Before testing, save the rules for your exact firm, program, phase, platform, and account. Record the update cutoff and time zone, trailing distance, lock level, treatment of commissions and cash flows, and whether equality breaches. Rules checked here on October 3, 2026 are examples of the distinction, not settings automatically applied by Stratifyre.
Compare marked equity with the active floor
For a simplified account without deposits or withdrawals:
Marked equity = starting equity + gross realized price P&L + gross unrealized price P&L − separately charged costs
Headroom = marked equity − active floor
Both P&L terms here exclude commissions and other charges; subtract each separately charged cost once. If your source supplies net P&L, do not subtract costs already included in that figure again.
Under a touch-or-below rule, headroom of zero is already a breach. The active floor needs its own history: an EOD update must not be applied retrospectively to earlier trades, and an intraday peak must not disappear when a position closes.
Synthetic illustration, not market data or a product result: start with $50,000 and a $2,000 trailing distance, before any lock level is reached. Both models begin with a $48,000 floor.
| Observation | Marked equity | EOD floor during this session | Intraday floor |
|---|---|---|---|
| Start | $50,000 | $48,000 | $48,000 |
| Open profit peak | $51,000 | $48,000 | $49,000 |
| Later open loss | $49,000 | $48,000 | $49,000 |
| Hypothetical recovery | $50,200 | $48,000 | $49,000 |
The $49,000 observation has $1,000 headroom under the EOD floor and zero under the intraday floor. The recovery row is counterfactual after an intraday breach: a rule that liquidates on touch would interrupt this path. Looking only at $50,200 would hide the event that mattered.
Audit an actual ES report before using it
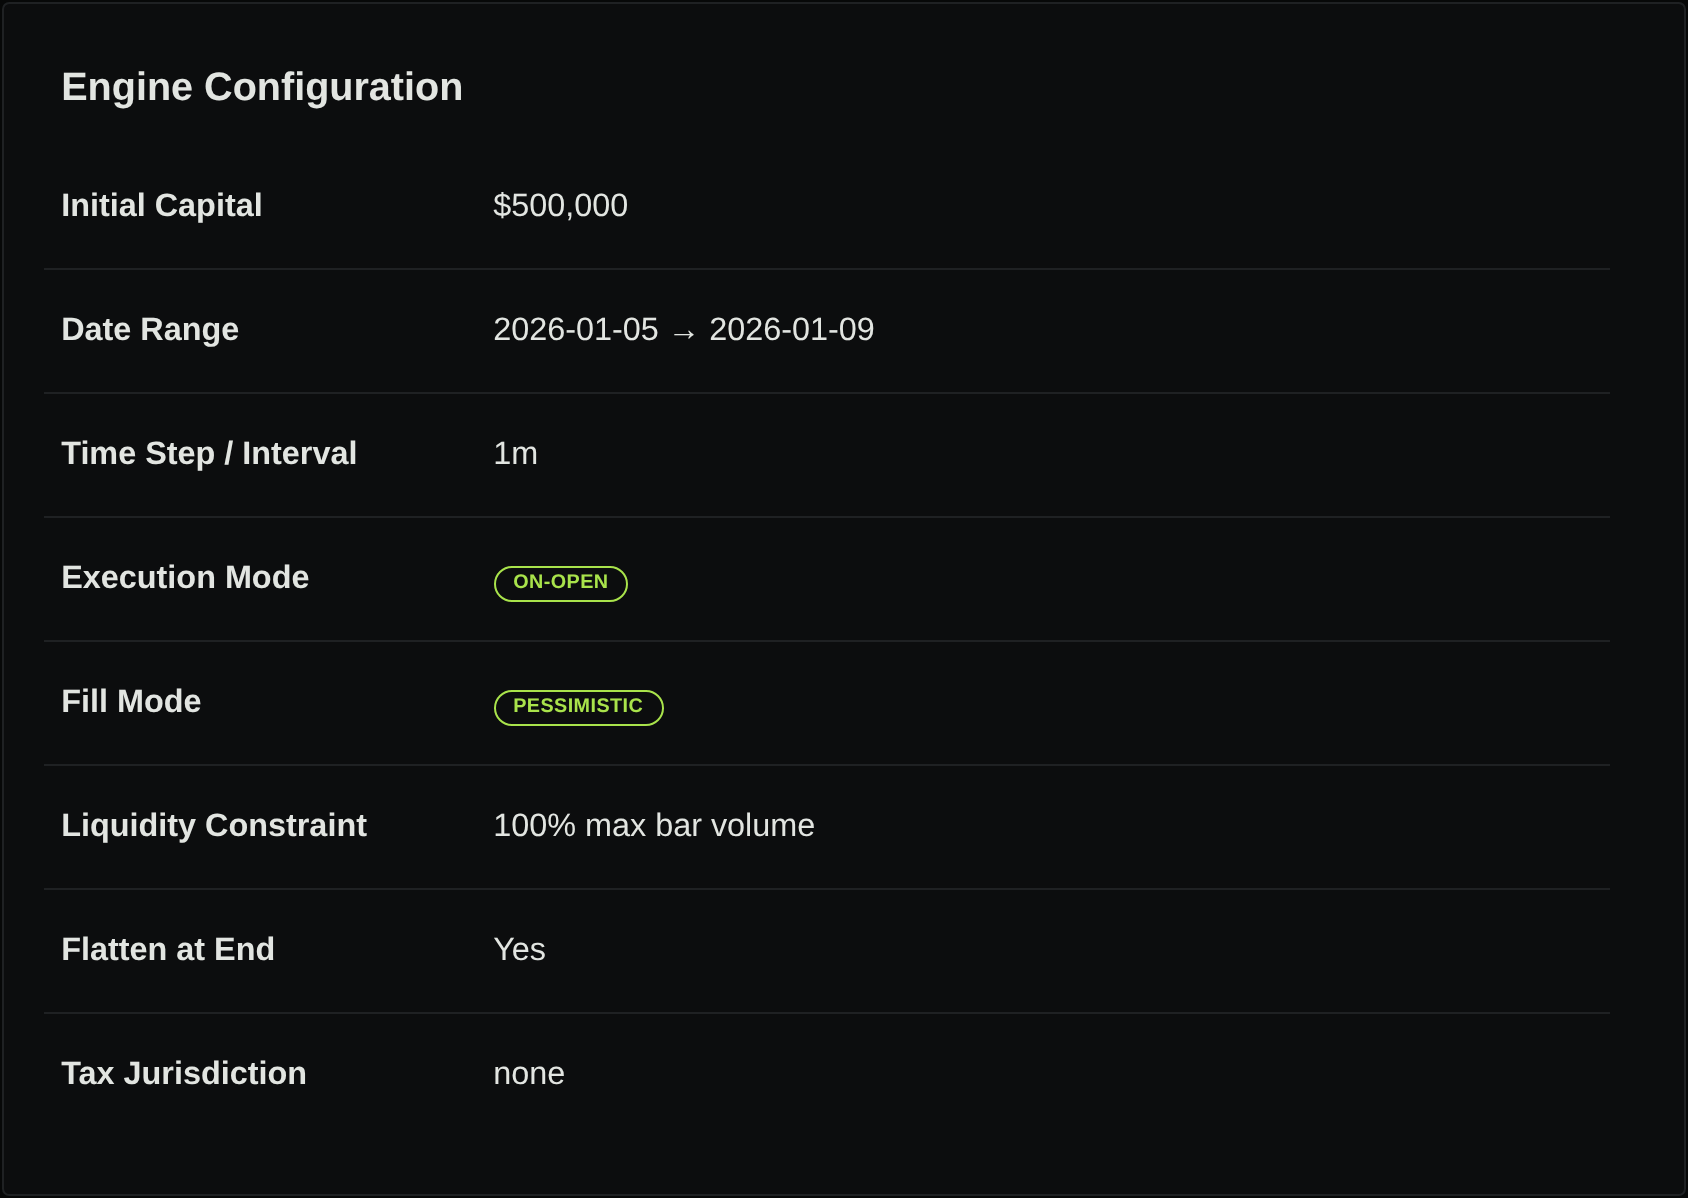
The retained Stratifyre opening-range pilot used FUT:CME:ES.v.0, a continuous ES futures series, January 5–9, 2026, one-minute bars, one contract per entry, and $500,000 starting capital. Its saved execution was on-open with pessimistic fills. It was an ordinary strategy backtest, with no demonstrated prop-firm floor or liquidation rule.
The completed report returned five trades and $2,250 P&L, ending at $502,250. The five recorded trade P&Ls sum to that amount:
| Trade exit date, UTC | Recorded P&L | Equity reconstructed after closed trade |
|---|---|---|
| January 5 | $25.00 | $500,025.00 |
| January 6 | $1,875.00 | $501,900.00 |
| January 7 | $25.00 | $501,925.00 |
| January 8 | $37.50 | $501,962.50 |
| January 9 | $287.50 | $502,250.00 |
These are post-trade balances, not verified firm EOD observations. The capital also differs from the synthetic $50,000 example; relabeling this report as a $50,000 evaluation would misstate its configuration.
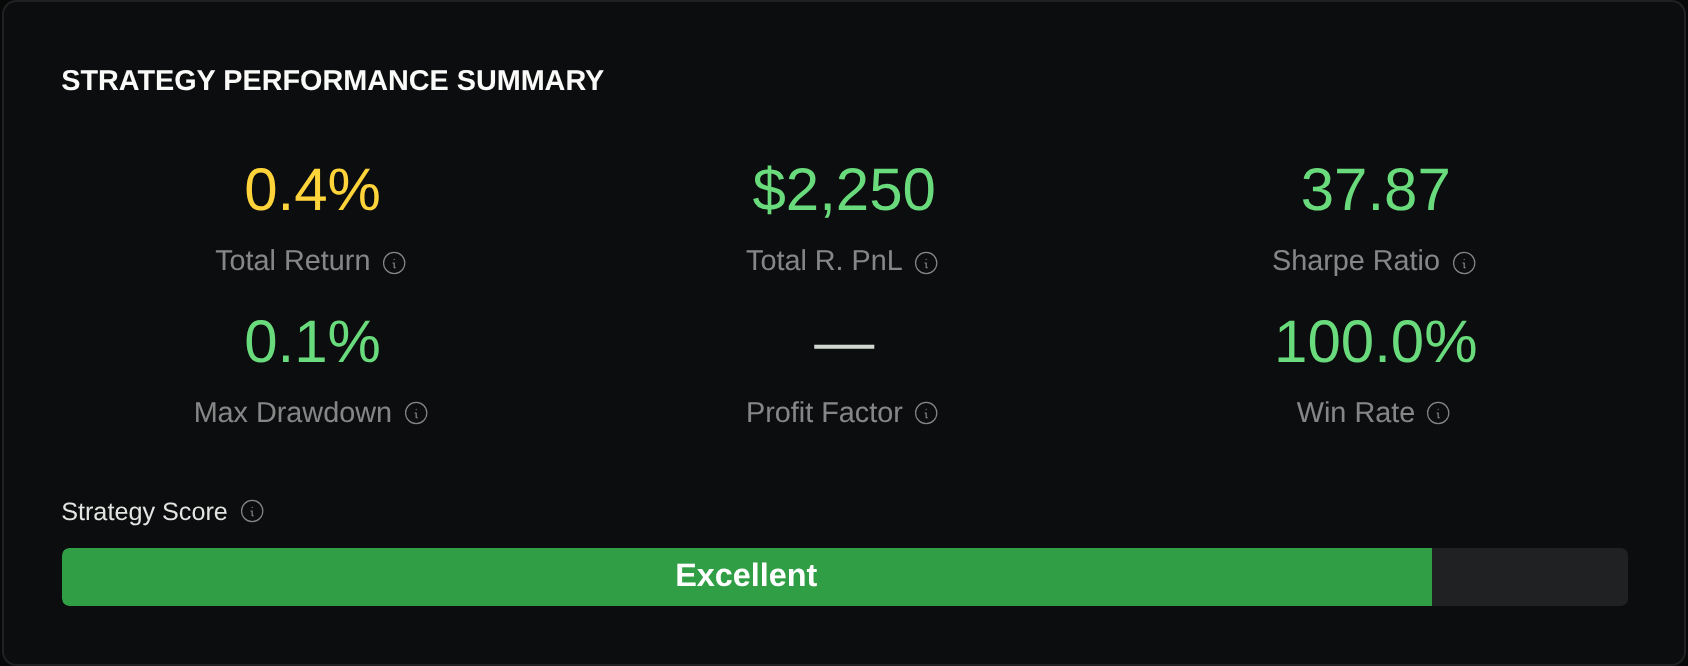
The saved configuration requested a $2.50 futures fee and one-tick slippage, but every returned trade fee was zero. Applied slippage was not independently reconciled. Treat $2,250 as the recorded result; do not describe it as verified net performance under the requested cost model.
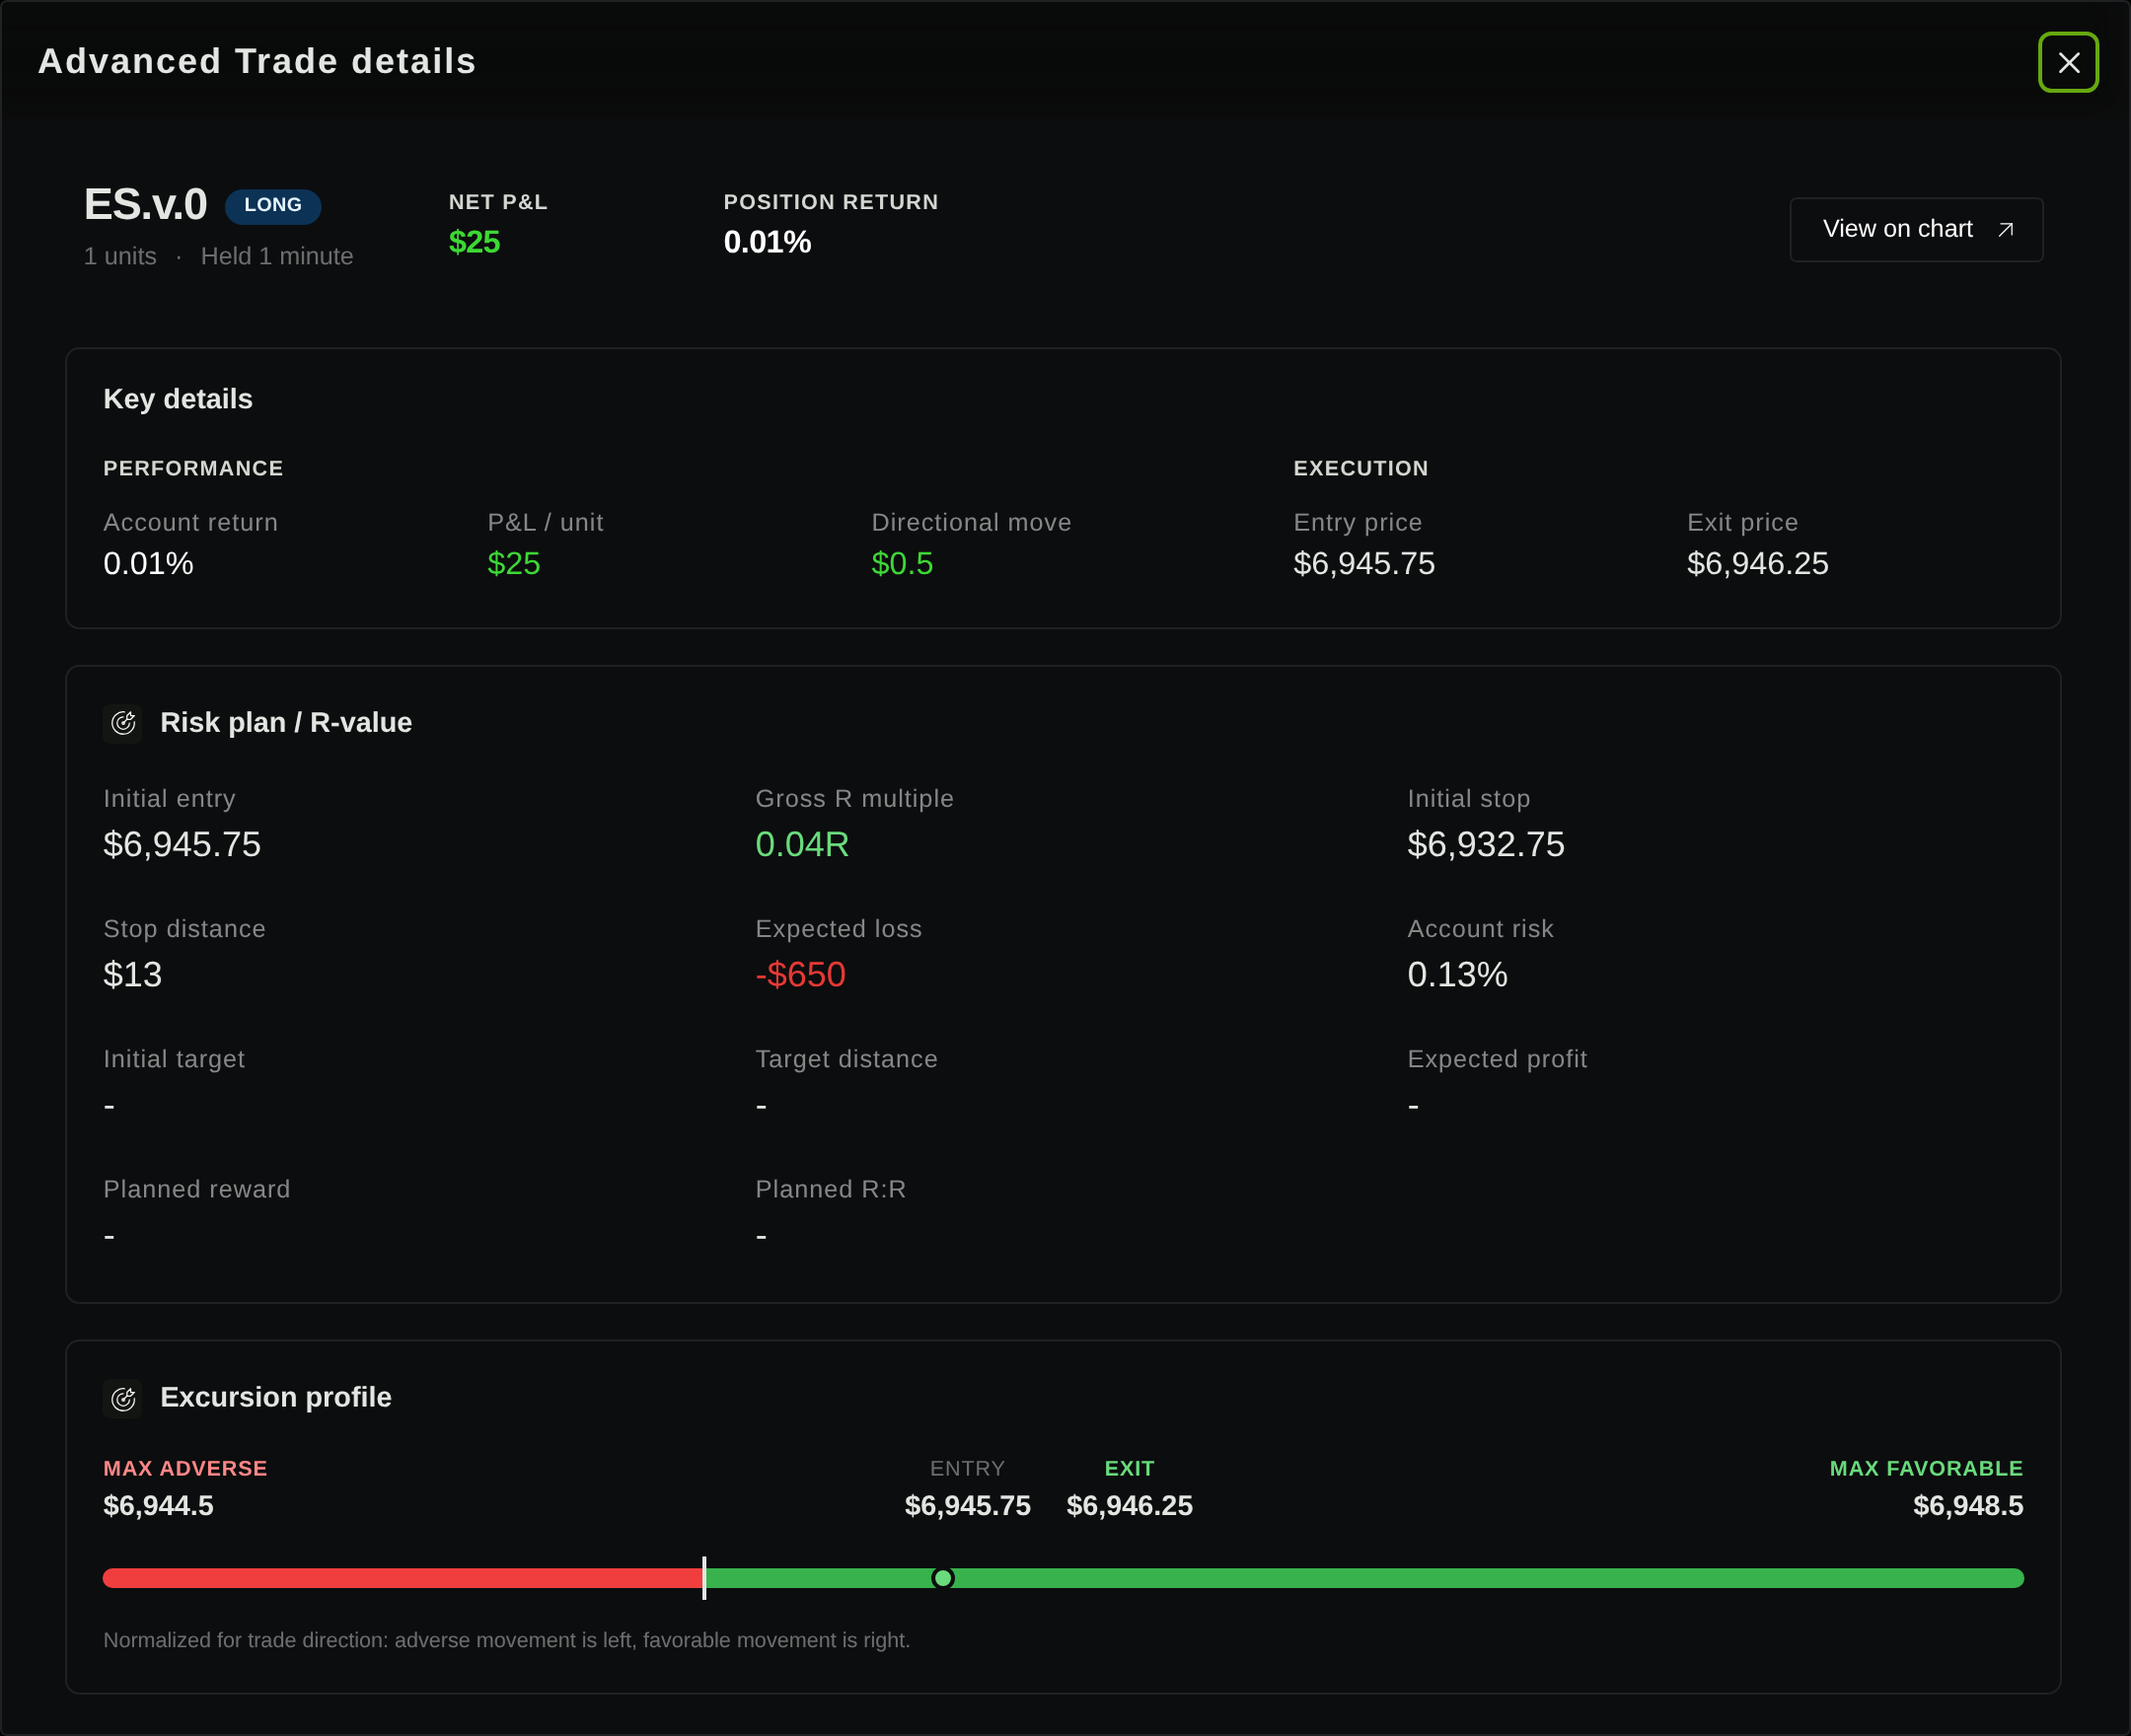
The first trade entered long at 6,945.75 and exited at 6,946.25. ES is worth $50 per index point, so its recorded $25 P&L reconciles as 0.50 × $50 × 1. Its initial stop at 6,932.75 implies $650 of intended price risk before costs: 13 × $50. That stop plan is not a guaranteed loss cap. CME contract multiplier and tick-value explanation.
More observations help, but gaps still matter
The full equity response returned 1,955 observations: 1,950 adjacent intervals of 60 seconds and four overnight gaps of 63,000 seconds. “Full” retrieved the stored observations without extra API downsampling; it did not turn one-minute observations into a tick-by-tick risk log.
An author calculation over those samples found a largest peak-to-later-sample dollar decline of $362.50. The report’s separate dollar drawdown field returned about $363.97, so those values are not interchangeable. Neither value identifies the firm floor active at the time. A small reported drawdown cannot exclude an unrecorded within-minute breach or substitute for verified costs, session boundaries, and floor updates.
For another illustrative calculation, subtract $2,000 from the highest reconstructed post-trade equity, without a lock cap. The first resulting floor is $498,025; after the final trade it is $500,250. This arithmetic describes a hypothetical post-trade update schedule. It is neither Topstep’s capped EOD rule nor Apex’s intraday rule, and it provides no intraday pass verdict.
Classify the evidence before making a decision
| Available evidence | Supportable conclusion |
|---|---|
| Correct marked equity touches a known active floor | A breach at that observed event, under the matched rule |
| Sampled equity remains above the floor | No breach at those samples; gaps remain unverified |
| Closing trades or EOD balances alone | Closing outcome; intraday compliance unresolved |
| Reconciled event stream and exact rule implementation | A historical verdict within the stated data and execution assumptions |
For a stronger check, retain timestamped account marks, position sizes, realized P&L, costs, floor updates, and the first touch event. Establish which mark the firm uses and how fills, unrealized peaks, session transitions, and floor locks are ordered. Minute-bar highs and lows can help bound a single-position excursion, but they do not reveal every price sequence or simultaneous portfolio valuation.
The ES pilot supports a report-and-trade audit. Its continuous-series construction, costs, observation gaps, and absent firm floor prevent an exact compliance conclusion. Even a matched historical test would not establish every other evaluation requirement or guarantee a funded account.
Use Stratifyre’s backtesting workflow to retain a strategy’s settings, inspect its trades, and identify what still needs reconciliation. For the underlying setup, read the ES opening-range pilot; for contract-history assumptions, read continuous futures and rollover.
Put your strategy rules to the test
Build your strategy, inspect historical trades, and review the assumptions behind your results.
Build and test your strategy