Continuous futures backtests: what happens at contract rollover?
Separate continuous futures signals from tradable contracts, roll-gap adjustments, and the fills and costs needed to calculate rollover P&L.
A multi-year futures chart can look like one instrument even though its prices come from many contracts. At a rollover, the chart starts using a different expiry. A position in the old contract still needs an explicit exit, and continuing exposure needs an entry in another contract.
That distinction answers the central question in a continuous futures backtest rollover: did the test change its input series, execute a contract roll, or do both? A smooth chart alone cannot tell you. Check the signal prices, contract mapping, and trade ledger separately before interpreting returns.
Two contracts can trade at different prices at the same time
An expiring contract and a later expiry can overlap for weeks or months. Their prices need not match. A continuous series chooses which contract supplies each part of its history; it does not make the underlying contracts identical.
Consider this hypothetical timeline, using unnamed contracts and invented price points:
| Moment | Old contract | New contract | Series choice |
|---|---|---|---|
| Earlier observation | 100 | Not needed for this illustration | Old contract |
| Roll reference instant | 105 | 110 | Switch from old to new |
| Later observation | Not needed for this illustration | 112 | New contract |
At the reference instant, the difference is five points. Connecting the old contract’s 105 directly to the new contract’s 110 creates a jump caused by changing instruments. It is not evidence that either contract rose five points during that instant. Real adjacent observations can also include market movement, so separating the two effects requires both contracts’ prices at a common reference time.
“Front month” is a choice, not a universal roll date
Different providers can produce different histories for the same futures root. CME’s settlement-based continuous price series offers front and active versions: its front series rolls two business days before expiry, while its active series follows an asset-specific schedule informed by liquidity. Those rules describe that CME dataset, not every chart or backtest provider. CME continuous price-series methodology.
Databento documents calendar, open-interest, and volume rankings. Its volume rule uses the previous day’s trading volume, and its continuous symbology maps to individual instruments while returning their original, unadjusted prices. Databento symbology.
TradingView describes symbol-specific switching schedules based on historical volume patterns. That is different from recalculating the switch whenever today’s new-contract volume exceeds today’s old-contract volume. TradingView switching-date policy.
For your test, write down:
- Selection: nearest eligible expiry, a fixed calendar schedule, or a defined liquidity ranking.
- Decision cutoff: when the volume or open-interest observation becomes available.
- Effective time: when the new contract begins supplying bars, including the session and timezone.
- Exceptions: holidays, missing contract bars, ties, and the beginning of the dataset.
A rule using a completed day’s volume cannot select that day’s opening contract without information from later in the day. Preserve that cutoff when reconstructing historical decisions. Also check the exact contract’s last trading day, settlement method, and any applicable delivery or broker deadlines; a chart’s switch date does not determine how an account handles expiry.
An adjustment changes the chart, not your fills
An unadjusted splice retains the prices of the selected contracts, including jumps when the selection changes. A back-adjusted series transforms older observations to reduce the roll gap.
TradingView’s documented method uses the difference between the new and old contracts’ daily closes near the switching point to adjust previous contracts. This is a vendor-specific reference-price policy; do not assume every adjusted dataset uses it. TradingView back-adjustment policy.
The roll gap changes the historical chart
Unadjusted splice versus a +5-point adjustment to the old contract
View example data
| Observation | Unadjusted | Adjusted |
|---|---|---|
| Earlier | 100 | 105 |
| Old at roll | 105 | 110 |
| New at roll | 110 | 110 |
| Later | 112 | 112 |
In this deliberately simple additive example, the old observation of 100 becomes 105, and its roll-reference 105 becomes 110. The new segment stays unchanged. A historical rule requiring price below 102 would therefore classify that earlier observation differently. An adjusted level should not be mistaken for a price at which the old contract actually traded.
The reference prices also matter. Daily closes, settlement prices, and an intraday roll’s executable bid and ask answer different questions. Document which prices determine the adjustment and which determine fills. If later rolls revise earlier adjusted values, retain the dataset version and check how historical signals are reconstructed.
A held position needs a roll ledger
For a long position, rolling generally means selling the old contract and buying the later contract. CME describes rollover as offsetting the existing position and establishing a new one; leaving a contract open through expiration instead invokes its settlement terms. CME expiration and contract-roll explanation.
Here is hypothetical arithmetic, not an executed strategy. Assume one contract, a made-up multiplier of $10 per point, unchanged quantity, and reference fills of 100 → 105 in the old contract and 110 → 112 in the new one:
| Ledger item | Calculation | Amount |
|---|---|---|
| Old-contract gain | (105 − 100) × $10 | $50 |
| New-contract gain | (112 − 110) × $10 | $20 |
| Gross P&L | $50 + $20 | $70 |
| Commission assumption | Four fills × $2 | −$8 |
| Adverse slippage assumption | Four fills × $1 | −$4 |
| Net P&L | $70 − $8 − $4 | $58 |
The four fills are the initial entry, old-contract exit, new-contract entry, and final exit. The two roll fills contribute $6 of the $12 total assumed costs. Slippage here is a dollar deduction from reference-price P&L; it is not also embedded in the example’s fill prices. These values are teaching assumptions, not exchange fees or measured execution costs.
Subtracting the first raw chart price from the last gives (112 − 100) × $10 = $120. That calculation incorrectly includes the $50 splice jump. Selling one futures contract at 105 and buying another at 110 does not, by itself, realize a five-point trading loss or gain. Each contract’s gain or loss must use its own entry and exit.
The additive chart happens to produce the same $70 gross difference in this simplified example. That agreement still does not establish actual contract fills, roll timing, spread, quantity changes, or the $12 costs. A transformed price series is not a complete execution model.
Inspect one rollover before trusting the full history
Choose a short window around a known switch and inspect both contract histories alongside the continuous series. Keep the original prices available even if signals use an adjusted series.
- Identify the contracts. Record the full exchange, root, expiry, and instrument identifiers before and after the switch.
- Reconcile the bars. Check which contract supplies each continuous bar, the effective timestamp, and the adjustment reference and amount.
- Inspect the signal. Determine whether the contract change or price transformation changed an entry, stop, or exit condition.
- Inspect held exposure. Find the old-contract close and new-contract open, their quantities, fill prices, fees, and timestamps in the trade ledger.
- Reconcile P&L. Calculate the two contract segments and costs separately, then compare their total with the reported result.
For a Stratifyre backtest, retain the selected full instrument identifier and saved configuration with this record. Require contract-level evidence before treating a continuous-series result as a verified rollover simulation. Historical chart continuity also does not establish that a live-trading session will automatically move an existing position into another expiry.
If the result provides only a continuous symbol and chart, the execution questions remain unresolved. You can still study the signal history, but an account-level return interpretation needs the missing contract and fill evidence.
What the product currently exposes
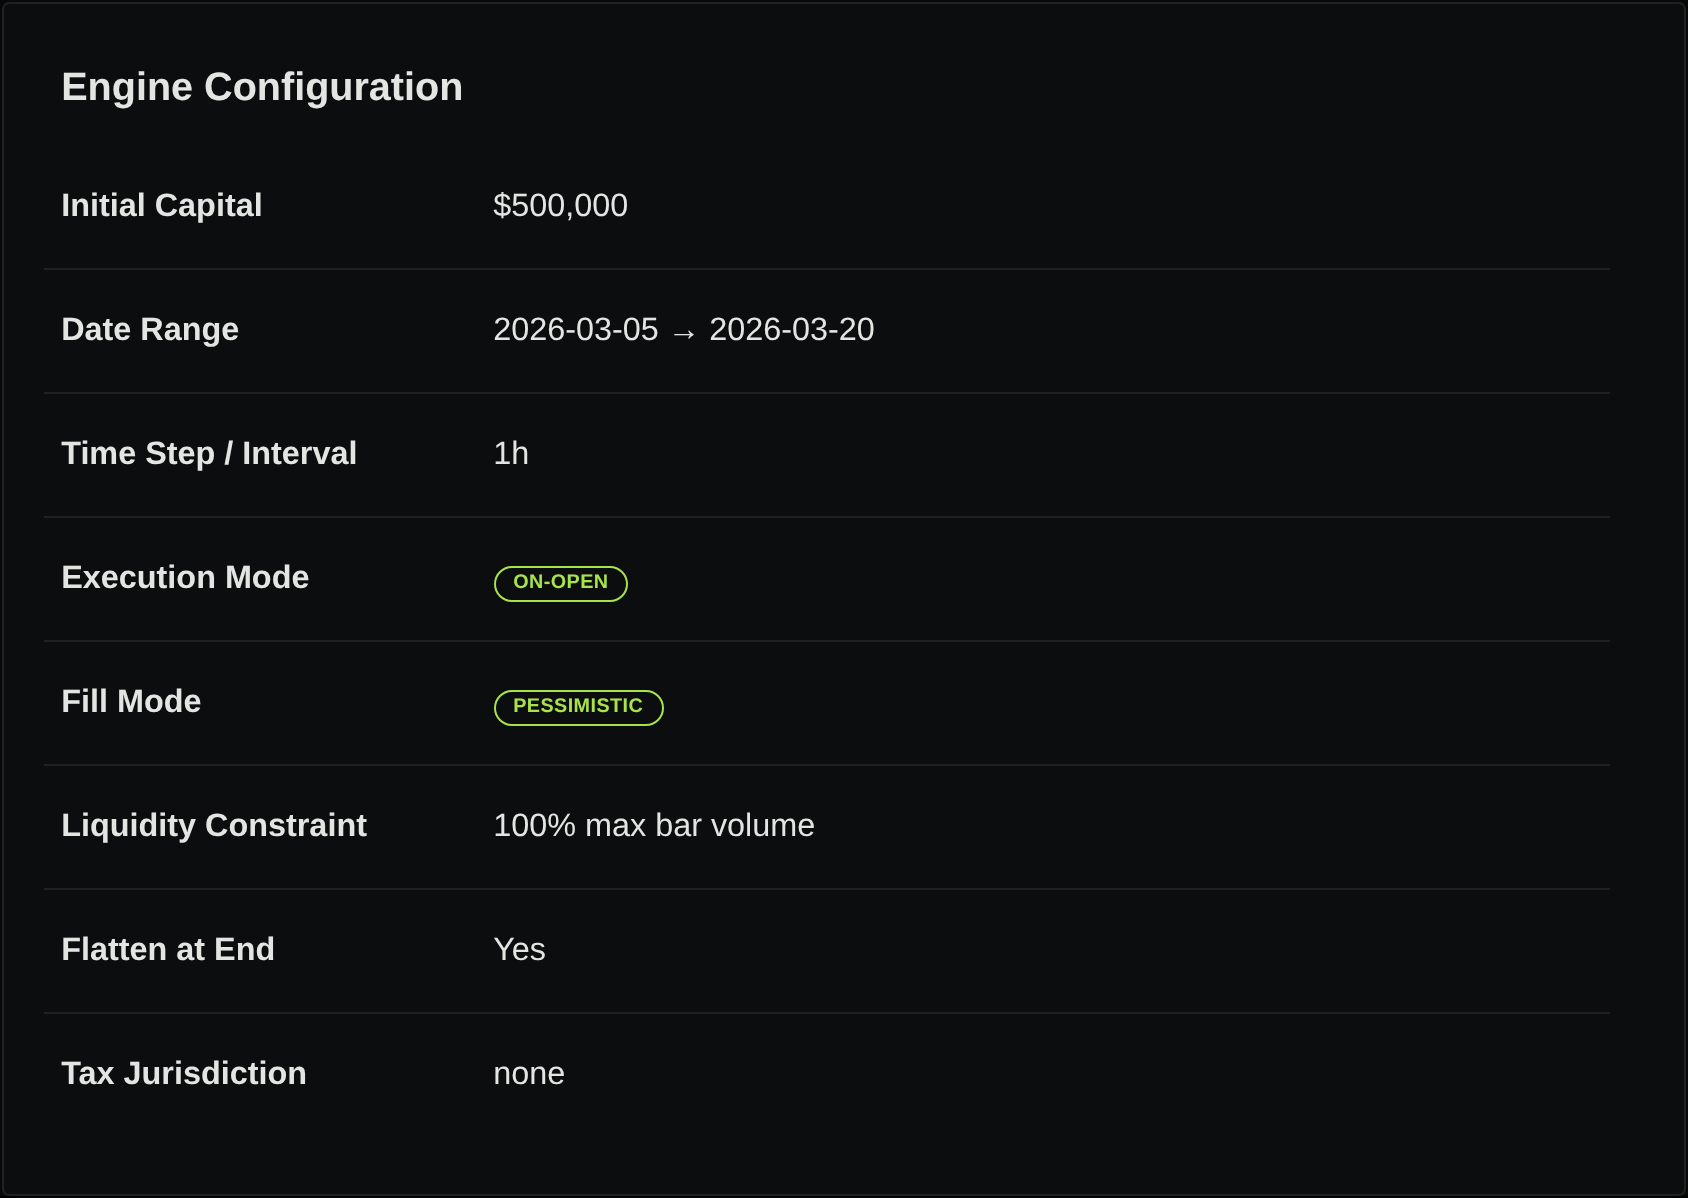
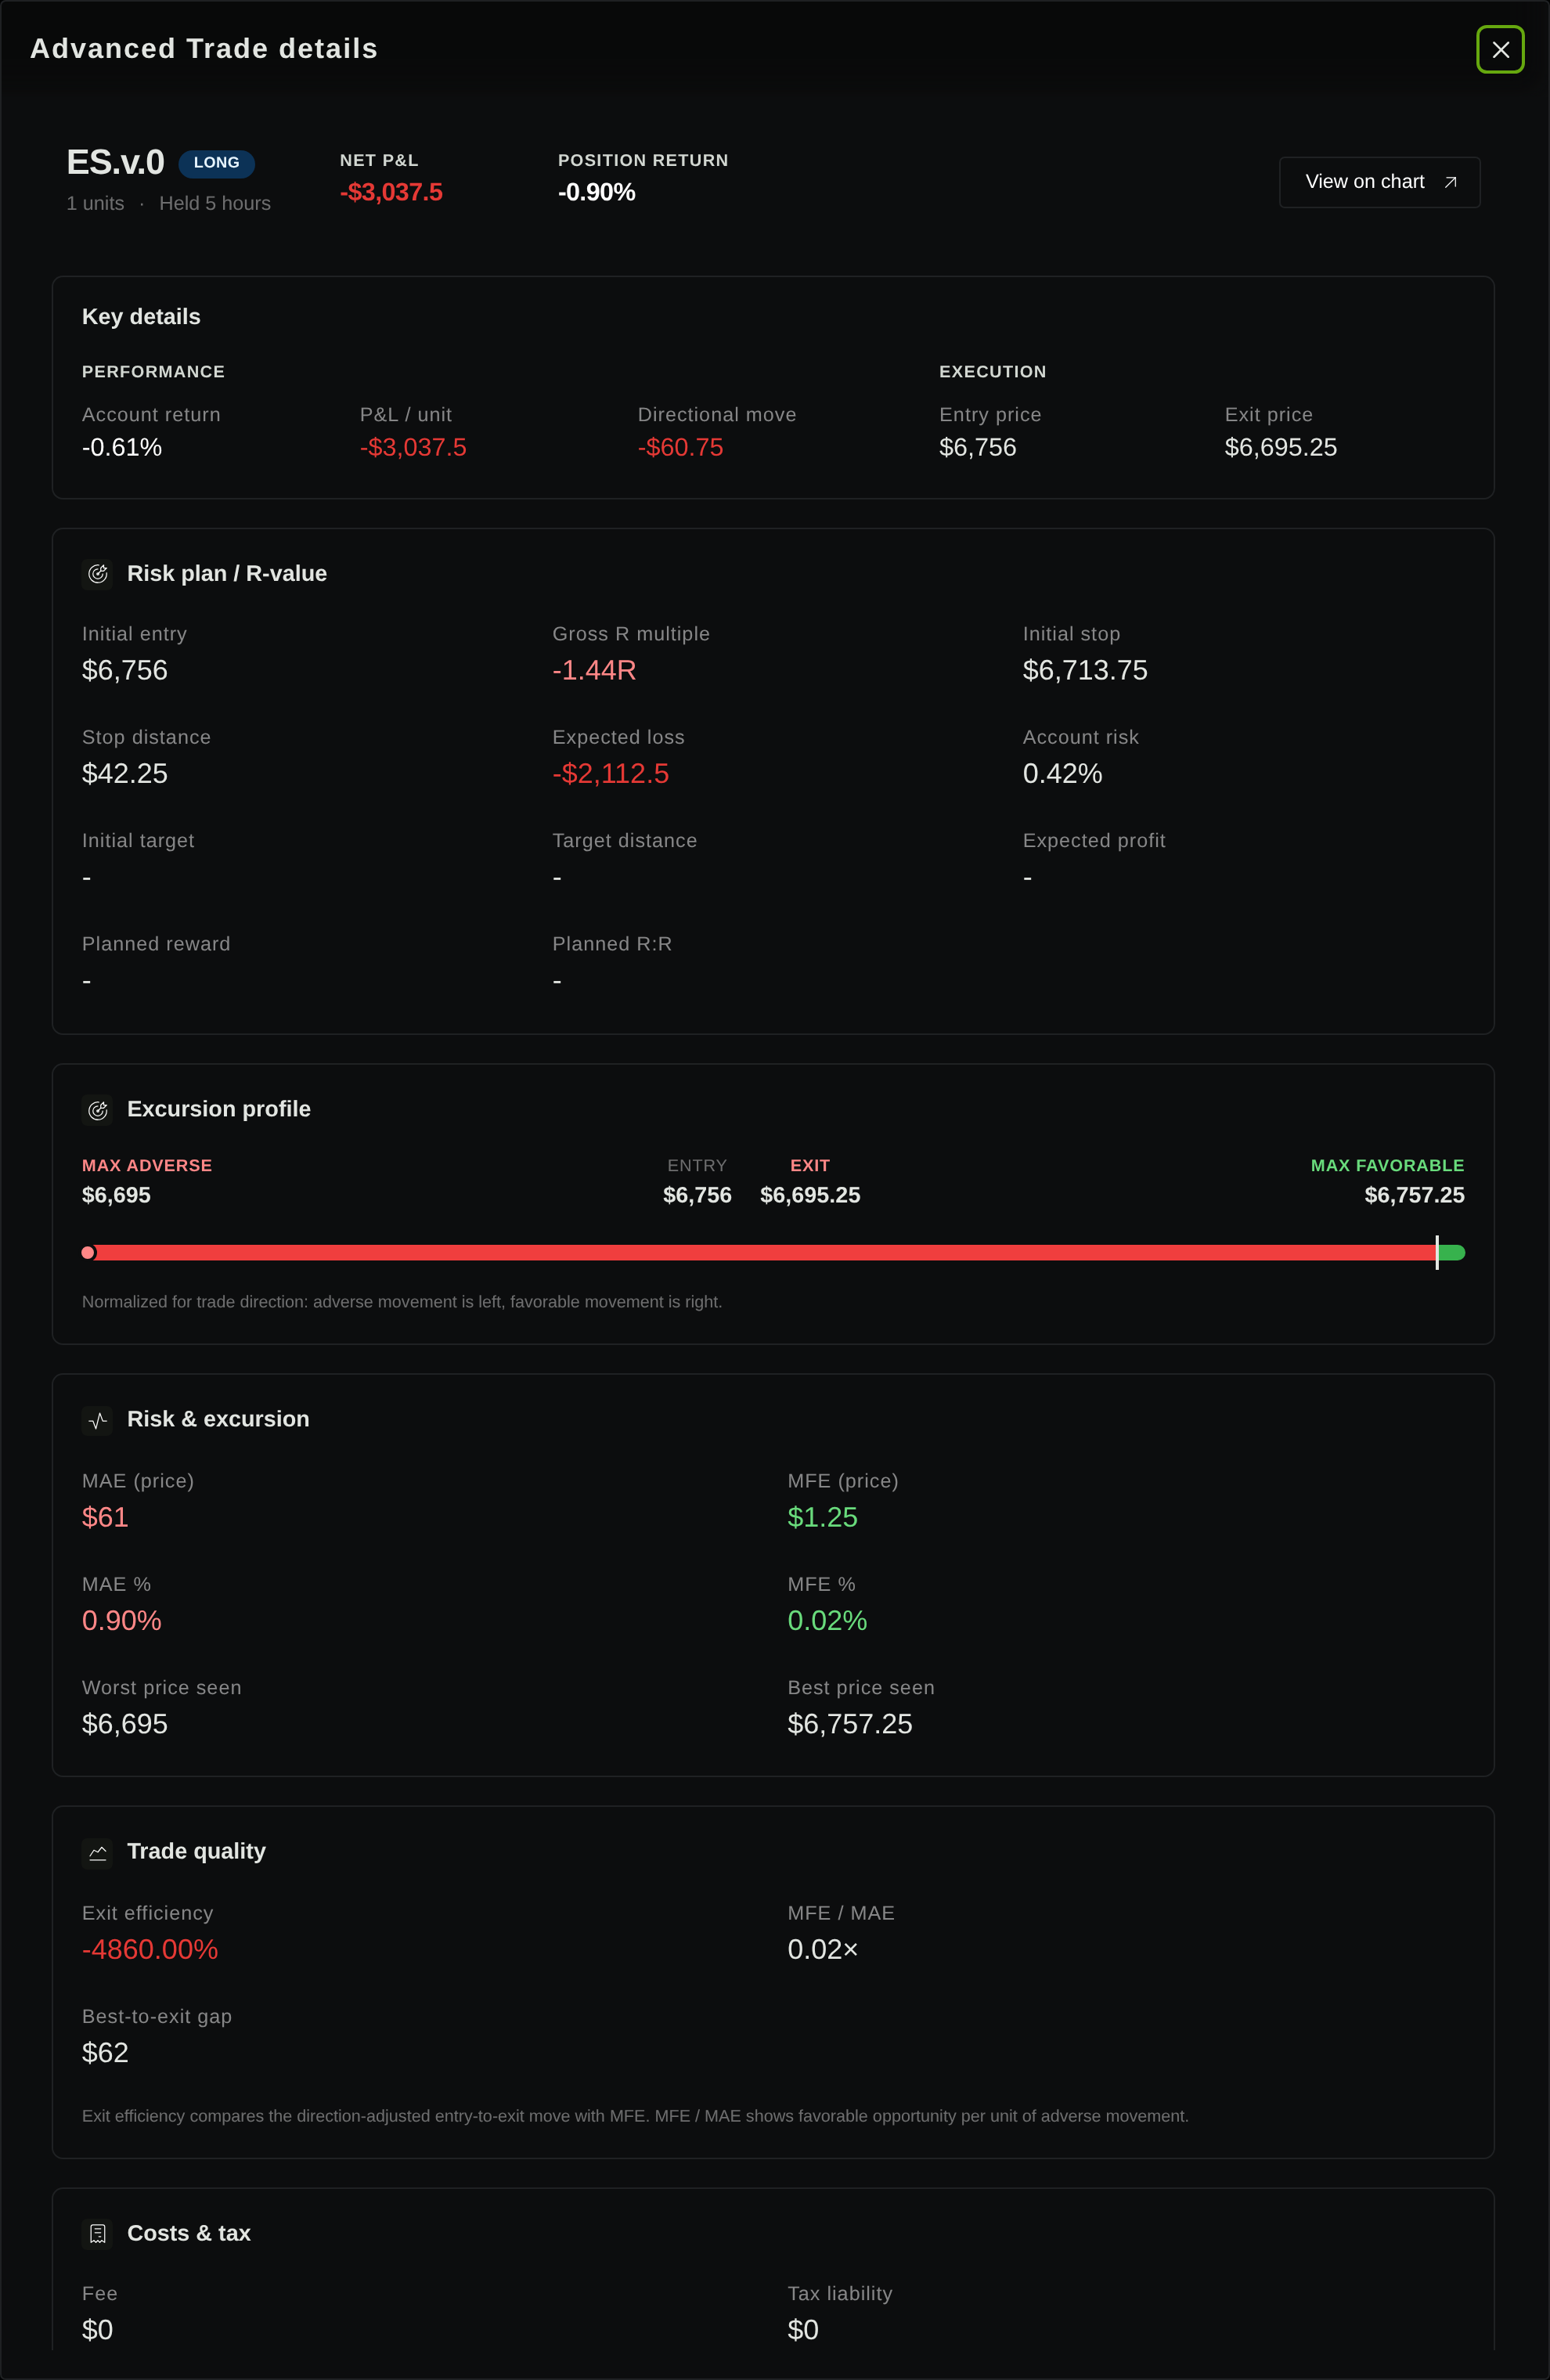
A dedicated demo run selected FUT:CME:ES.v.0 for March 5–20, 2026, with hourly bars, EMA(20)/EMA(50) rules, one contract, and $500,000 initial capital. The saved configuration and completed report below are real product captures. They demonstrate a continuous-series backtest, without establishing an executable contract roll.
Product search also returns FUT:CME:ES.c.0. Read-only bar requests for March 5–20 returned 11 daily observations for each of the volume and calendar series; their histories differed. For each series, requesting raw and adjusted prices returned identical observations in this window. This narrow observation does not establish the provider’s full adjustment policy. A request for outright FUT:CME:ESH26 returned no bars.
The volume series has a material data anomaly: one daily observation has prices near 51 while neighboring ES observations are near 6,700; its chart replay also drops near 51. The calendar series at the corresponding observation remains near 6,700. This is an unresolved data-quality discrepancy, not evidence of a legitimate rollover gap. The volume-series return should not be treated as a valid strategy-performance result.
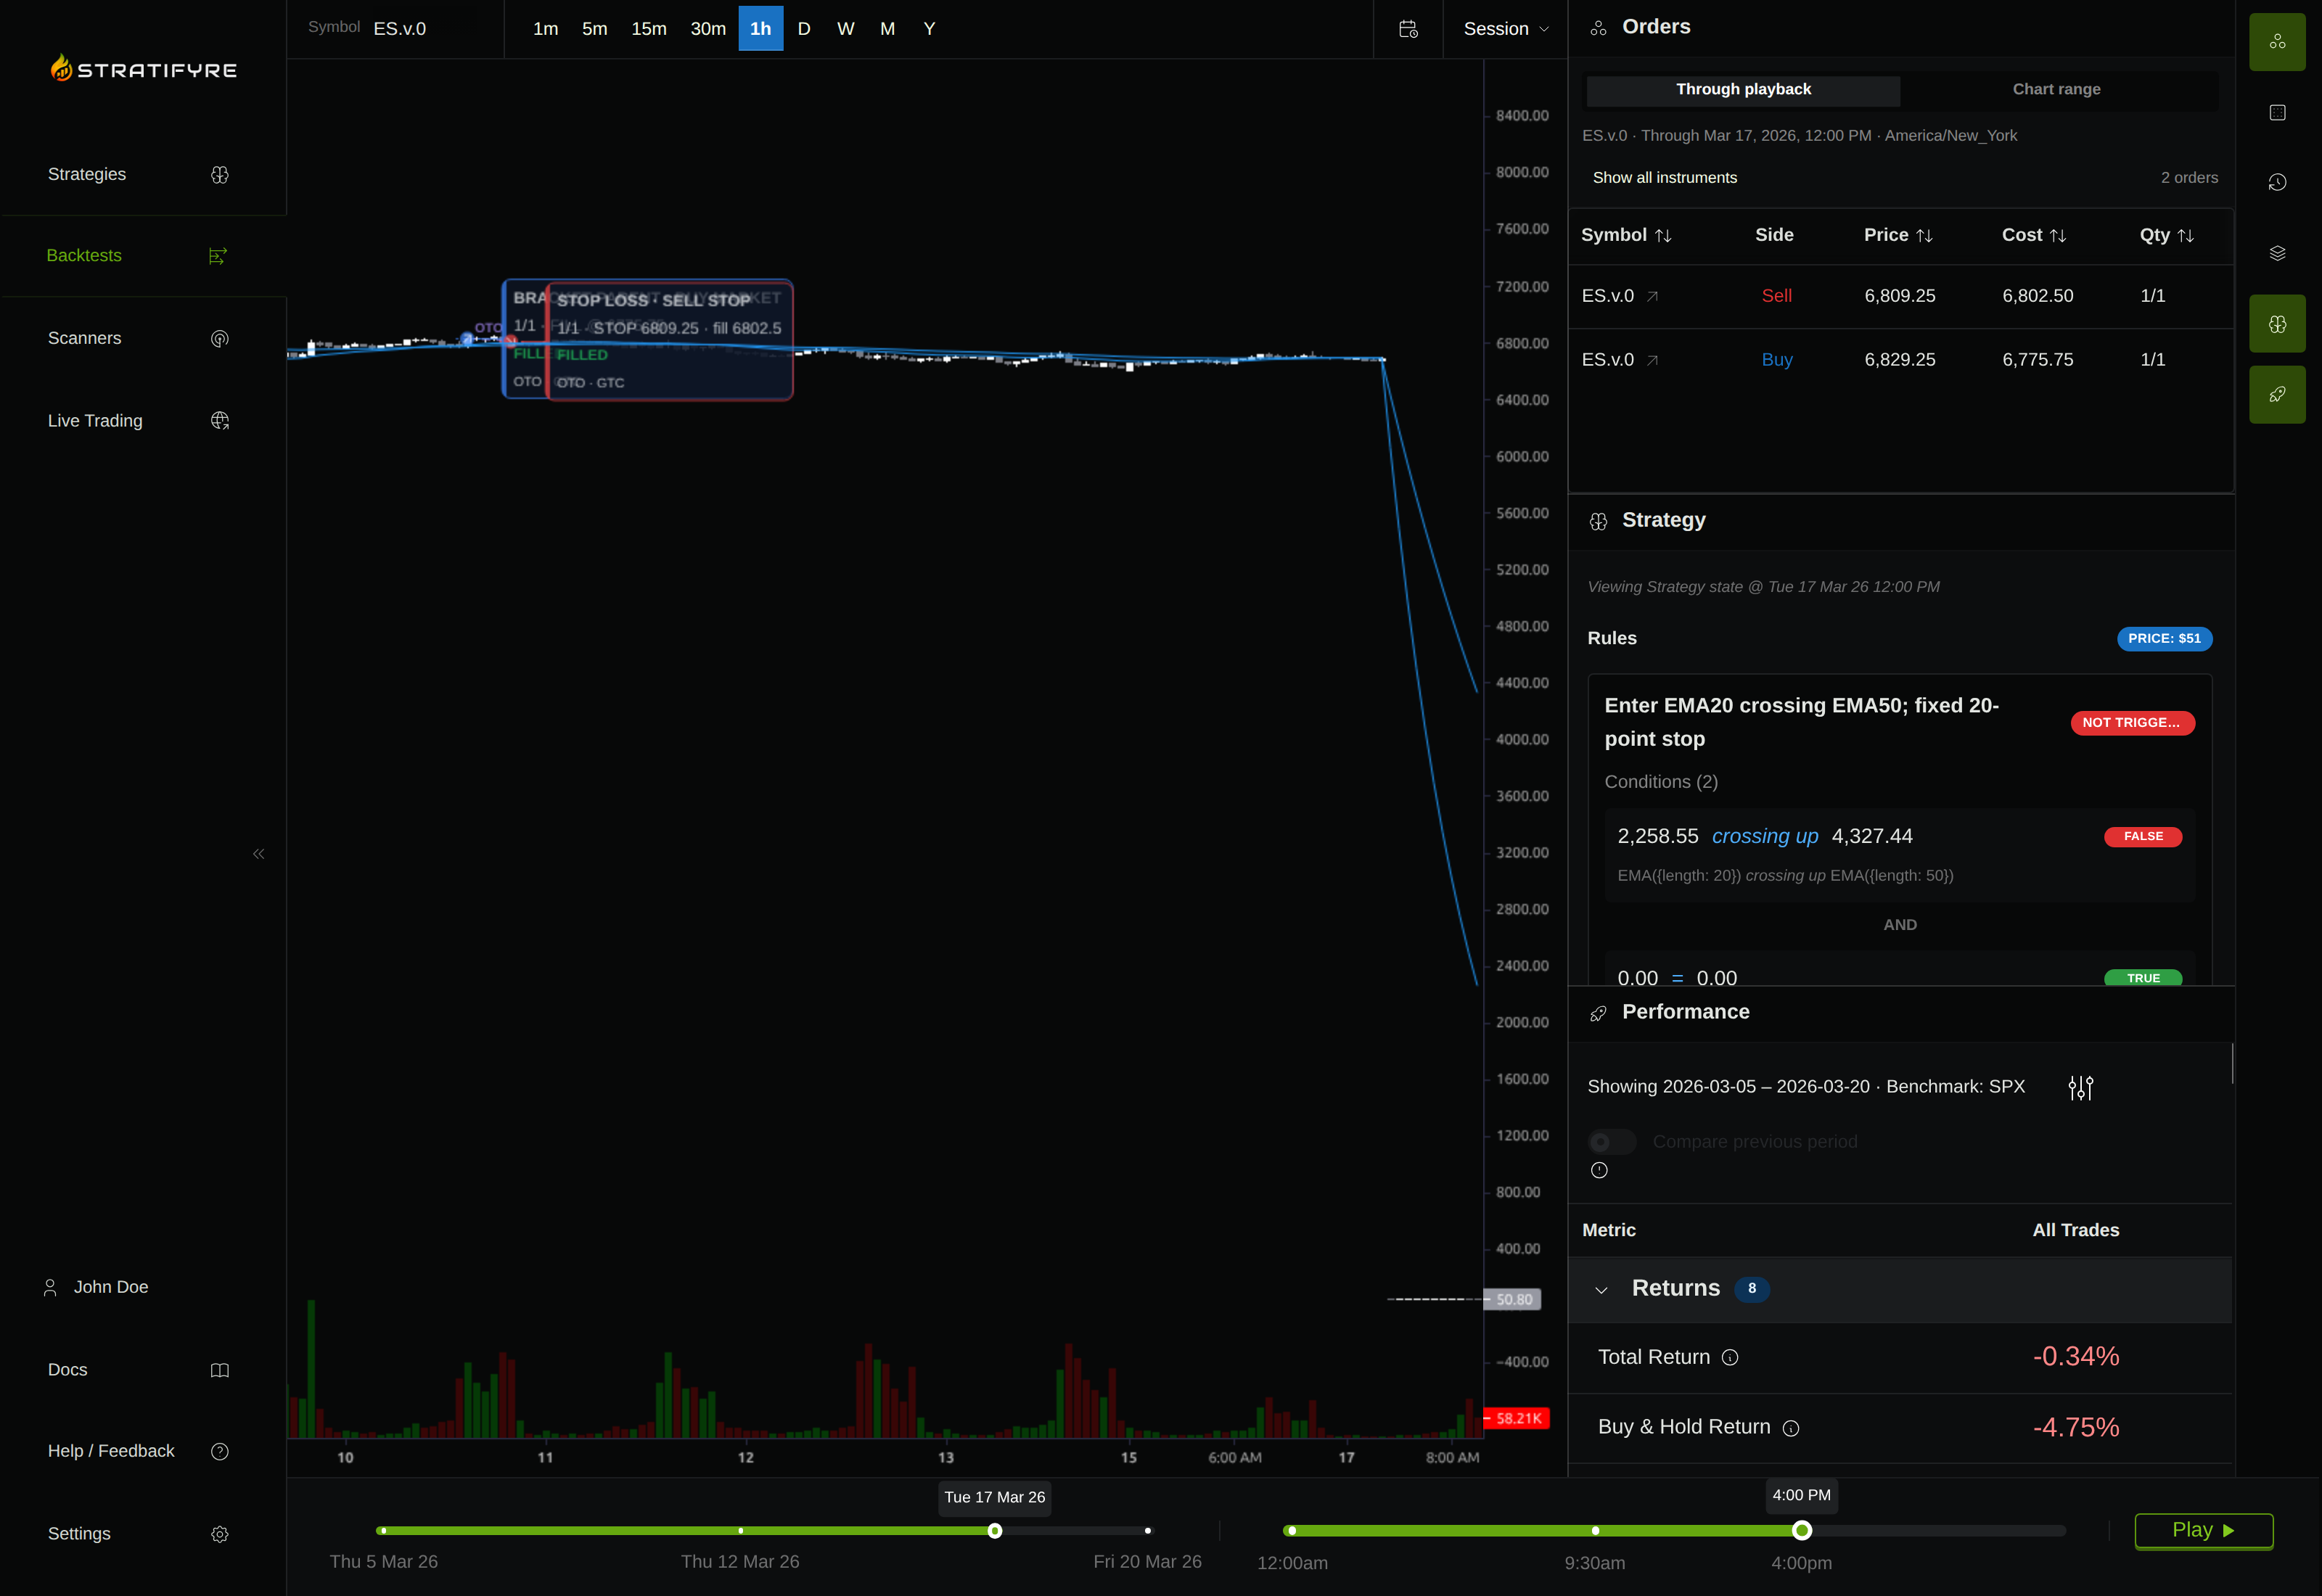
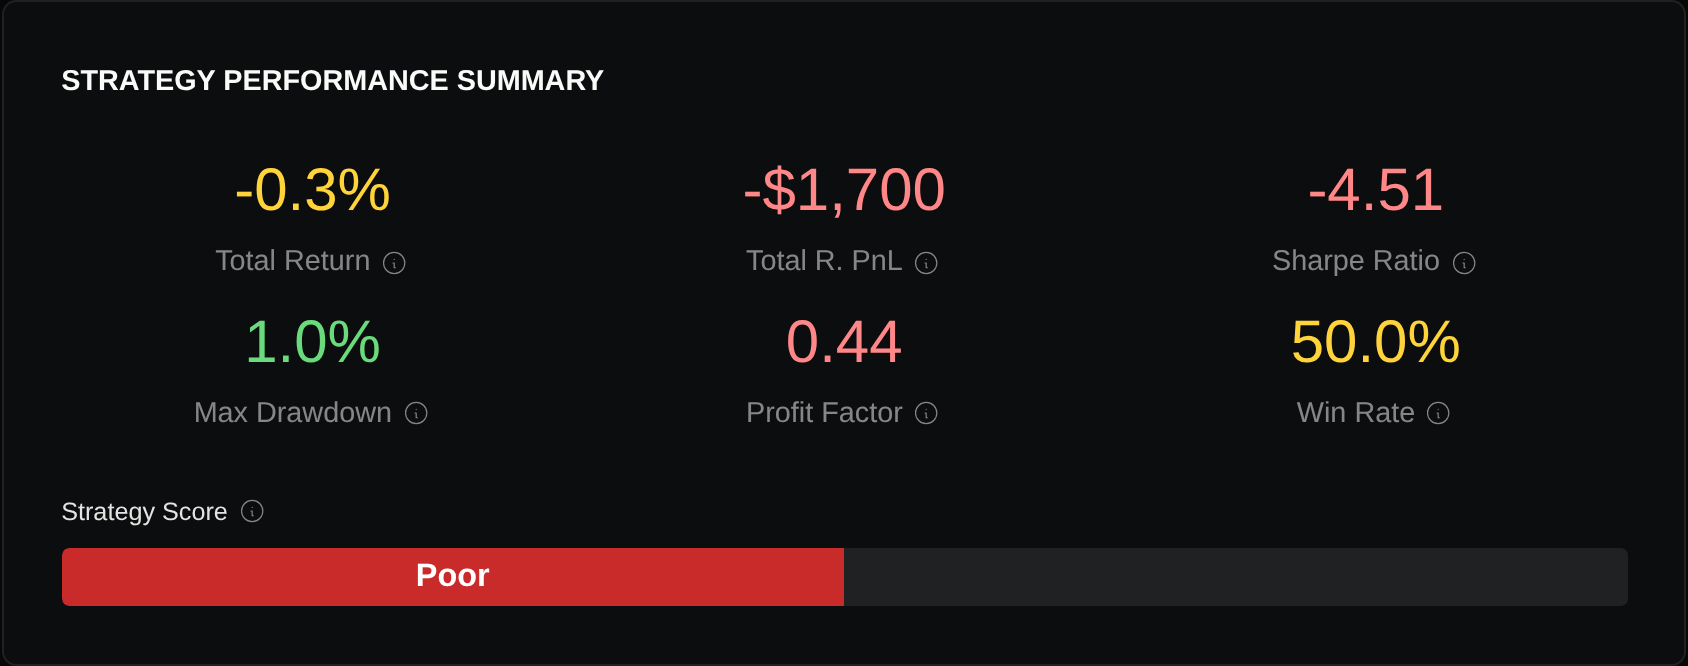
The completed report records two trades and −$1,700 P&L. Both trade instruments remain FUT:CME:ES.v.0; the returned ledger does not identify an old-contract exit and a new-contract entry as a roll pair. Fees are zero despite the saved futures fee setting. Those omissions prevent a reconciled claim about rollover execution or costs.
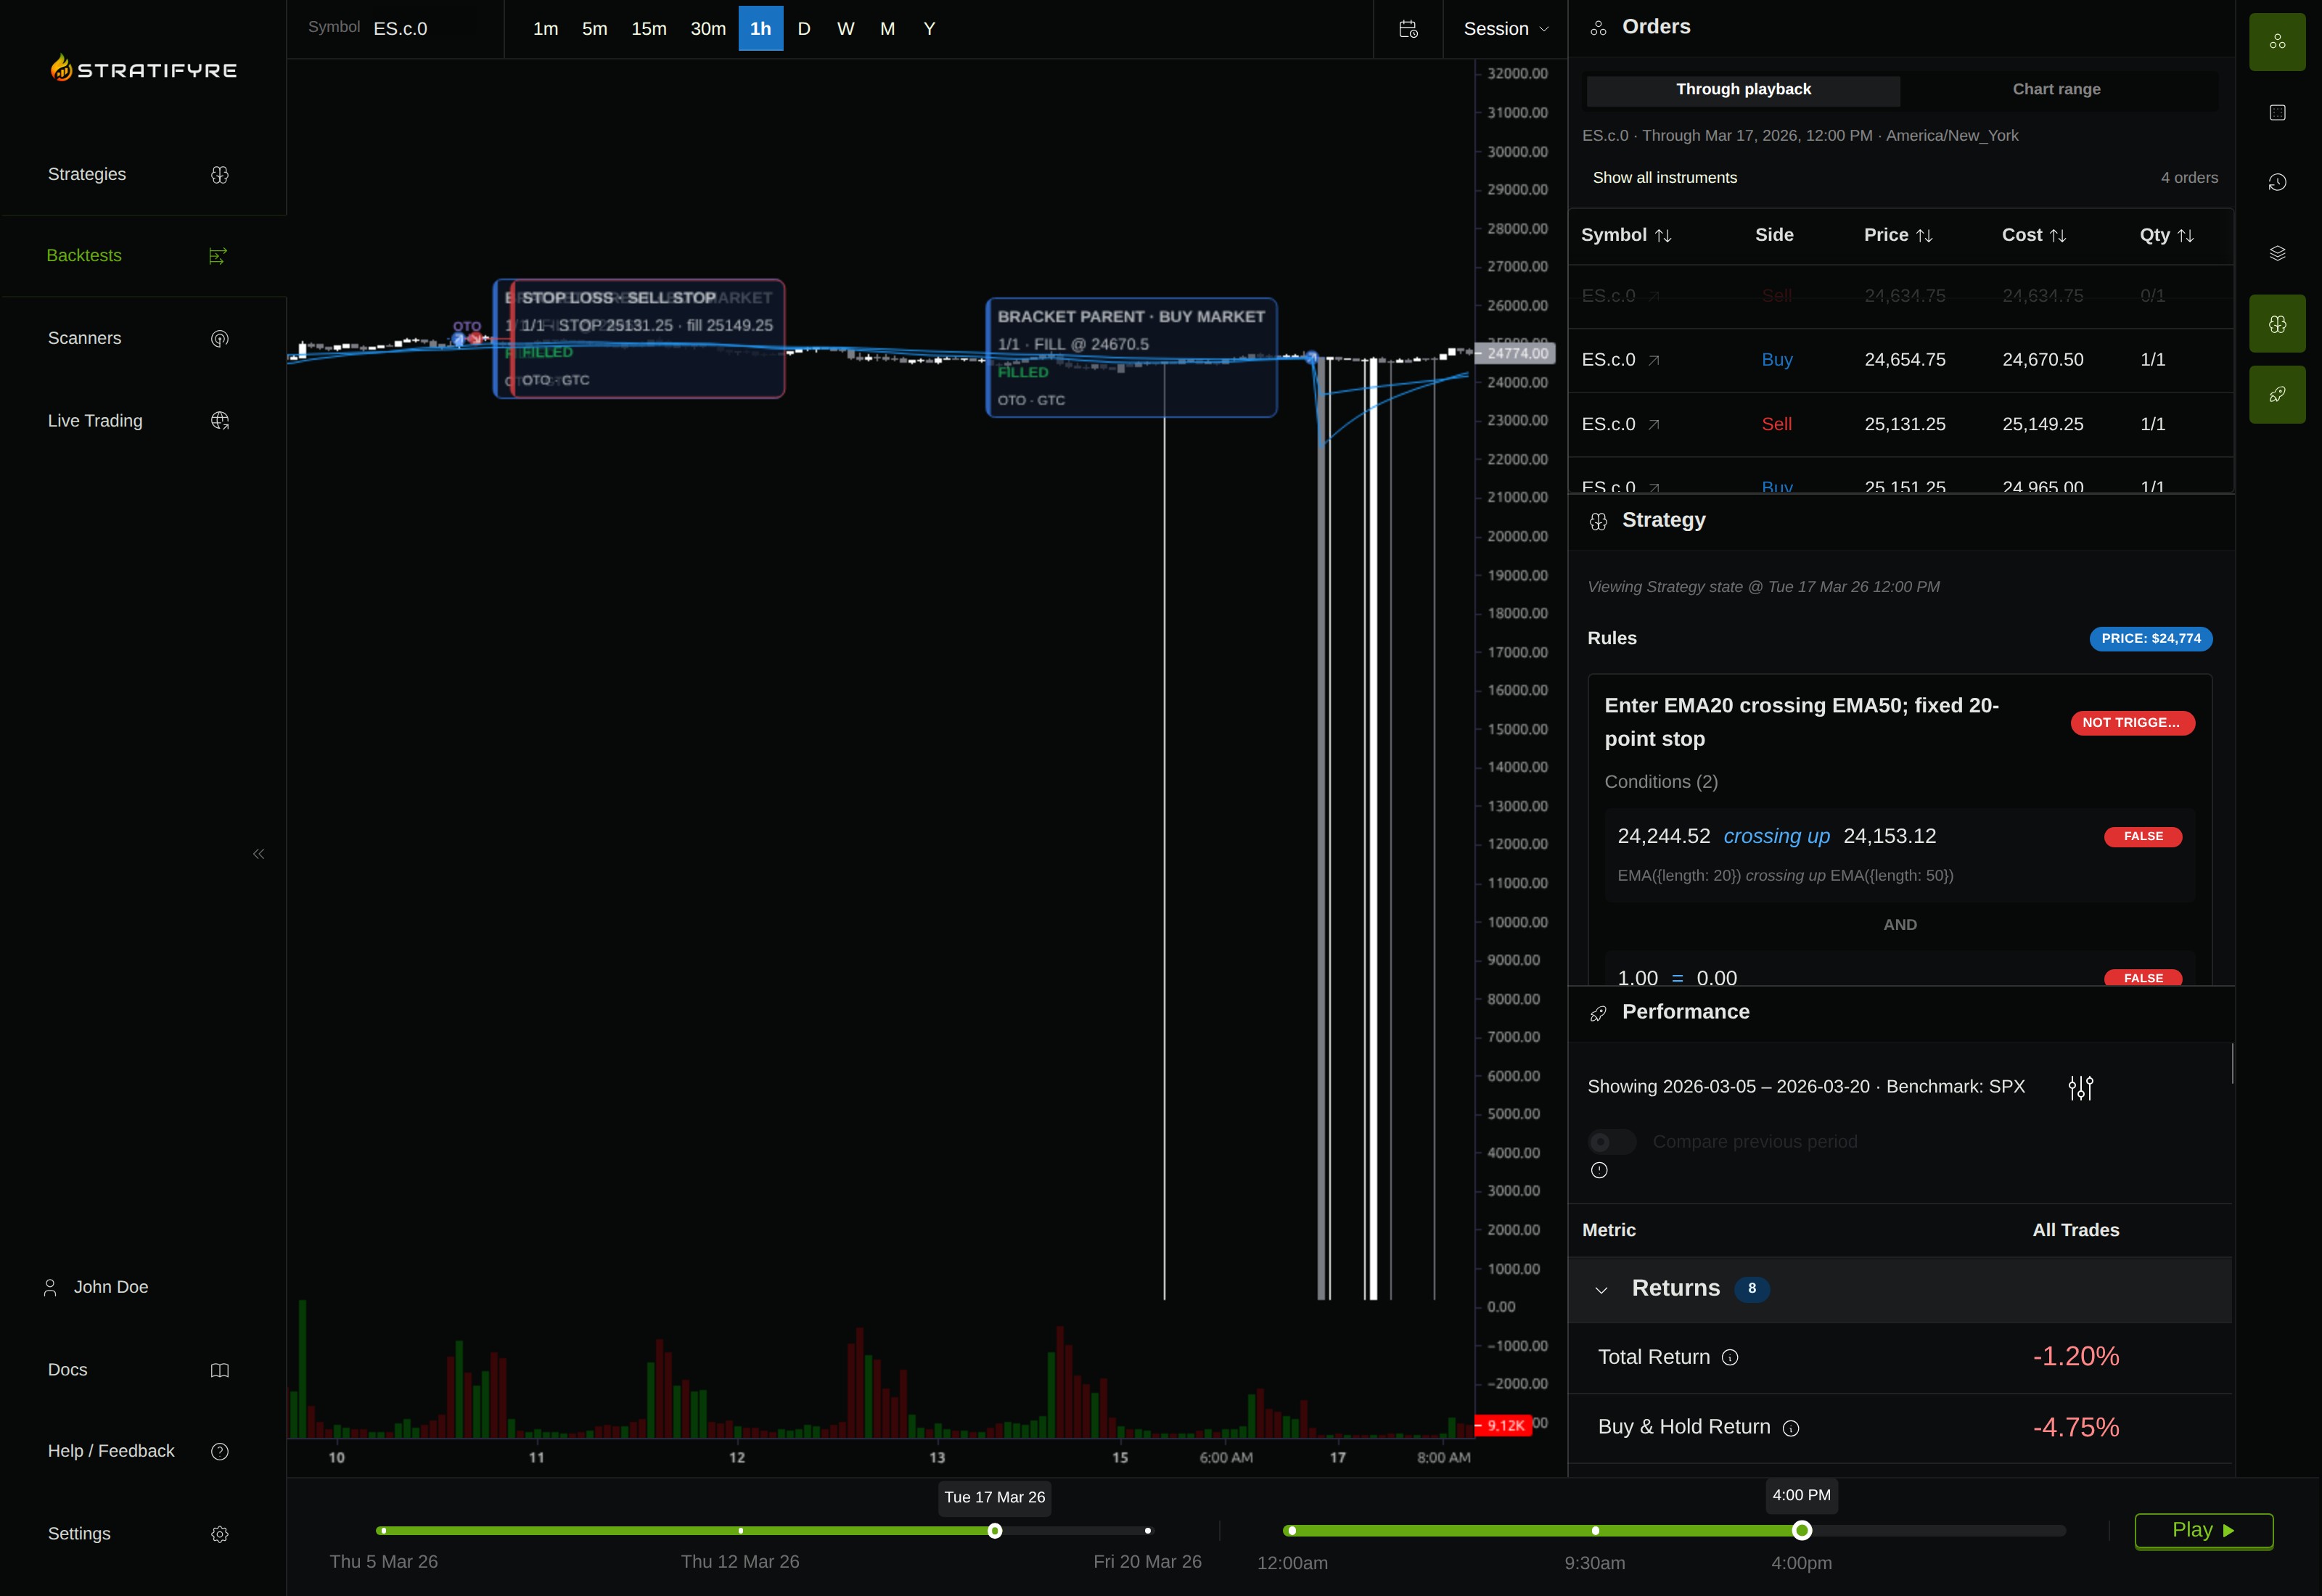
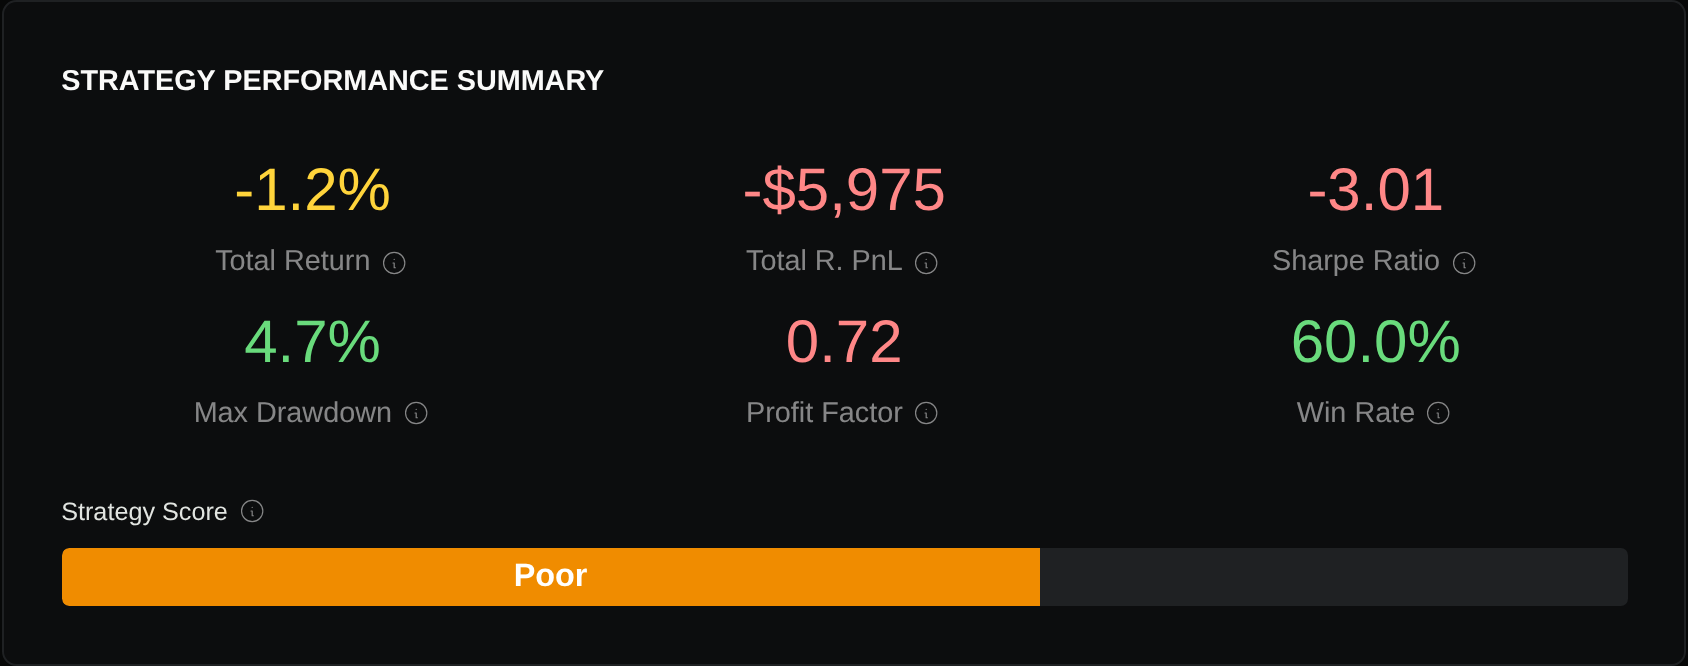
We also executed FUT:CME:ES.c.0 with the same saved rules, interval, dates, capital, and cost settings. Its report contains five trades with −$5,975 P&L, but its hourly replay displays prices near 24,774 while the calendar-series daily bars for this window remain near 6,700. This additional discrepancy prevents treating the calendar run as a validated alternative. Neither result difference can be attributed to a verified roll schedule.
Your multi-year futures checklist
Save a short specification with every run: series/provider/version, roll rule and cutoff, raw or adjusted signal prices, actual execution contracts, bar interval and sessions, warmup, quantity and multiplier, and per-fill cost assumptions. State whether positions close before a roll or continue through an explicit two-leg transaction.
Compare roll policies only after fixing the strategy, date window, sizing, and costs. Inspect switch-adjacent trades as well as the total return: a changed result could come from different signals, different contract exposure, or a missing transaction. Favor an explainable ledger over a visually smooth curve.
Use this checklist with Stratifyre’s backtesting overview to check the contract and series assumptions behind your next futures test.
Put your strategy rules to the test
Build your strategy, inspect historical trades, and review the assumptions behind your results.
Build and test your strategy