NQ vs MNQ backtests: points, ticks, and dollar risk
Convert Nasdaq futures stops into dollars, compare equal contract counts with matched stop risk, and account for rounding and costs.
A 20-point stop looks identical on an NQ chart and an MNQ chart. For one contract, its planned dollar loss is $400 on NQ and $40 on MNQ, before costs. Copying a strategy’s rules while leaving quantity at one changes the amount at stake.
That is the first question an NQ versus MNQ backtest should answer: are you comparing the same contract count, the same planned stop risk, or the same cost-inclusive budget? Those comparisons serve different purposes.
The sizing examples below are hypothetical calculations using CME contract specifications. A separate recorded product comparison shows real NQ and MNQ fills, with unresolved stop and fee evidence called out explicitly.
Start with points, ticks, and dollars
For outright futures, CME specifies a $20-per-index-point multiplier for NQ and $2 per point for MNQ. Both have a minimum price increment of 0.25 index points. These are futures specifications; options and calendar spreads have their own increments. Sources: CME NQ specifications, CME MNQ specifications.
| Per contract | NQ | MNQ |
|---|---|---|
| Dollar value of one index point | $20 | $2 |
| Minimum outright tick | 0.25 points | 0.25 points |
| Dollar value of one tick | $5 | $0.50 |
| Ticks in one index point | 4 | 4 |
Tick value is tick size multiplied by point value: 0.25 × $20 = $5 for NQ. MNQ uses 0.25 × $2 = $0.50.
Keep the units visible when writing rules. A 20-point stop is 80 ticks; a 20-tick stop is only 5 points. On one NQ contract, confusing those inputs changes the pre-cost loss from $400 to $100. On one MNQ contract, it changes $40 to $10.
Convert a stop into planned dollar loss
Use the distance between the entry and stop, rather than the instrument’s headline price:
Stop distance in ticks = stop distance in points / tick sizePlanned stop loss = stop distance in points × point value × contractsFor the hypothetical 20-point stop:
| Calculation | NQ | MNQ |
|---|---|---|
| Stop distance | 80 ticks | 80 ticks |
| Loss for one contract, before costs | $400 | $40 |
| Contracts for $400 of planned stop loss | 1 | 10 |
One NQ and ten MNQ therefore have the same dollar sensitivity to an assumed equal point move. This arithmetic does not establish that their separate markets traded at identical prices, produced the same signals, or offered the same fills.
CME’s position-size lesson connects the stop distance, tick value, and amount budgeted for a trade. The stop defines a planned loss; it does not guarantee the execution price.
Compare equal counts and matched stop risk separately
An equal-count comparison uses one NQ against one MNQ. With the 20-point stop, the pre-cost loss is $400 versus $40. A smaller dollar drawdown in the micro run could reflect smaller exposure. It would not, by itself, show that the entry rules improved.
A matched-stop-risk comparison uses one NQ against ten MNQ. Both begin with $400 of planned loss at that stop, before costs. This makes sizing easier to interpret, but you still need separate instrument histories and execution assumptions.
Changing the multiplier on an NQ trade log can illustrate arithmetic. It cannot establish an MNQ backtest. If indicators use each contract’s own prices, signals may differ. Even with shared signal timestamps, each order needs the appropriate contract’s execution data.
Use the same initial capital in both runs when comparing account returns. Record quantity alongside every result so that a change in contract exposure is visible.
Recorded NQ and MNQ product runs
The demo runs use FUT:CME:NQ.v.0 and FUT:CME:MNQ.v.0, January 5–9, 2026, 15-minute bars, $500,000 initial capital, and the same EMA(20)/EMA(50) entry and exit rules. Quantity is one NQ versus ten MNQ. These are separate volume-continuous histories, rather than verified same-expiry outright contracts.
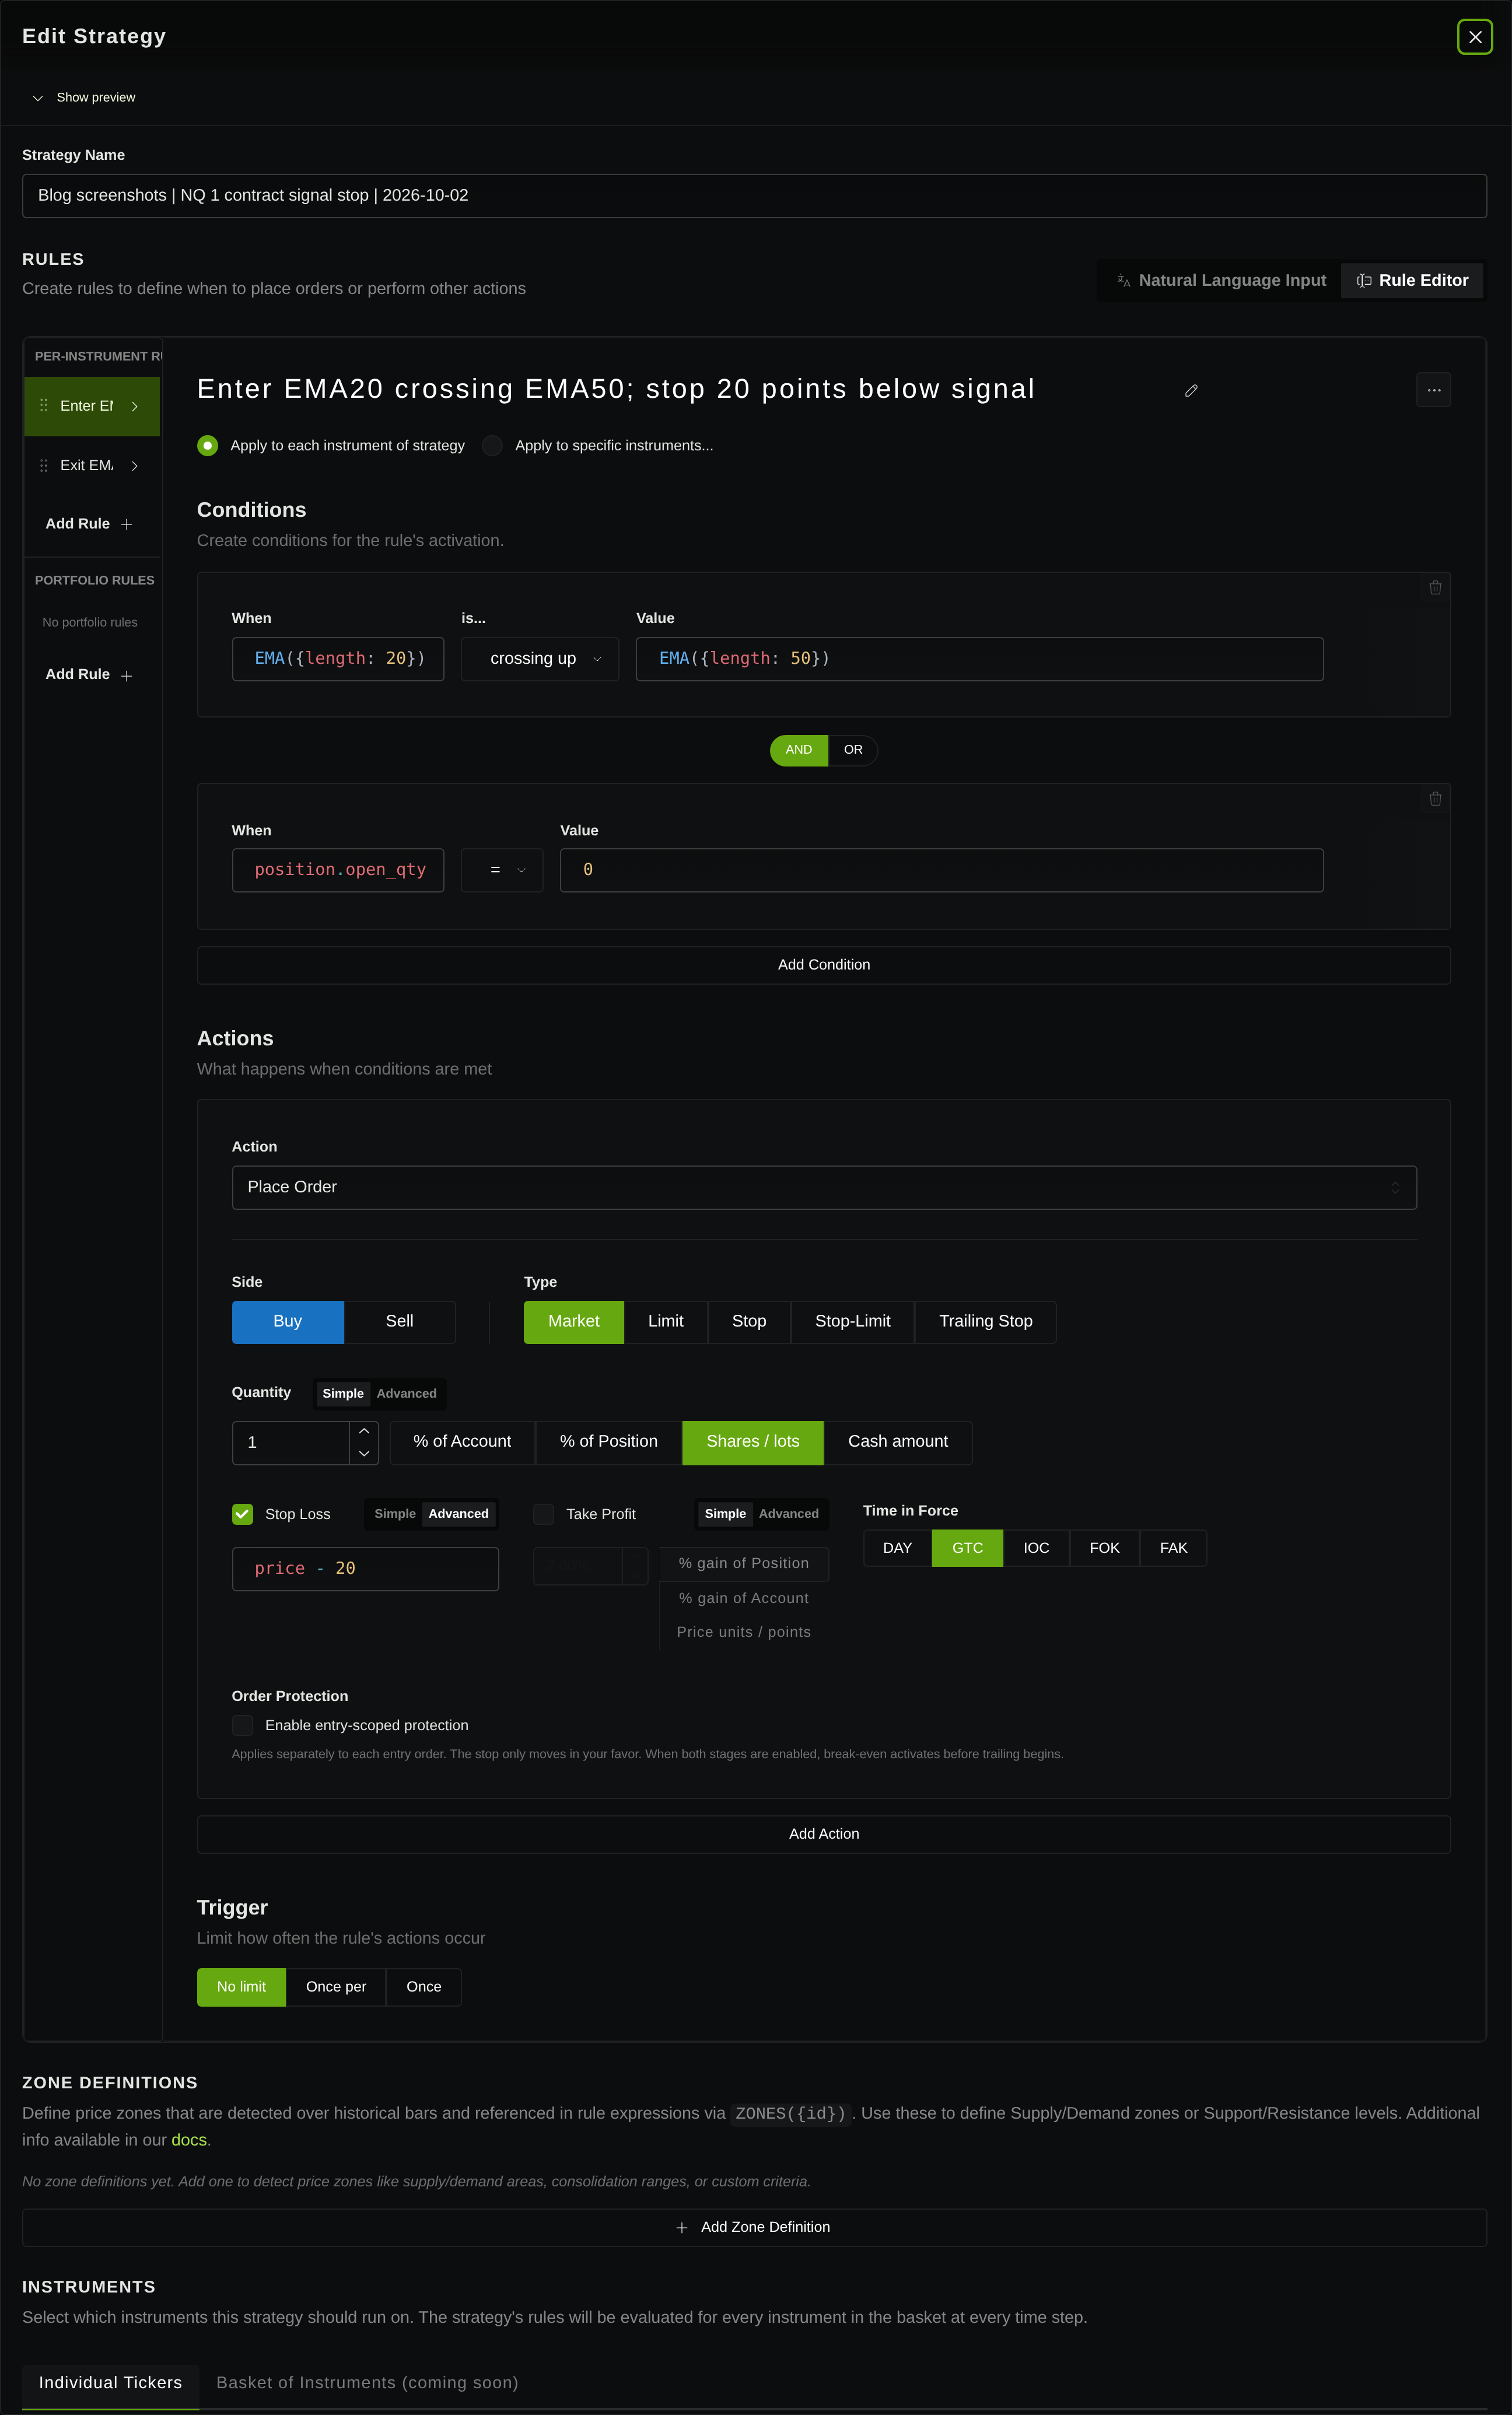
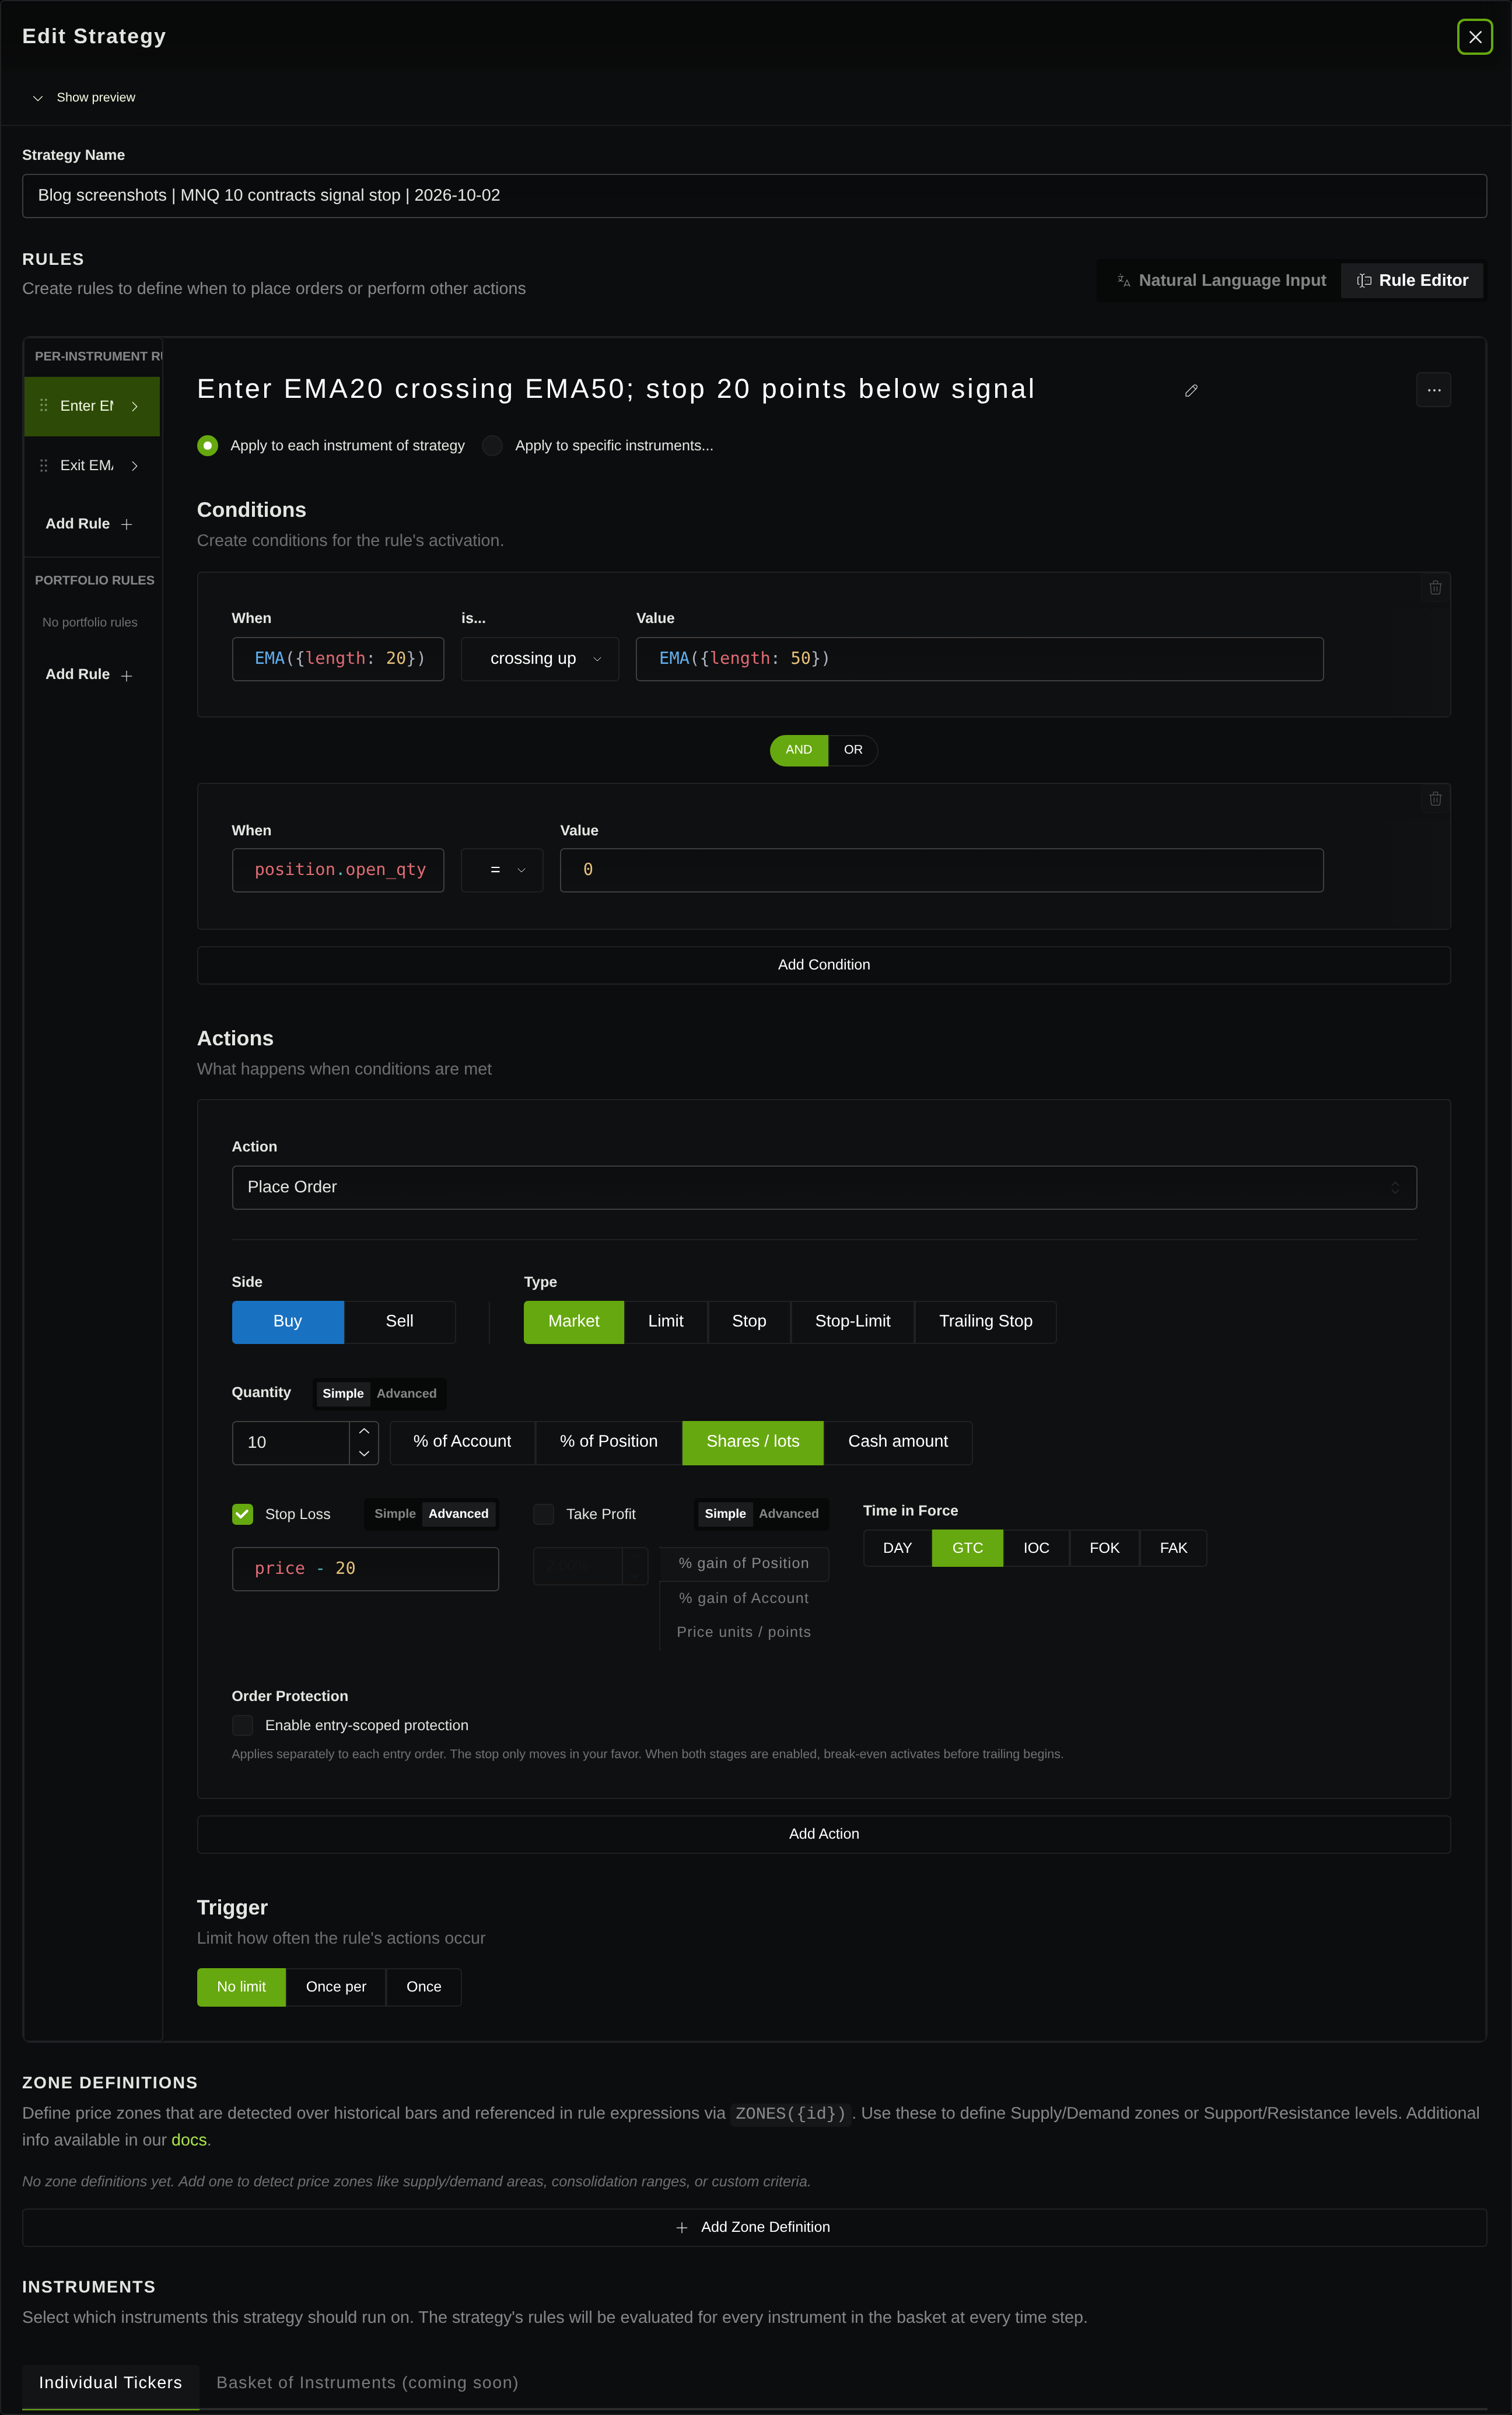
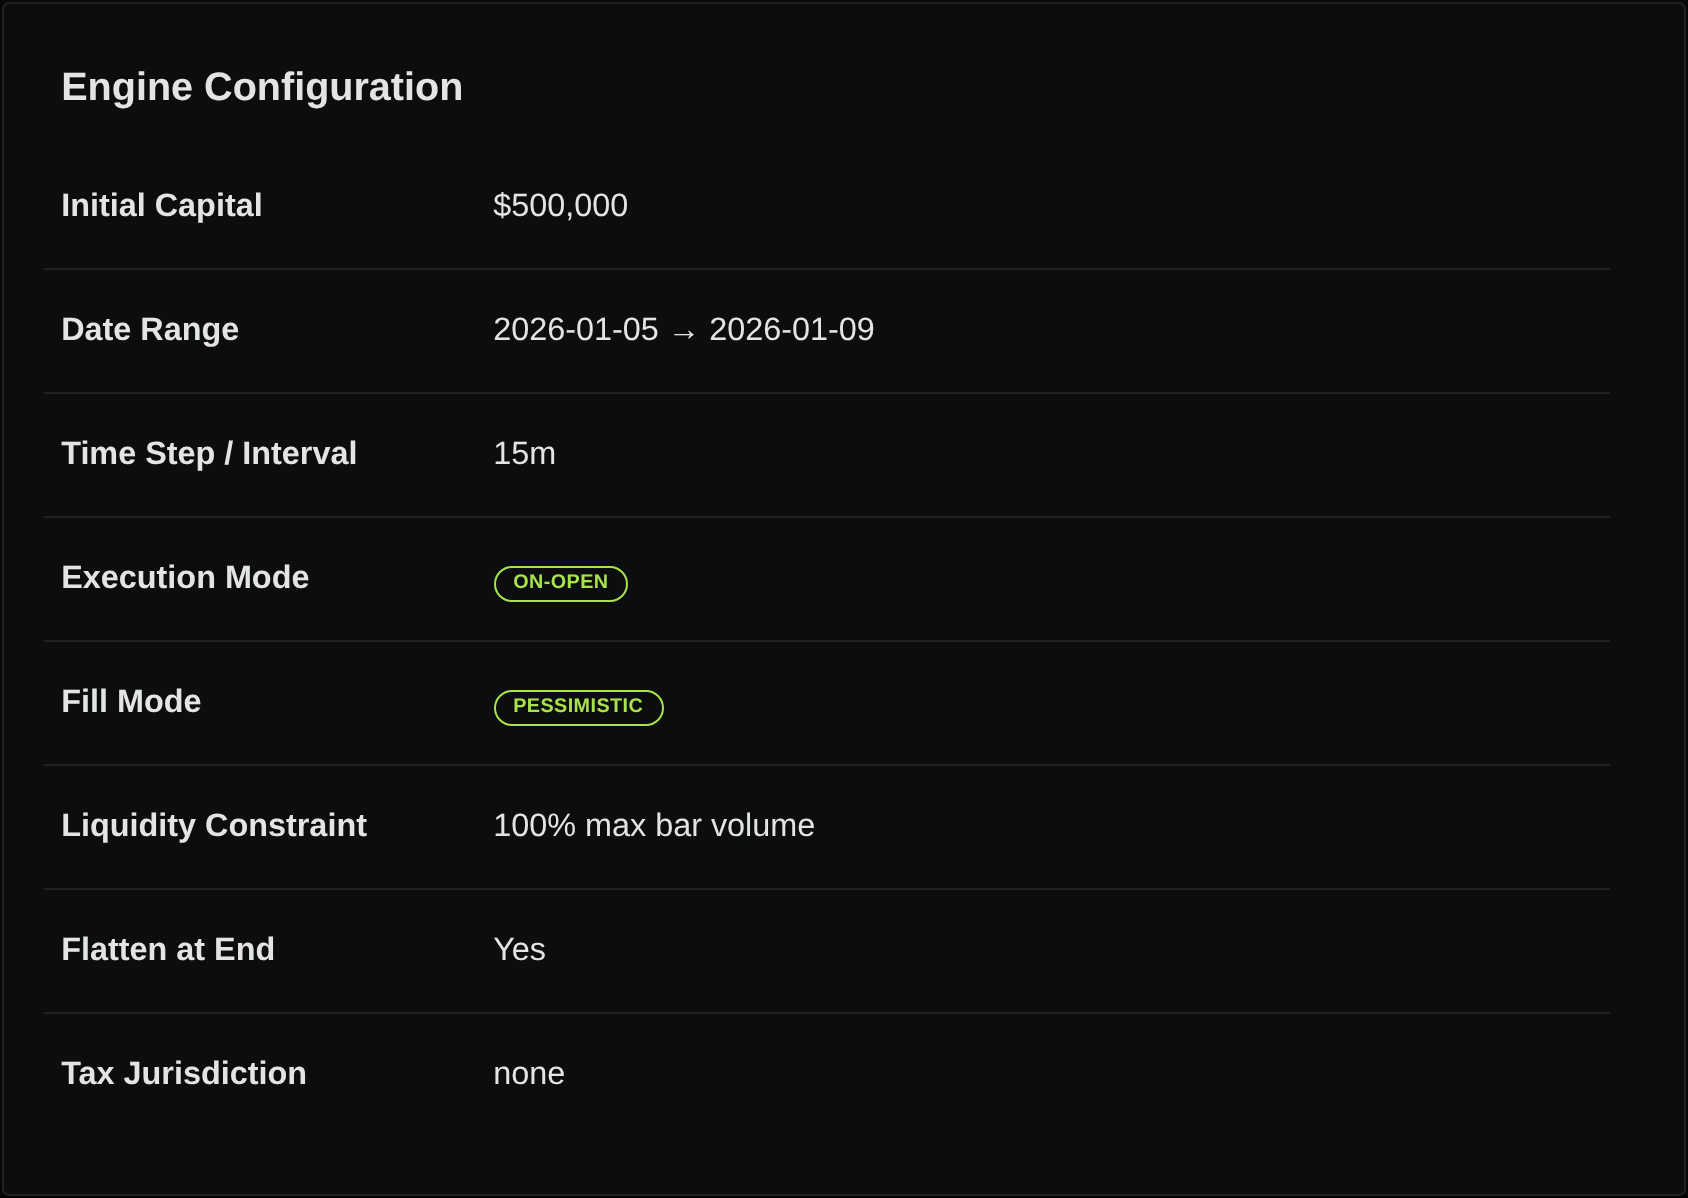
Each run completed one trade with the same entry and exit timestamps. The dollar P&L reconciles to each instrument’s own prices and multiplier:
| Recorded trade | 1 NQ | 10 MNQ |
|---|---|---|
| Entry price | 25,714.25 | 25,714.75 |
| Exit price | 25,733.75 | 25,738.00 |
| Point move | 19.50 | 23.25 |
| Point value × quantity | $20 × 1 | $2 × 10 |
| Reported P&L | $390 | $465 |
| Reported fee | $0 | $0 |
| Recorded initial stop and initial risk | Not recorded | Not recorded |
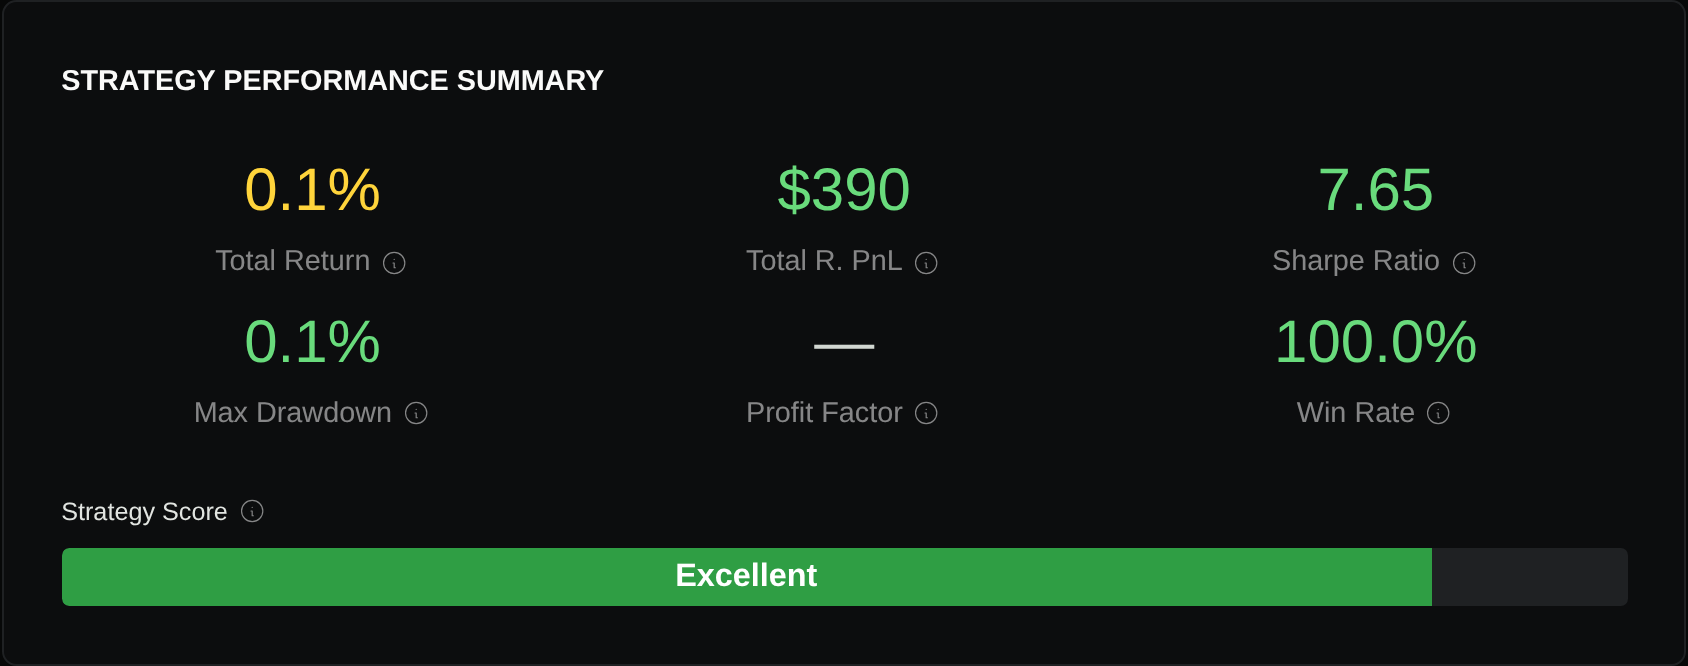
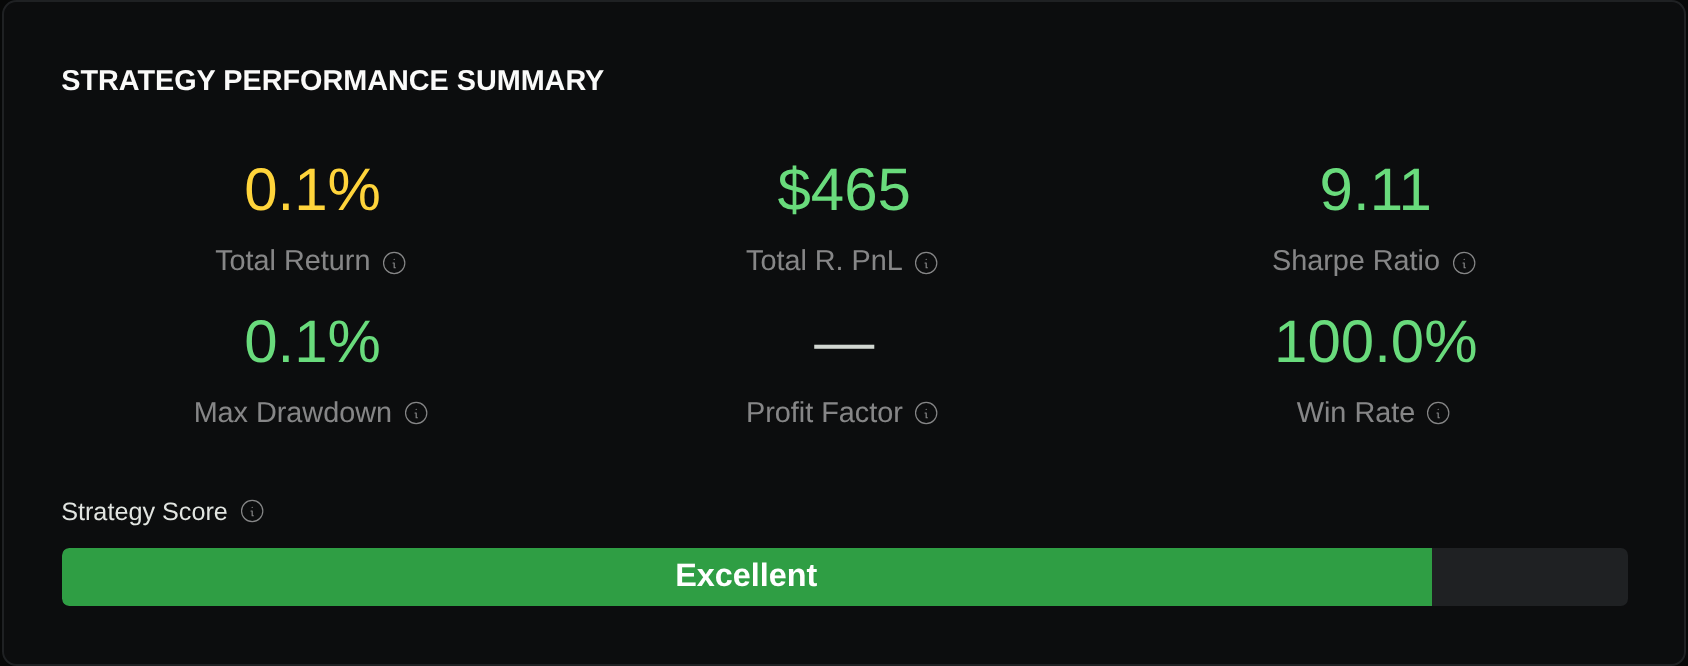
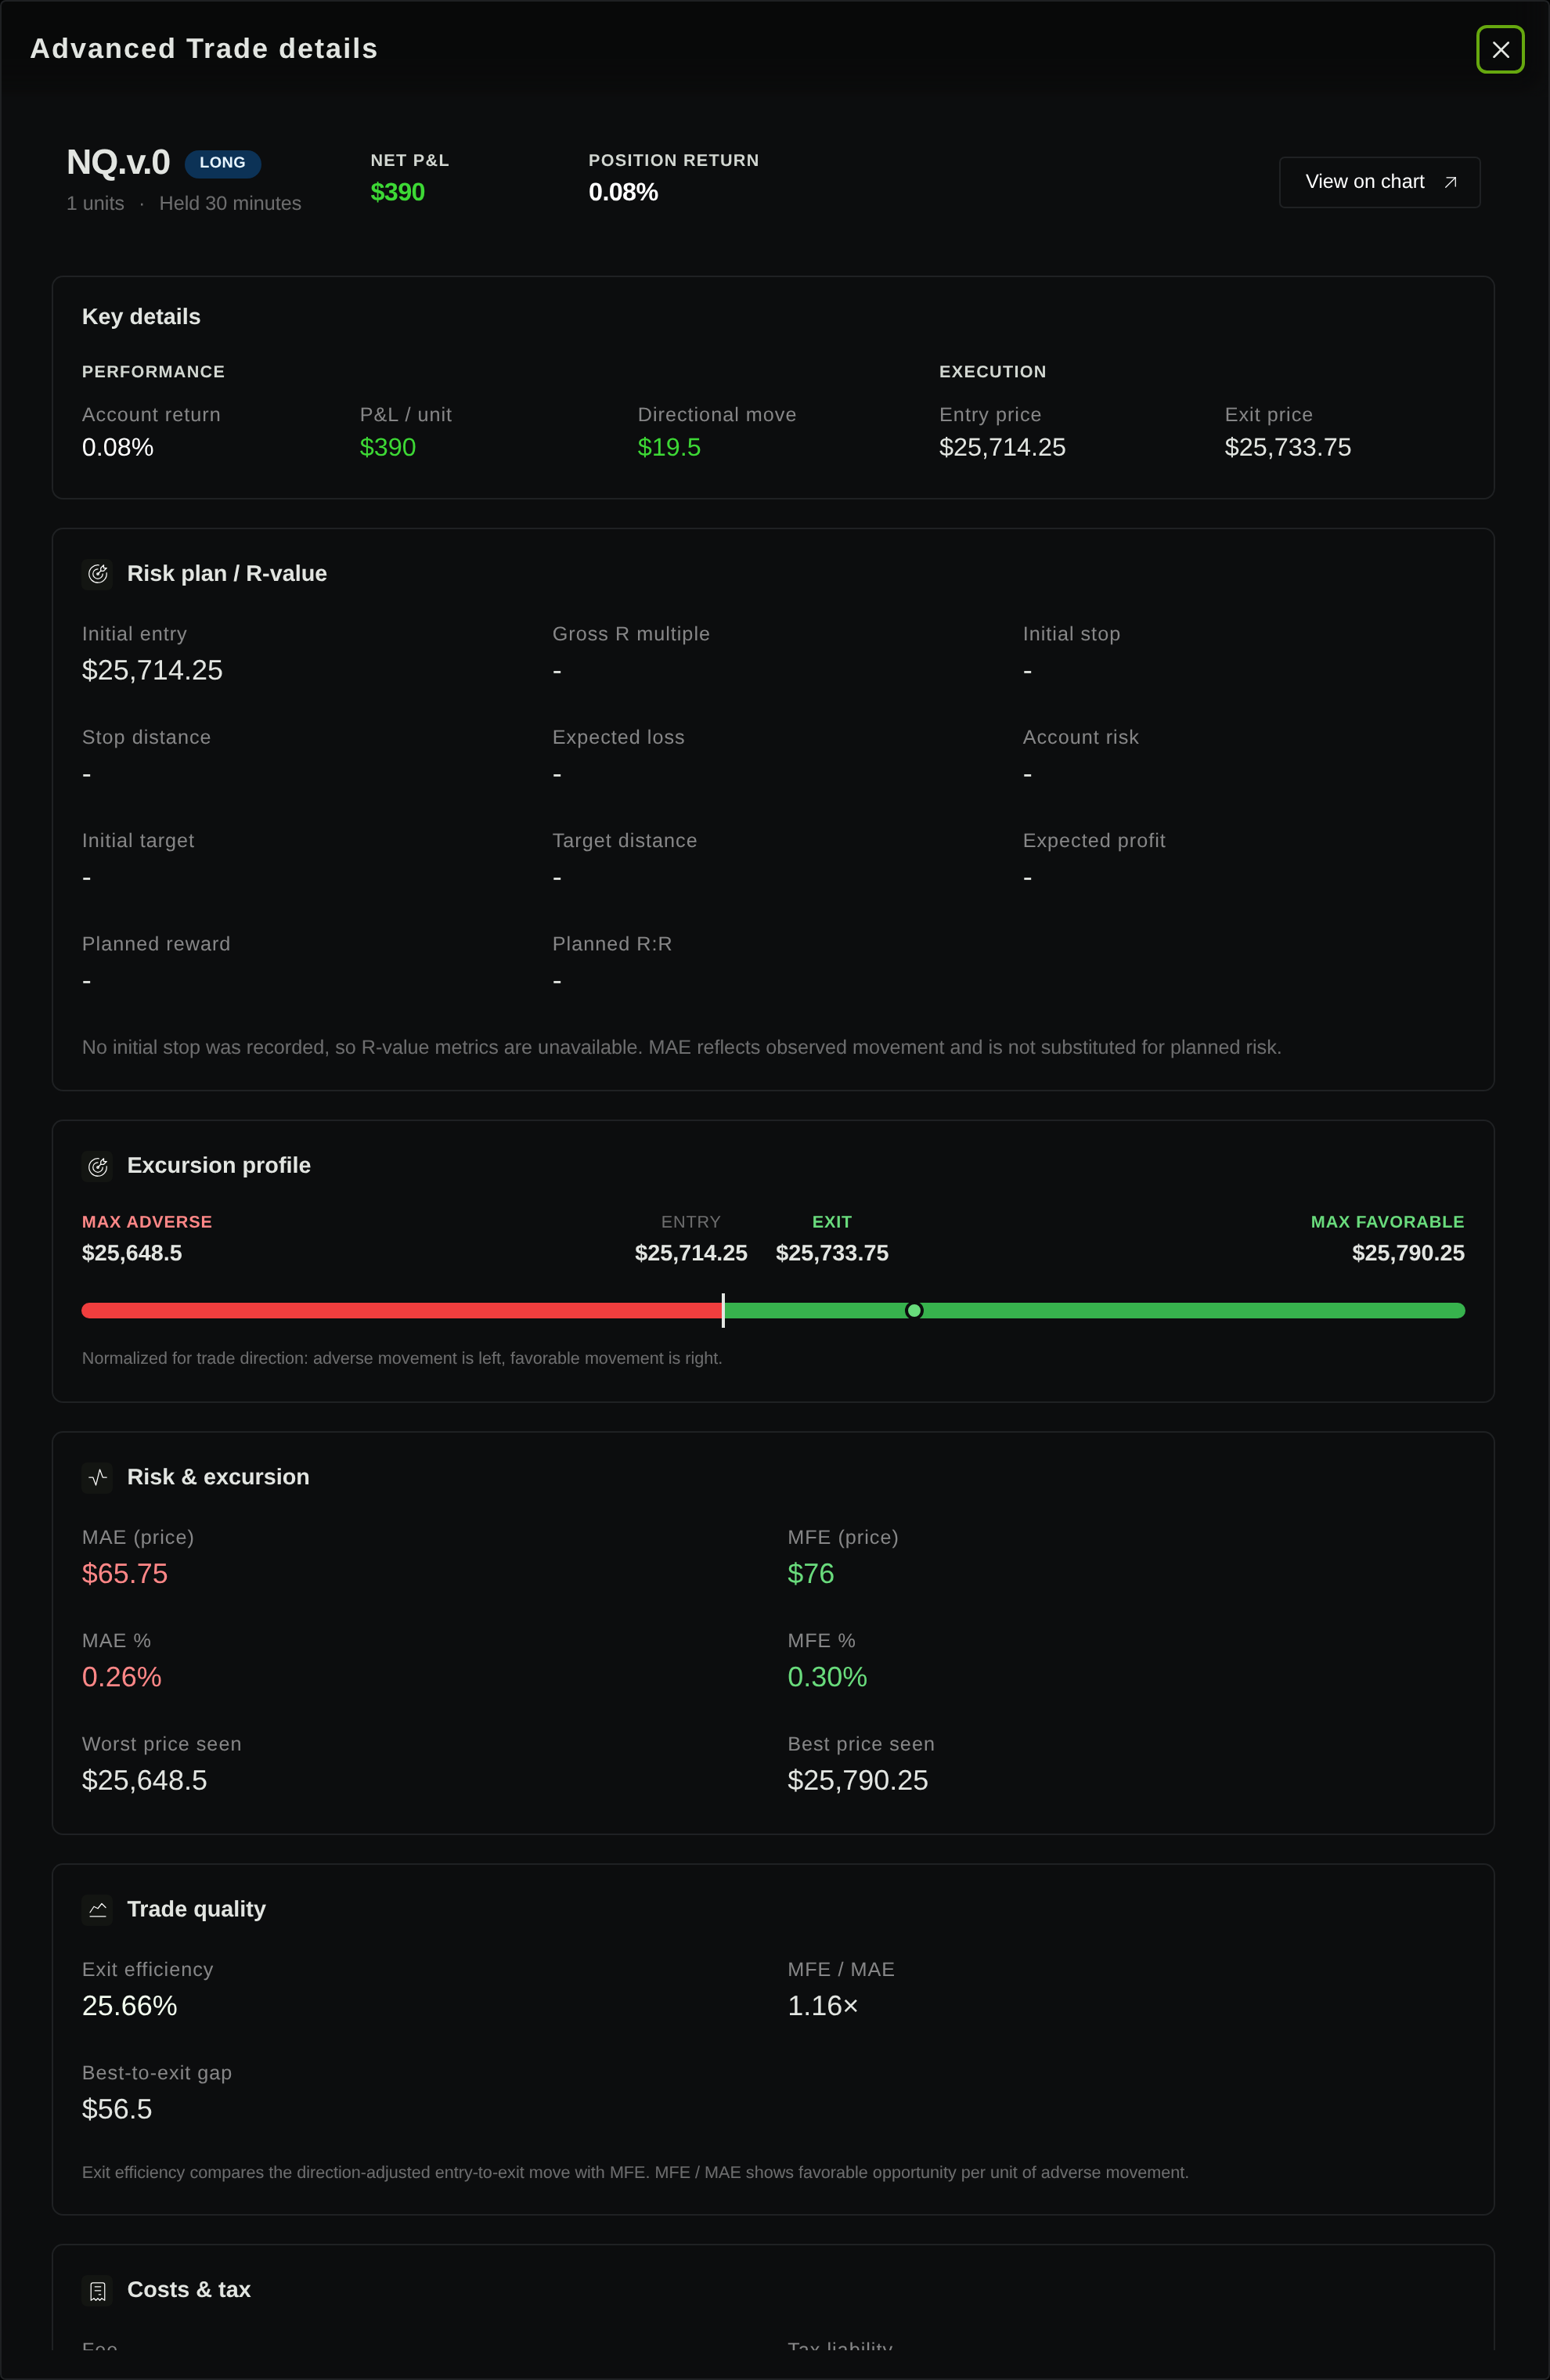
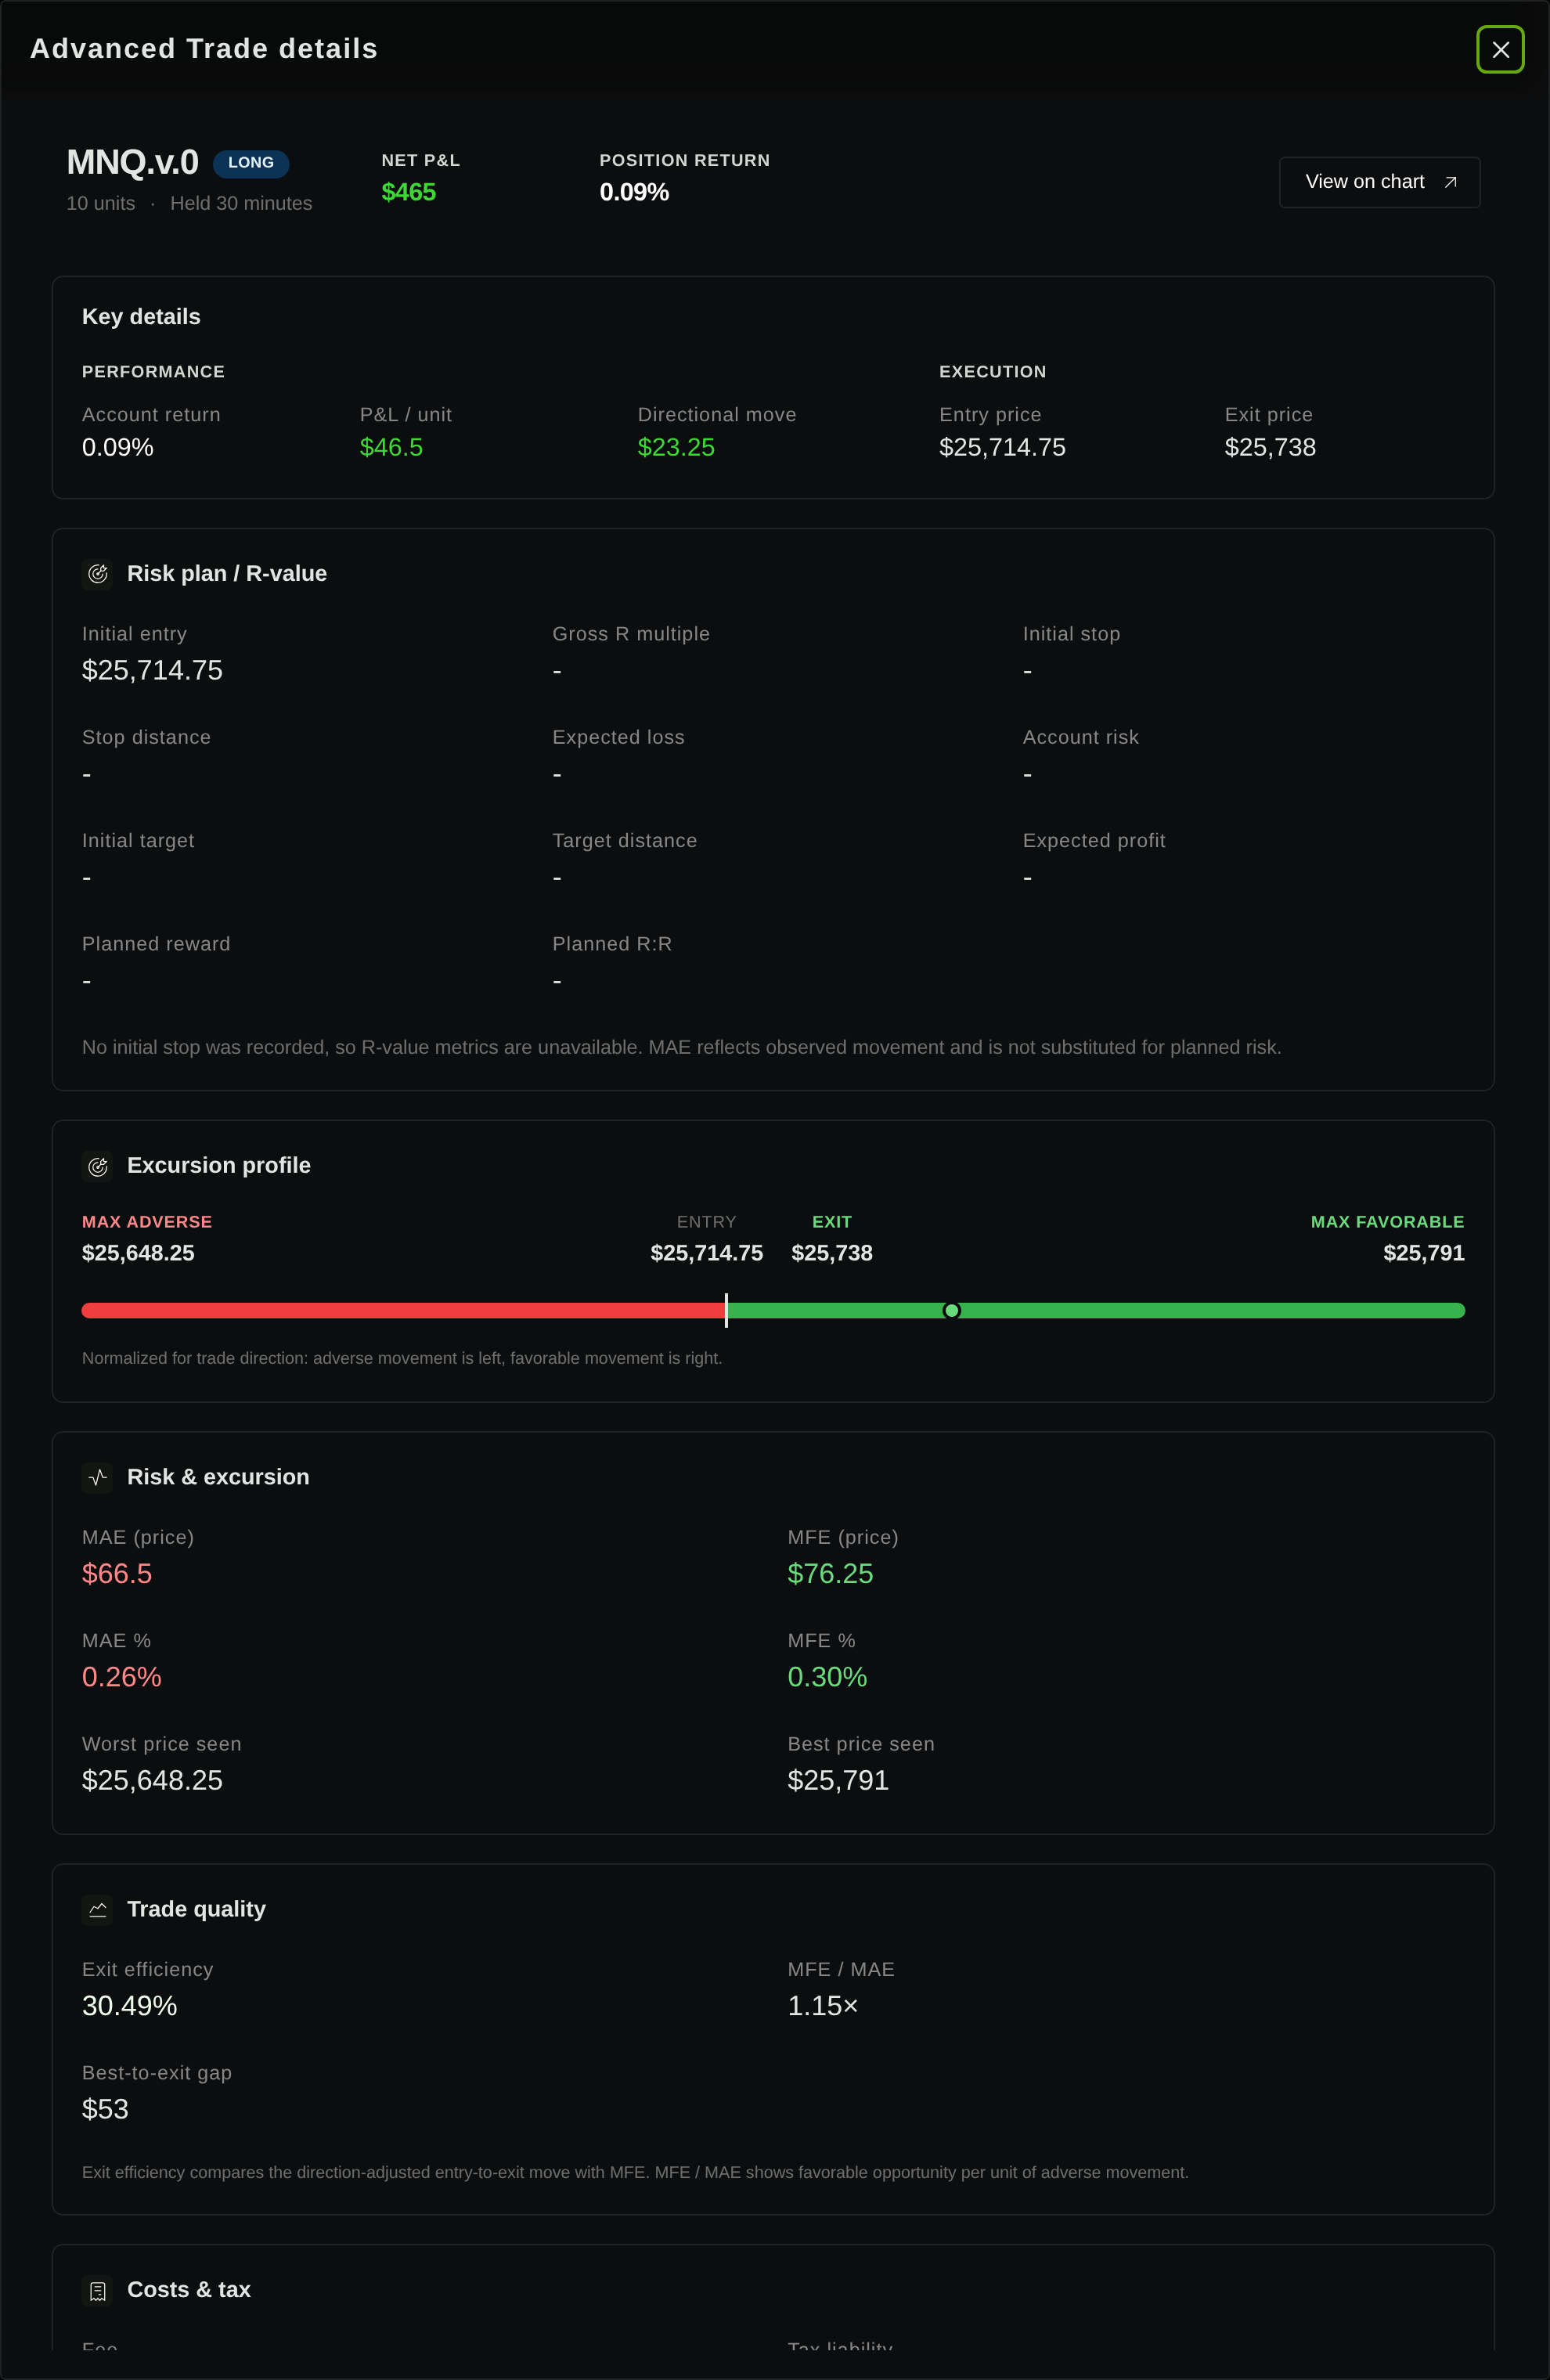
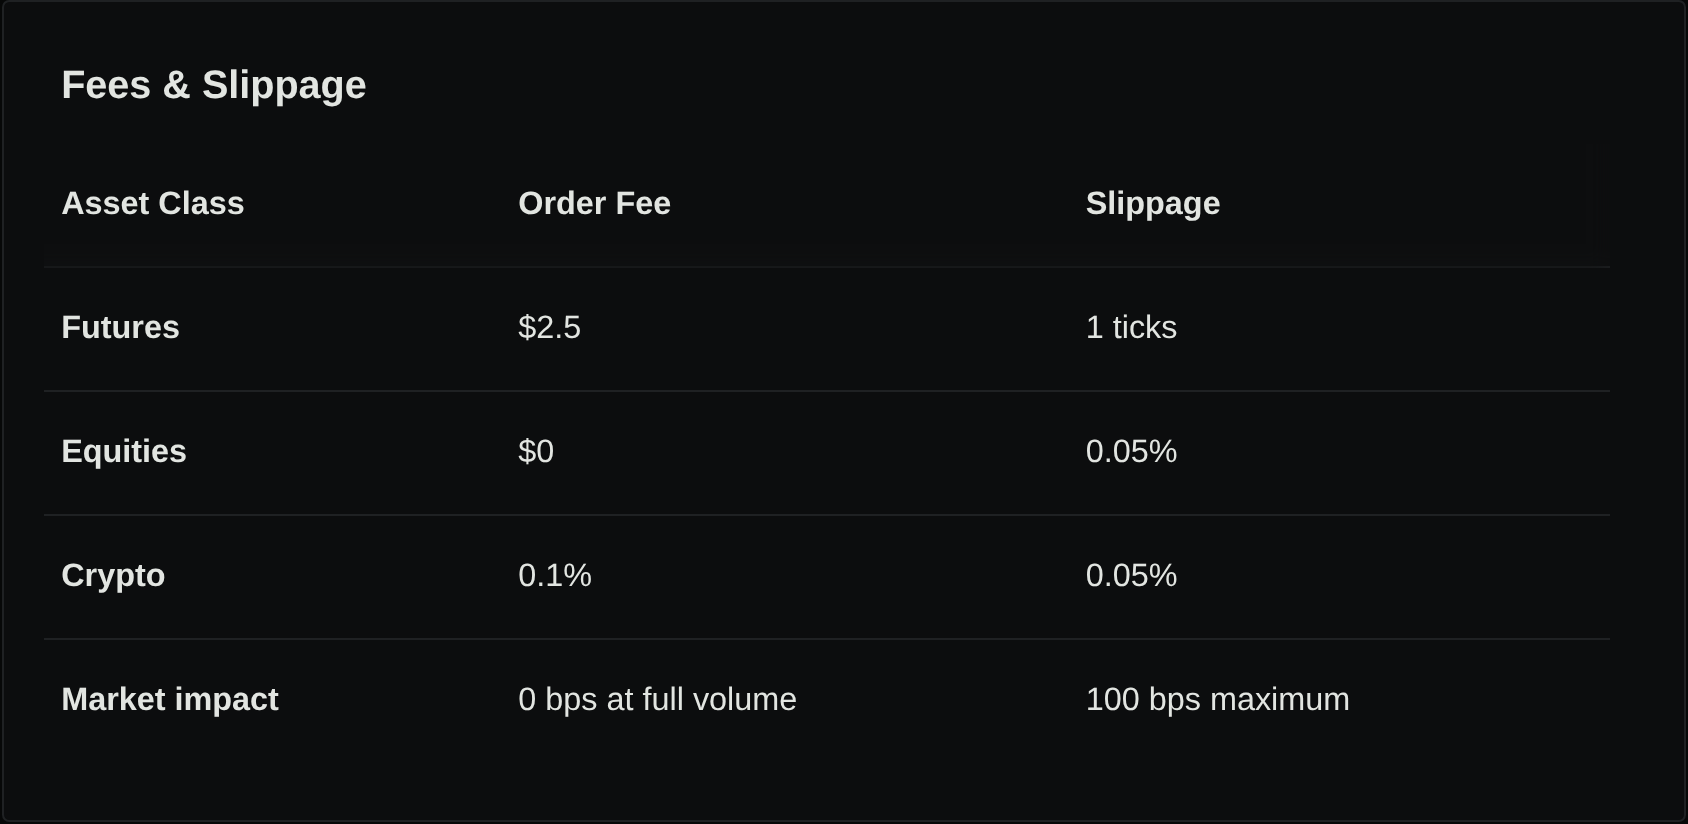
Both a fill-relative order.entry_price - 20 stop and the signal-price variant shown here were tested; the recorded initial-stop fields remained null. This limits the conclusion to saved sizing intent and observed fill/P&L arithmetic. The reports also charge zero fees despite saved futures fees of $2.50 per contract and one tick of slippage, so cost-inclusive risk matching remains unresolved.
Whole contracts leave unused budget
Suppose the teaching example allows $250 of loss at a 20-point stop, before costs:
Maximum quantity = floor(loss budget / planned loss per contract)NQ: floor($250 / $400) = 0 contractsMNQ: floor($250 / $40) = 6 contractsSix MNQ contracts use $240 of that budget, leaving $10 unused. Rounding up to seven would put $280 at the stop. A fractional result such as 0.625 NQ is not a whole futures contract.
A zero quantity means the planned trade does not fit the specified budget. Increasing the budget or moving the stop would change the experiment. Record skipped trades rather than silently forcing a minimum quantity of one.
These amounts are teaching inputs, not recommended account sizes or risk limits.
Include costs before calling the risk matched
Contract multipliers have a ten-to-one relationship; your total transaction fees need not. CME’s Micro E-mini FAQ distinguishes exchange clearing fees from broker commissions. Use the applicable schedule for each instrument and account, including both entry and exit.
For illustration only, assume $4 of total round-trip fees per NQ contract and $1 per MNQ contract. These are invented teaching inputs, not current broker quotes. Also assume each entry and stop exit fills one tick worse than its fixed planned reference price.
| Stopped trade | 1 NQ | 10 MNQ |
|---|---|---|
| 20-point loss | $400 | $400 |
| Fees | $4 | $10 |
| Two-tick slip | $10 | $10 |
| Modeled loss | $414 | $420 |
The slip allowance is 2 × $5 × 1 for NQ and 2 × $0.50 × 10 for MNQ. Its equality here comes from the assumption of equal tick slippage, not observed execution.
This table measures loss between fixed planned entry and stop levels. If your stop is placed 20 points from the actual entry fill, calculate risk from that fill; adding entry slippage again would overstate the fill-to-stop distance.
For the same $250 budget, the illustrative MNQ cost allowance changes the quantity:
MNQ modeled loss per contract = $40 + $1 fees + $1 slippage = $42Maximum quantity = floor($250 / $42) = 5 contractsModeled loss for five contracts = $210Modeled loss for six contracts = $252The unused $40 is the consequence of whole-contract sizing. Realized loss can exceed this model if execution is worse than the allowance.
Check the comparison before interpreting a report
Before running NQ and MNQ variants, write down:
- Contract identity: exact NQ and MNQ instruments, matching expiry, and independent data coverage. If using continuous series, document how signals and fills map to executable contracts.
- Rules and timing: identical point-based entry/exit logic, bar interval, historical window, indicator warmup, session timezone, and whether a completed-bar signal fills on the next bar.
- Position policy: equal counts or matched planned stop risk, whole-contract rounding, zero-quantity skips, and treatment of overlapping positions.
- Execution and costs: instrument-specific fees, adverse fills, gaps through stops, and the policy when a bar reaches both stop and target.
- Capital: equal starting cash, margin requirements, and the handling of trades rejected for insufficient available capital.
Margin is separate from the loss-at-stop calculation. CME describes futures margin as funds deposited with your broker, rather than a down payment on the underlying asset. Check the requirements applicable to the contracts and holding period instead of using the $400 example as a cash requirement.
Inspect at least one stopped trade in each report. Reconcile its actual entry, exit, quantity, multiplier, fees, and net P&L. A 20-point fill-to-fill loss on one NQ should imply $400 of gross loss; the same distance on ten MNQ also implies $400. Any difference needs explanation from the trade’s actual prices and costs.
Then compare drawdown, skipped trades, and total costs alongside returns. Micro contracts provide smaller sizing increments; whether a particular rule set performs better on MNQ requires separate data and completed tests.
Review Stratifyre’s backtesting workflow and verify your selected instrument’s dollar risk per stop before running the strategy.
Put your strategy rules to the test
Build your strategy, inspect historical trades, and review the assumptions behind your results.
Build and test your strategy