One-second vs one-minute backtests: why your stop and target change places
Diagnose intraday fill differences by separating candle detail, signal timing, and fill assumptions before trusting a finer backtest.
A one-minute backtest hits your target. A finer run stops out. Before deciding that either result is right, check whether you changed the price information, the order timing, or the strategy itself.
One-second bars can reveal a sequence that a minute candle hides. They still compress events inside each second, and changing the evaluation timestep can create different signals. The useful question is: what explains the first trade where the two runs diverge?
One candle, two possible exits
Consider an illustrative long position already open before a minute begins. A sell stop at 99 and a sell limit target at 102 are both working, with the first filled exit cancelling the other. Assume sufficient liquidity and immediate execution when each level is crossed solely for this example.
The minute candle opens at 100, reaches a high of 103 and a low of 98, and closes at 101. Both exit levels lie inside its range. Those four prices do not tell you which level traded first.
Same candle. Opposite first exits.
Open 100 · High 103 · Low 98 · Close 101
View example data
| Observation | Target first | Stop first |
|---|---|---|
| Open | 100 | 100 |
| First extreme | 103 | 98 |
| Second extreme | 98 | 103 |
| Close | 101 | 101 |
If the price rises through 102 before falling through 99, the target can close the position first under the example’s execution assumptions. If it falls through 99 first, the stop can close it instead. A minute-based simulator needs a rule for resolving this uncertainty.
This is the problem lower-interval inspection tries to address. TradingView’s Bar Magnifier documentation gives an example where access to smaller bars changes whether an exit occurs during the entry bar.
What one-second data resolves—and what it leaves open
Suppose smaller bars place the first target crossing in one second and the first stop crossing in a later second. That adds chronological information, provided both orders were already eligible to fill. You can distinguish the two paths more clearly.
If the same one-second bar reaches both levels, the ordering problem remains inside that second. Finer OHLC data reduces the size of the unknown interval; it does not turn candles into a complete event history.
Even a known price sequence does not guarantee that your order would execute at the displayed level. A limit price being reached is different from getting your quantity filled. A stop can trigger before execution, and a gap can carry the price beyond it. Spread, liquidity, latency, and the chosen execution assumptions still matter. QuantConnect’s fill-model concepts explicitly separate the modelled fill price and quantity from additional slippage assumptions.
Treat finer bars as additional information about a trade, not evidence that its simulated execution is perfect.
Separate the settings before comparing runs
Four settings are easy to conflate:
- Indicator interval: Which bars build the indicator: minute bars, second bars, or another interval?
- Rule evaluation timestep: When can the strategy reconsider an entry or exit?
- Order eligibility timing: When does a new order become available for execution?
- Fill model: How does available price information become a fill, including ambiguous order priority?
A 20-bar moving average on one-minute bars covers a different span from a 20-bar average on one-second bars. Keeping the length at 20 while changing the interval changes the signal definition.
Explicitly keeping an indicator on one-minute bars is only the first control. If rules now evaluate every second, they may observe a forming minute, enter earlier, or repeatedly act on a condition. Verify whether the indicator uses completed or forming bars, when the signal becomes available, and how repeat entries are prevented.
Stratifyre’s backtest configuration uses the timestep for strategy evaluation as well as execution data. Its accepted configuration intervals include 1s and 1m; confirm actual historical coverage for the exact instrument and window before planning a comparison. An accepted interval is not a promise that every instrument has that data.
A fill-price setting is another separate assumption. Pessimistic market fills use an adverse price from the available bar; a narrower bar can therefore change the chosen price without changing the signal. That does not establish which stop or target traded first. Order type, order priority, and eligibility need their own checks.
For market orders, On-Open execution overrides the selected fill-price mode with bar-open pricing. Record the effective execution settings before comparing runs.
A real comparison stopped at the coverage check
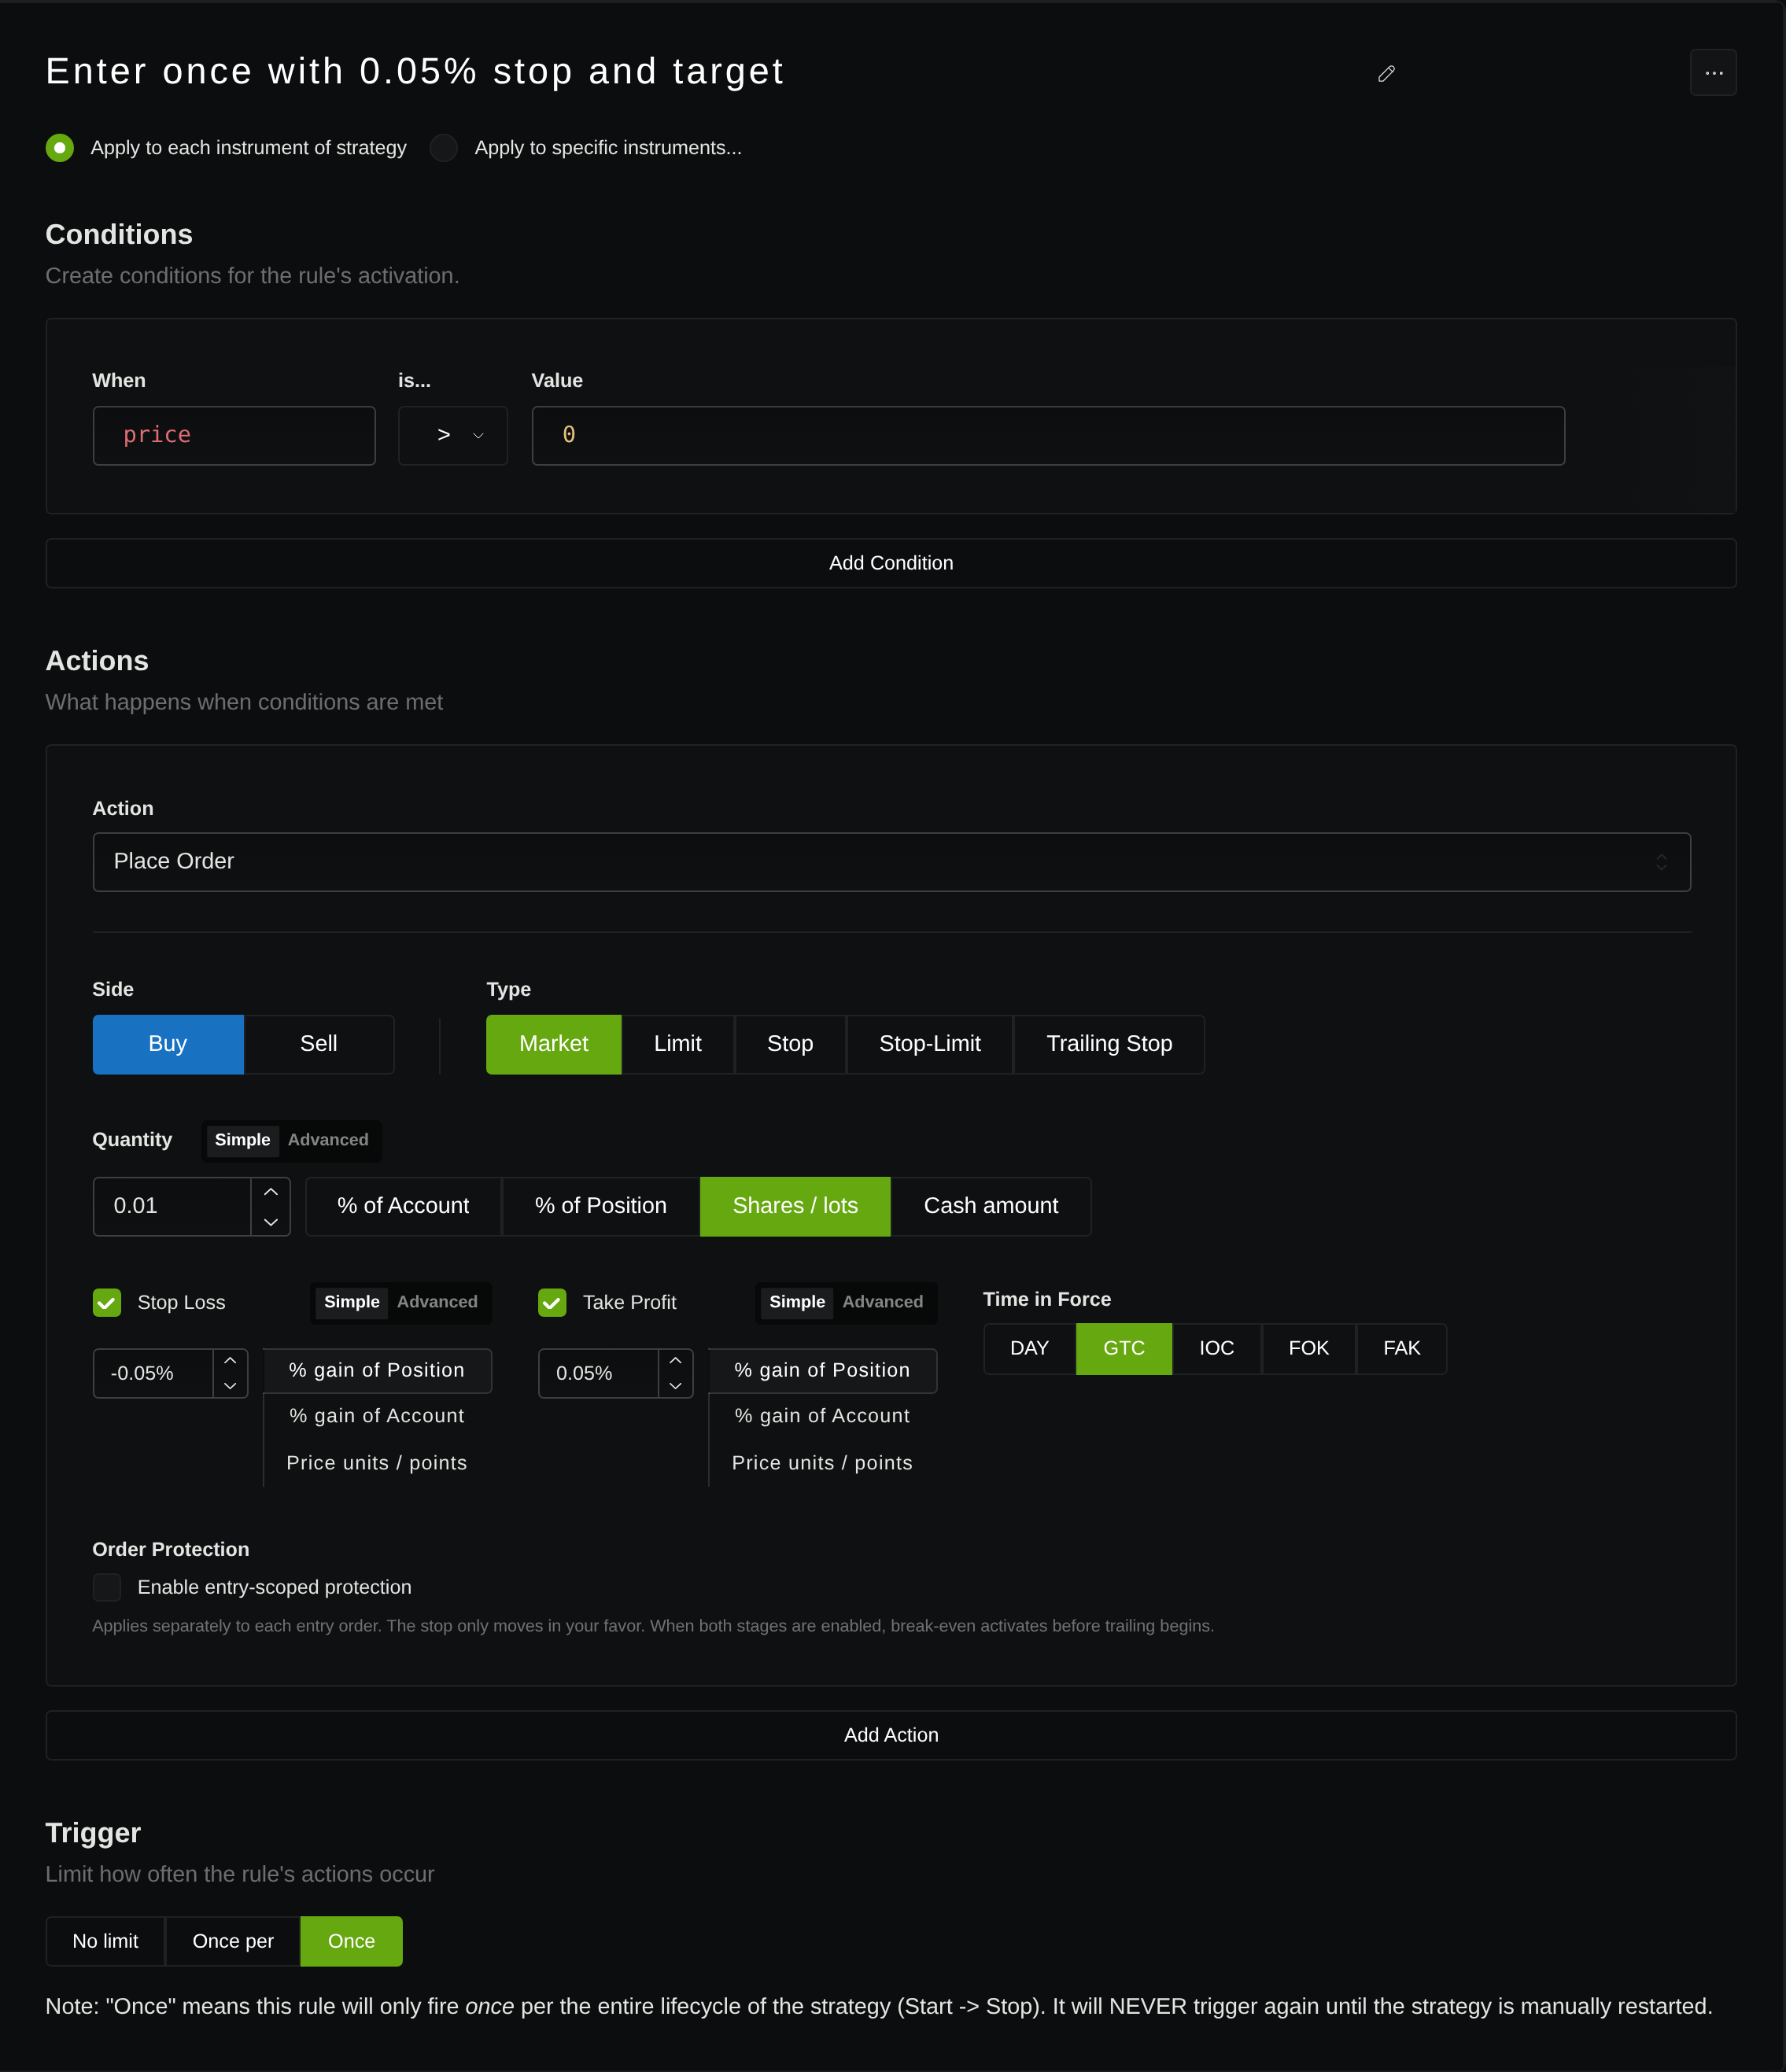
We saved a small, once-only protected market entry for Binance BTC/USDT, then requested the same January 11, 2025 window at 1m and 1s. Both configurations used $10,000 capital, 0.01 BTC, On-Open execution, zero configured crypto commission/slippage and the same saved rule version. The stop and target expressions were order.entry_price * 0.9995 and order.entry_price * 1.0005. This is a timestep experiment; it does not supply an independent execution-data clock.
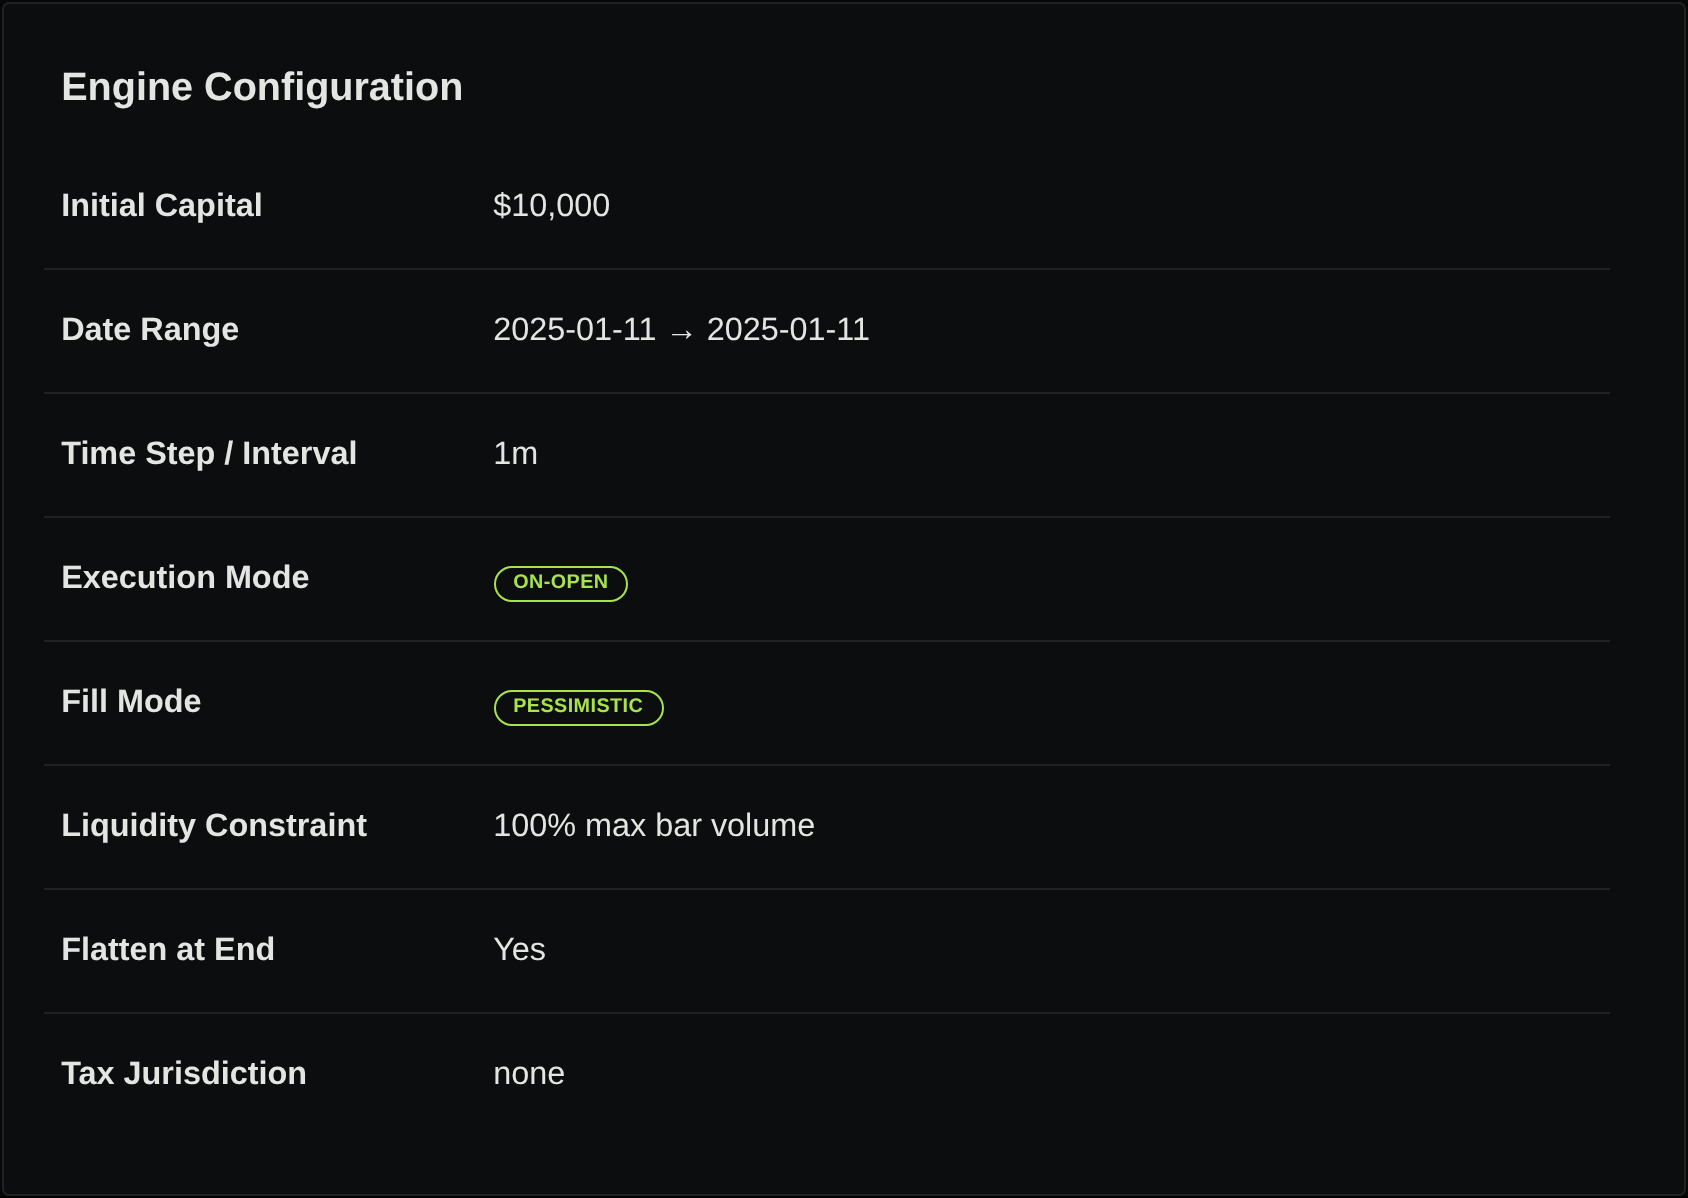
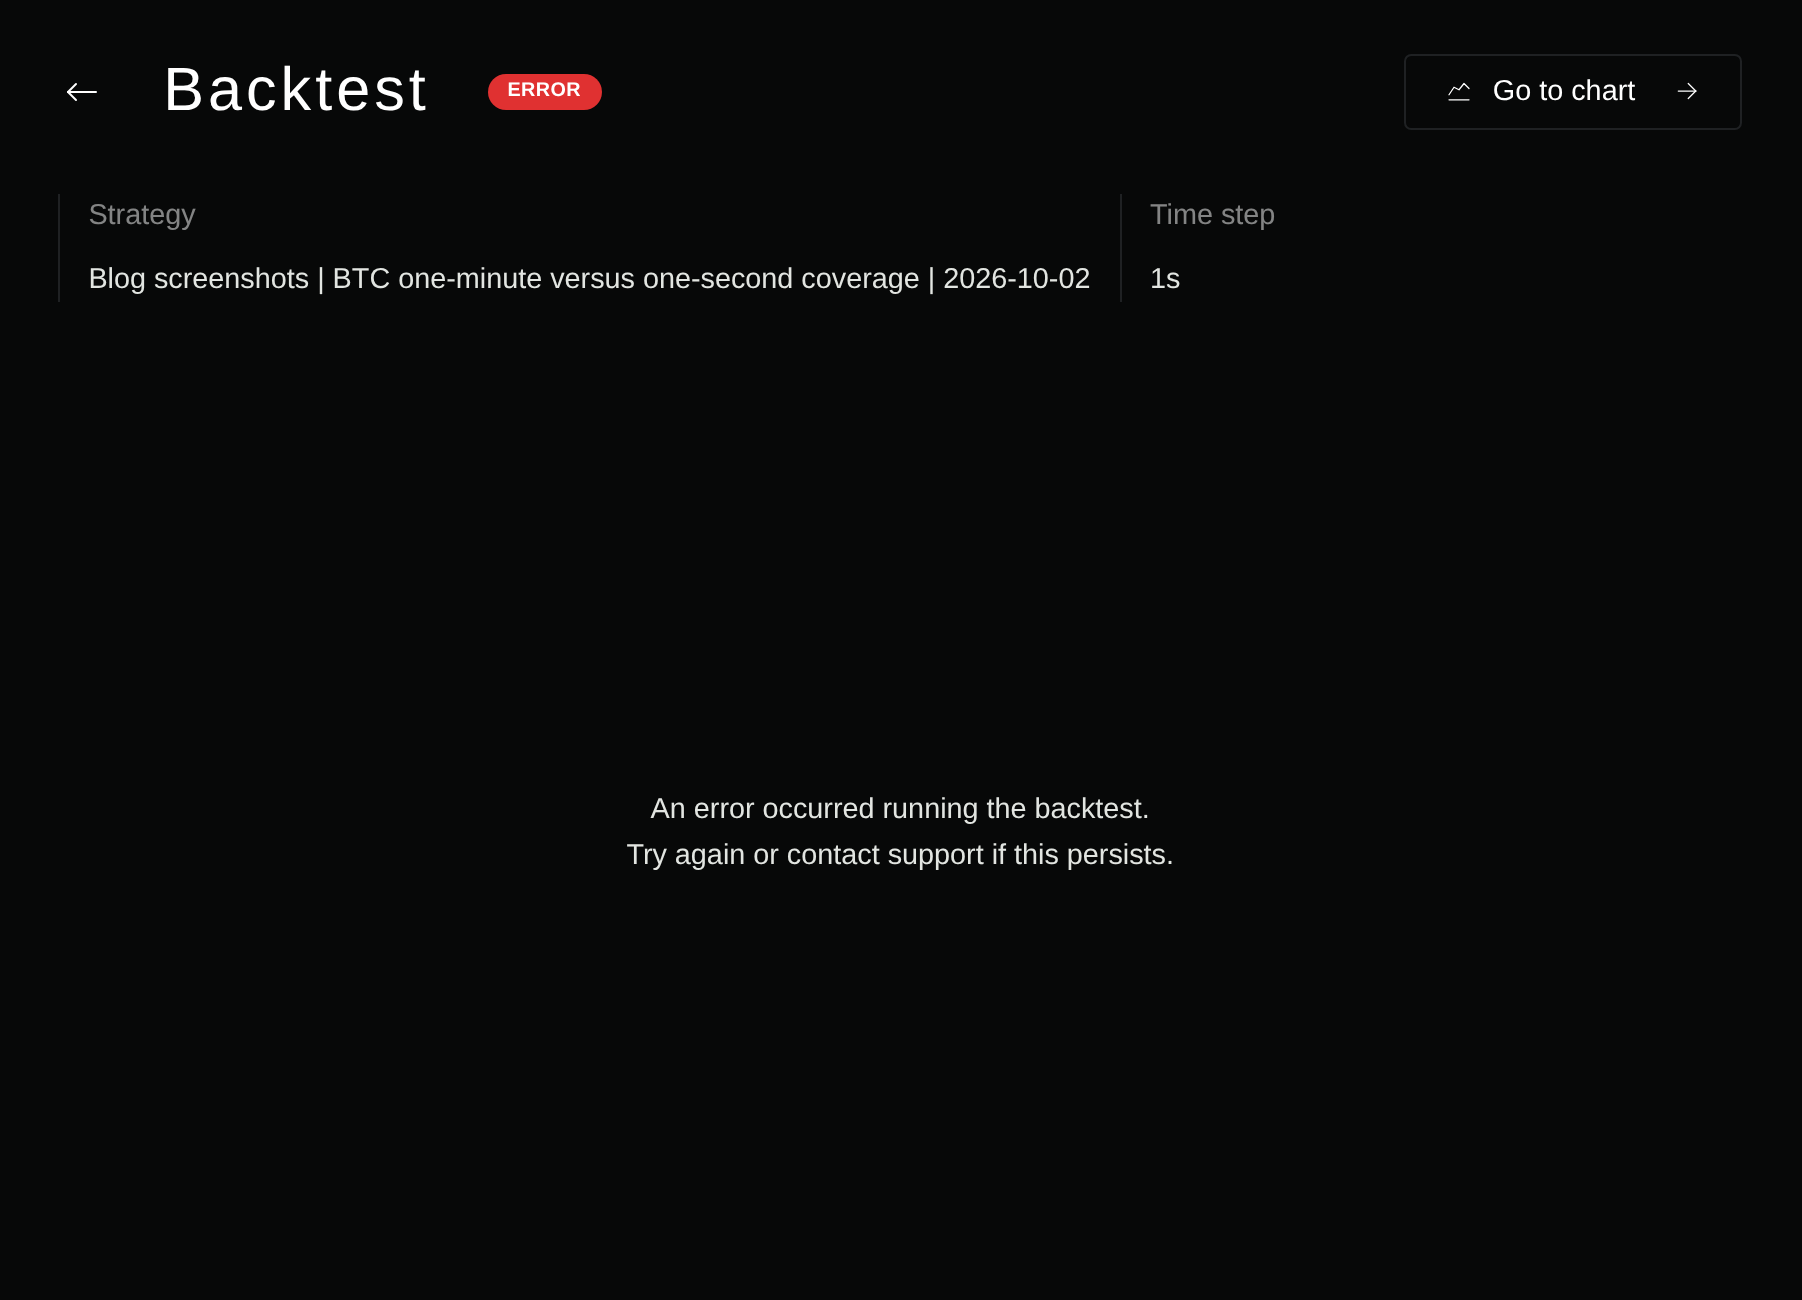
The minute market-data request returned 1,440 bars covering the day. The same instrument/window at one second returned zero bars, and the requested second run ended in ERROR. Its runtime event states: No marketdata bars found for requested instruments/date range. instruments=CRYPTO:BINANCE:BTCUSDT startDate=2025-01-11 endDate=2025-01-11 timeStep=1s.
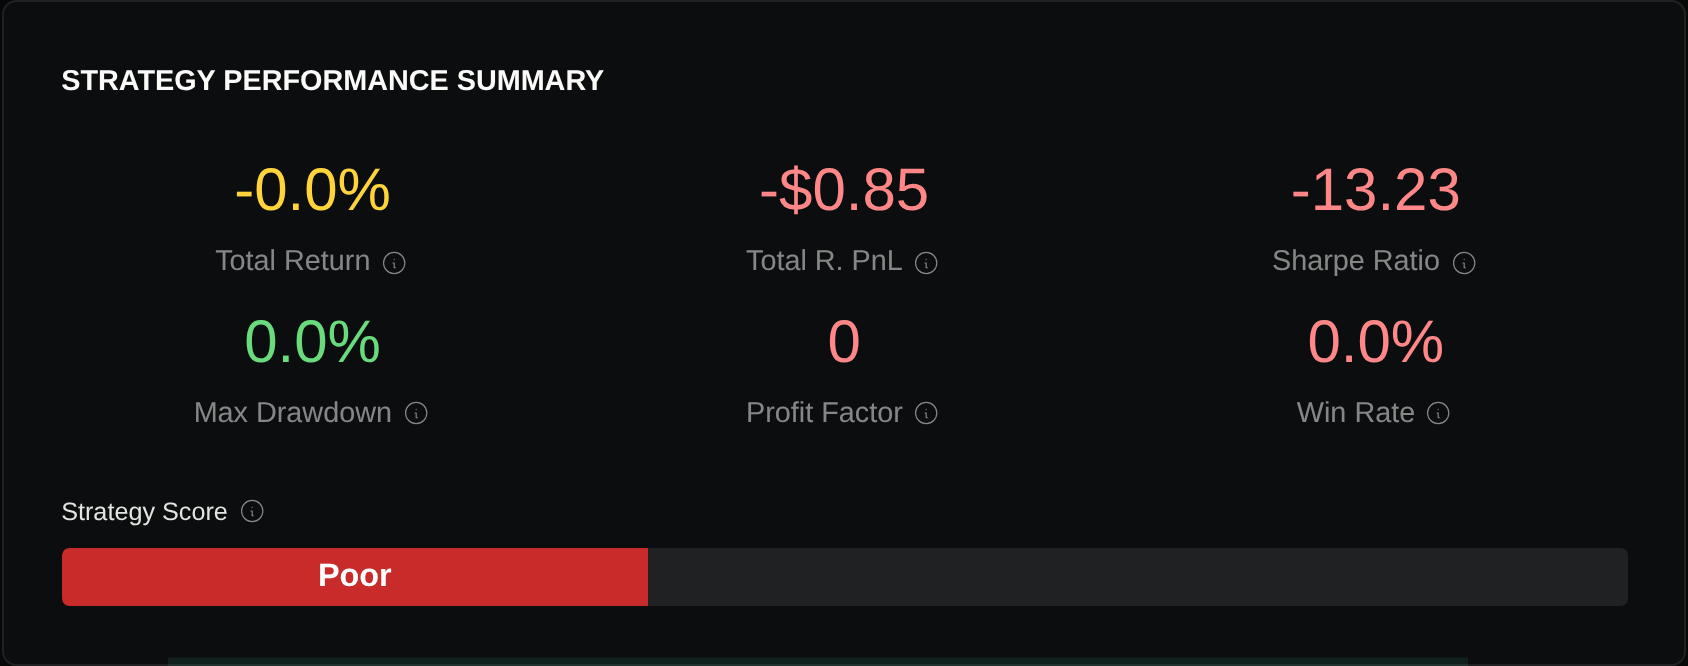
The minute run completed with one trade and a reported $0.85 loss. It bought 0.01 BTC at $94,726.10 at 00:00 UTC and exited at $94,640.74 at 00:07 UTC. Those observations establish the minute outcome only; they do not establish a target-first versus stop-first reversal at one second.

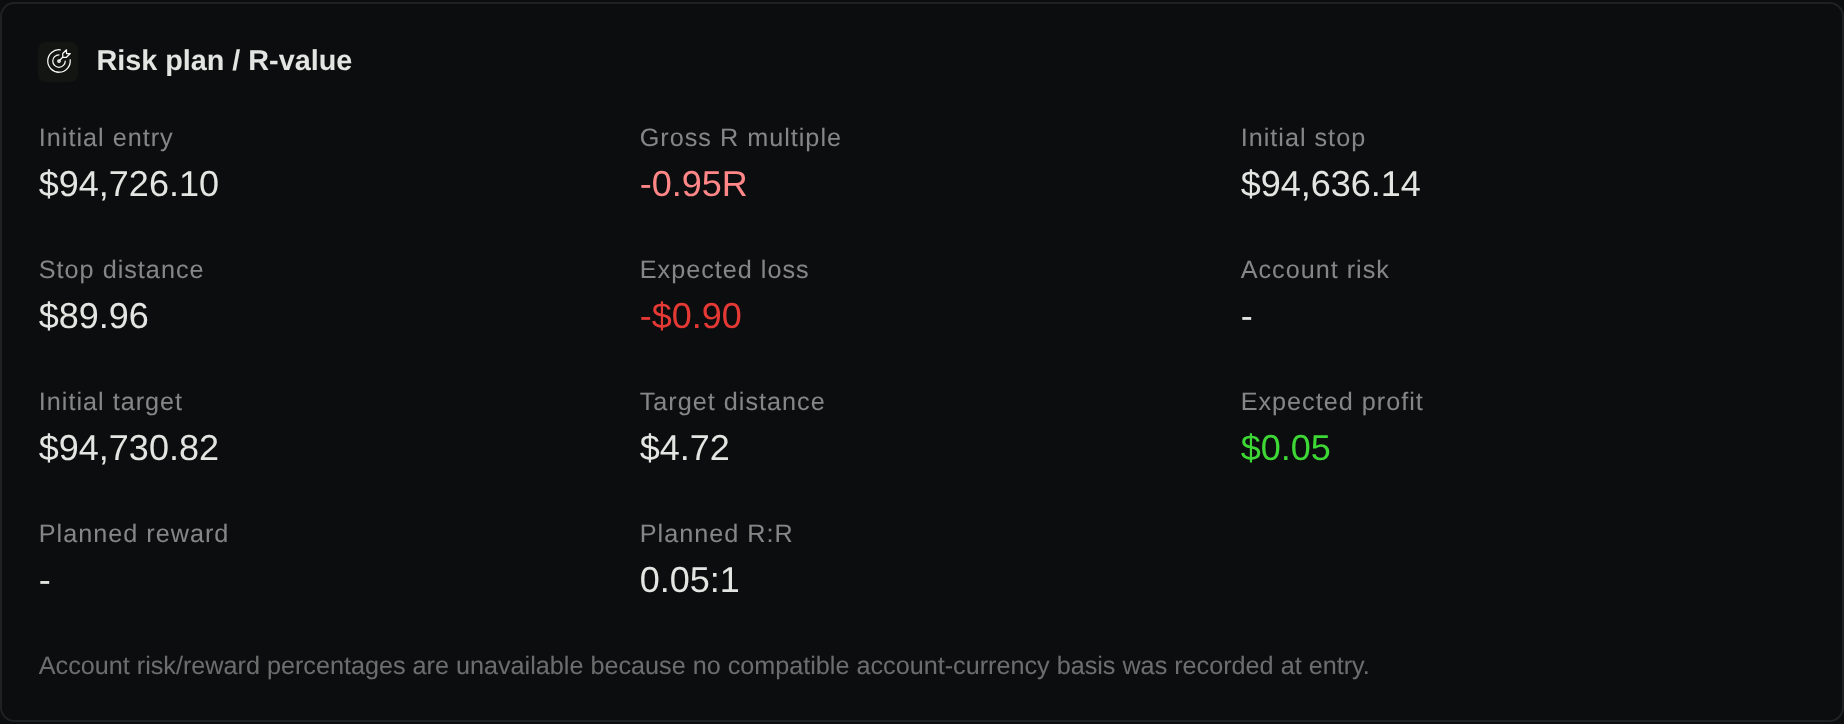
The recorded initial stop was $94,636.14 and target $94,730.82. They are not symmetric 0.05% distances from the $94,726.10 fill. The order view shows an entry-order reference of $94,683.48; the protection levels are consistent with applying the saved expressions to that reference. This observed difference is another reason to inspect actual orders, eligibility and fills before describing a finer run as a pure price-detail comparison.
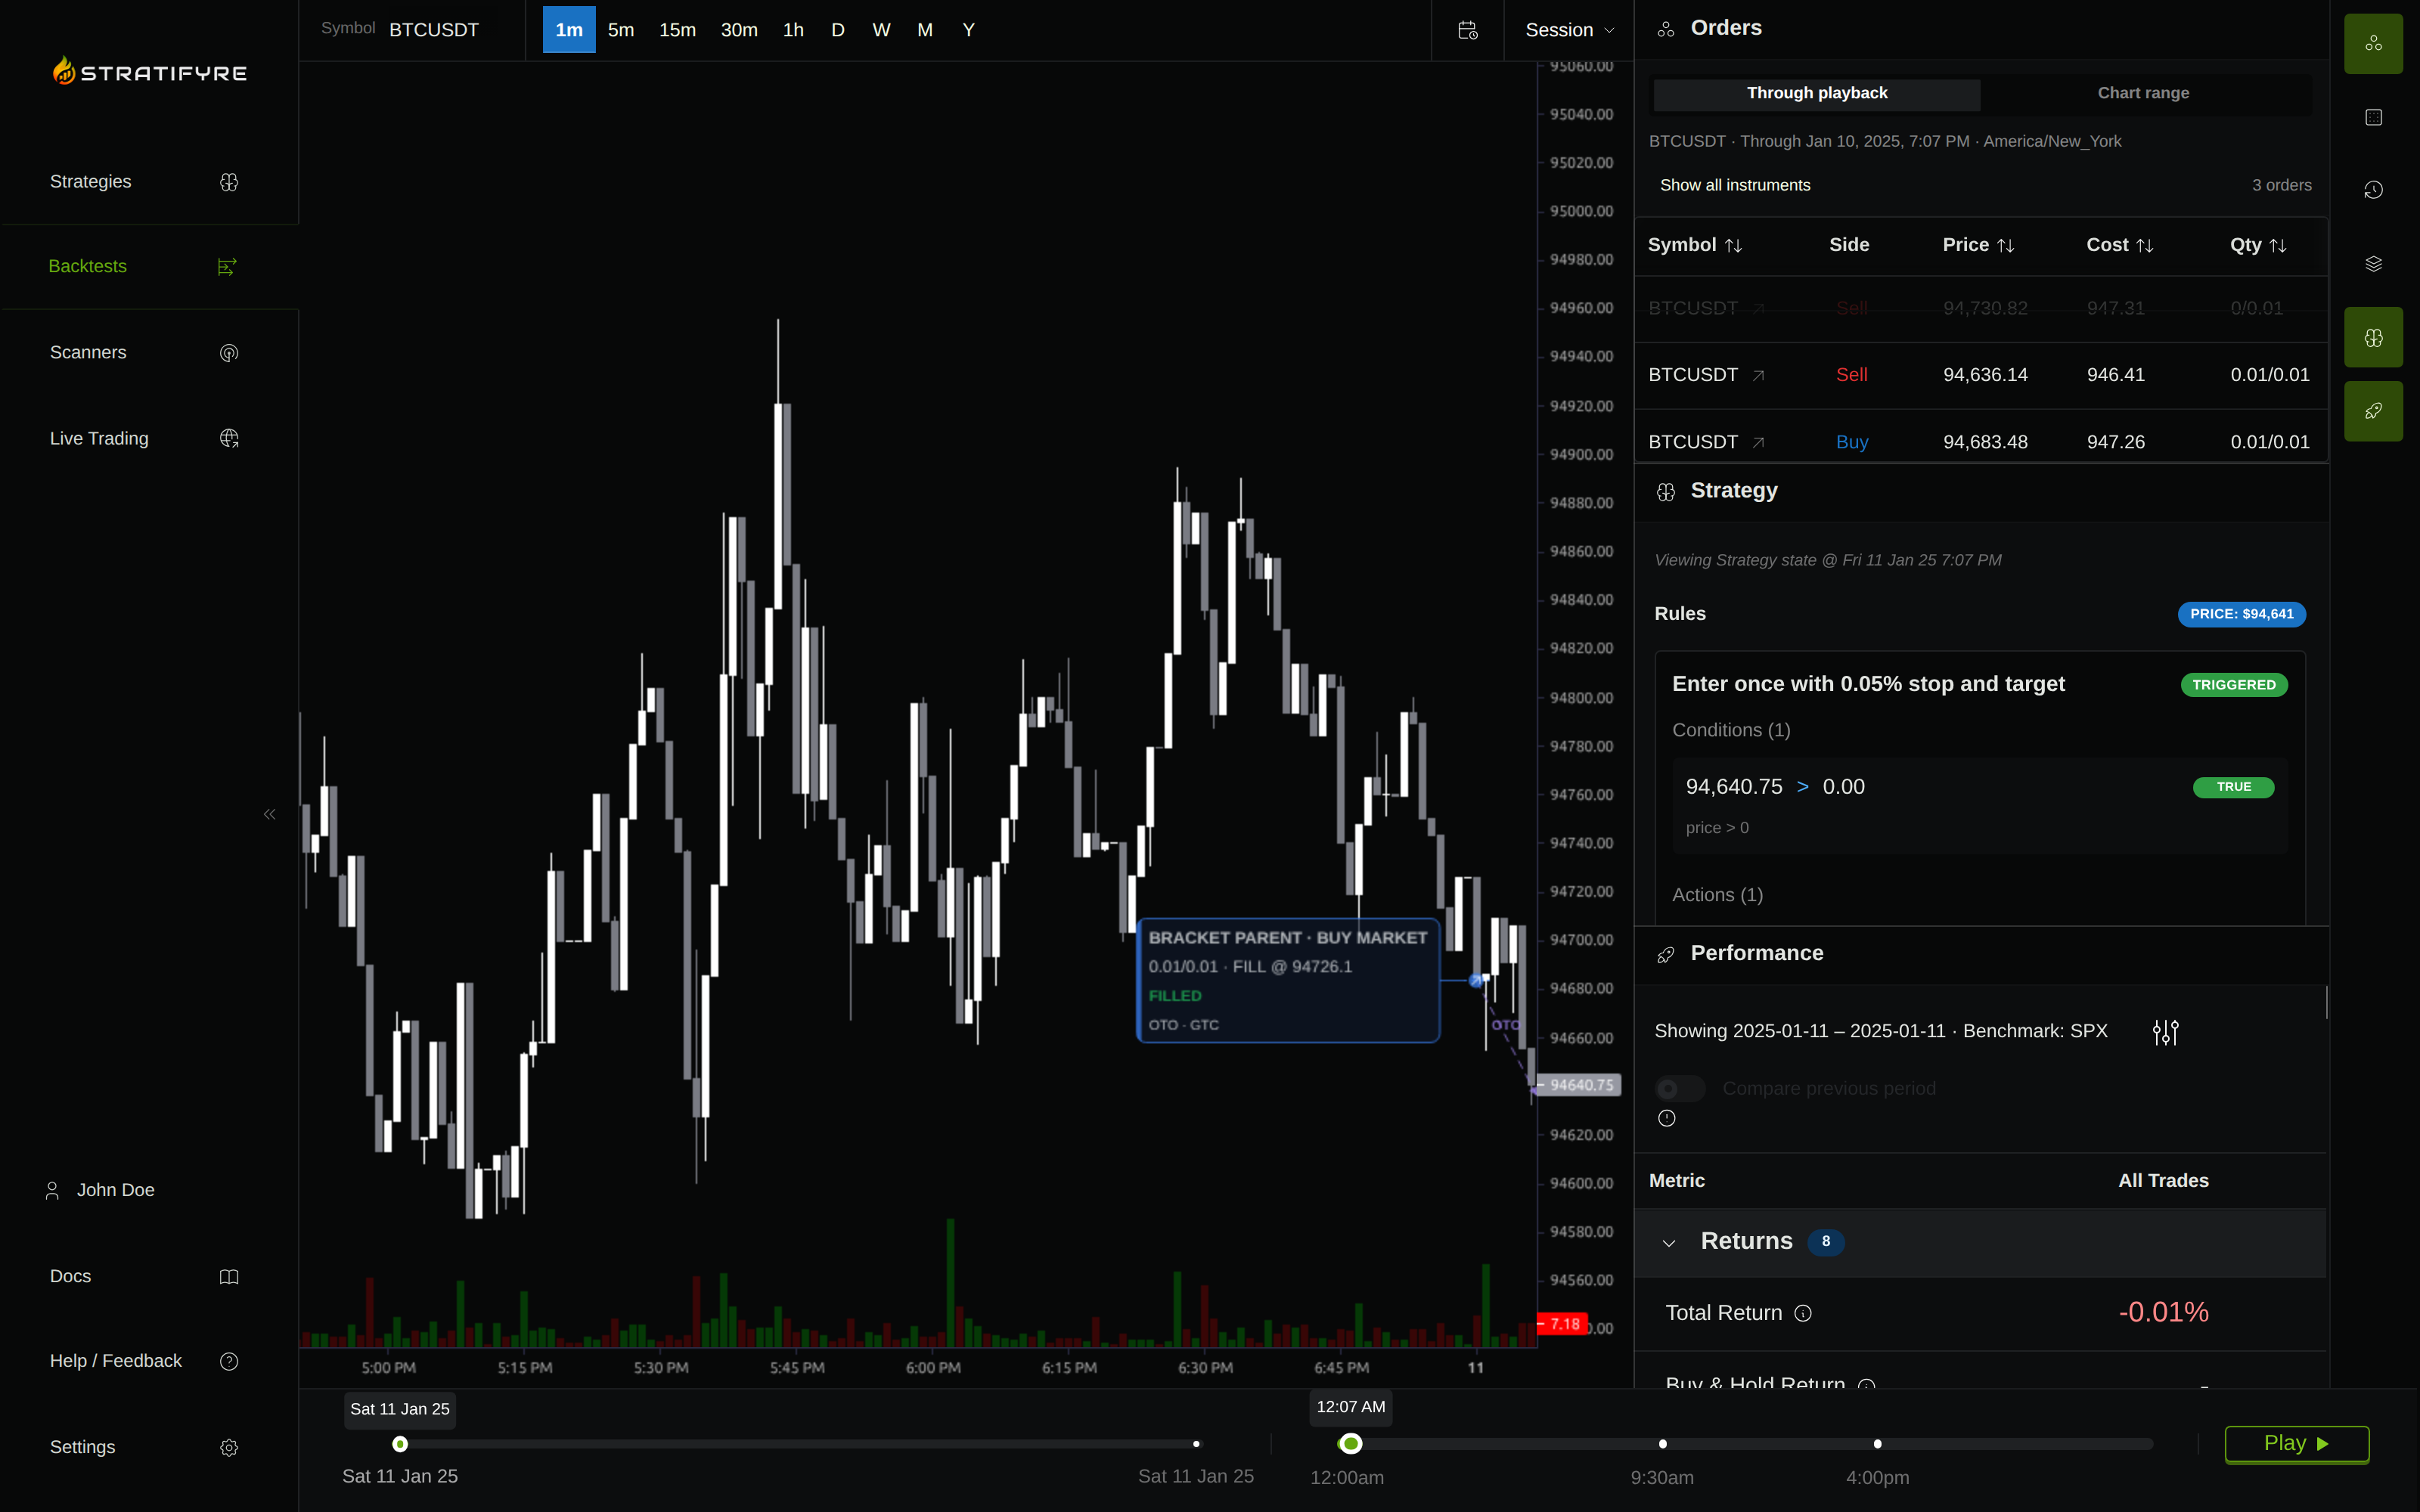
The coverage failure leaves the requested comparison unfinished. A completed finer run with matching order intents is still required before claiming that finer information changes which exit fills first; the illustrative paths above do not substitute for it.
Prespecify a comparison that answers one question
Start with a short window containing a trade you can inspect. Preserve the strategy before looking at the finer result; avoid retuning stops or targets to make one version look better.
Record the following for both runs:
- Exact venue, instrument or futures contract, date window, session, and timezone.
- Entry condition, indicator interval, completed-bar policy, and rule evaluation cadence.
- Execution mode, entry order type, eligibility timing, initial position, quantity, and initial capital.
- Stop and target order types, distances, activation timing, and sibling cancellation policy.
- Fill assumptions, commissions, slippage, liquidity constraints, and warmup.
- Data source, available interval, and any missing observations or adjustment settings.
The comparison you want determines what can change:
Fill-detail experiment: Preserve signals and order submissions at identical times, sizing, costs, and fill rules. Change only execution price detail, if an independent control is supported.
Timestep experiment: Preserve rule definitions, explicitly assigned indicator intervals, sizing, costs, and fill rules. Change the primary timestep; signal opportunities and fills can both change.
Fill-model experiment: Preserve data, timestep, signals, order timing, and execution mode. Change one fill assumption and verify that it is active under the selected execution mode.
Do not label a timestep experiment a pure fill comparison merely because both runs use a minute indicator. First verify that the order submissions match. If independent execution granularity or a fixed decision schedule is unavailable, describe the result as a combined timing-and-execution sensitivity check.
Inspect the first divergence, not just final returns
Match the runs by intended entry and timestamp, then locate the earliest disagreement. Comparing each run’s fifth trade can be misleading once an earlier exit changes the next entry.
For that first disagreement, build a small trade record:
- Signal: Was the same completed information available, and did it trigger at the same time?
- Entry: Were order type, requested quantity, submission time, and fill eligibility identical?
- Protection: Were stop and target both active before the disputed movement?
- Price sequence: Do smaller bars put the crossings in separate intervals, or does one smaller bar still reach both?
- Execution: Did fill-price selection, gap handling, partial execution, or sibling cancellation explain the exit?
- Coverage: Did finer observations cover the entire trade, including entry, exit, and necessary warmup?
Classify the difference before interpreting performance. An earlier entry is a signal or timing change. A different price for the same eligible order is an execution change. Both levels inside one smaller bar remain an unresolved sequence handled by the simulator’s policy.
Decide whether finer data changes your conclusion
If finer data puts the disputed crossings in separate intervals, use it to explain that trade’s sequence while retaining the execution assumptions. If it still leaves both exits inside one interval, document the ambiguity rather than choosing the more attractive outcome.
If only part of the window has finer coverage, compare a common covered window and report the omitted periods. Do not silently treat a partial comparison as evidence for the whole backtest. TradingView likewise documents that its lower-bar coverage limits can leave earlier trades unaffected by Bar Magnifier; coverage is part of the experiment.
If the entry schedule changes, the result answers a different question: how the strategy behaves at another cadence. That can still be useful, but it cannot isolate fill quality. Faster evaluation, more observations, and a higher return are separate findings; none follows automatically from selecting one-second bars.
Choose one ambiguous stop/target trade and document its signal time, active orders, price sequence, and remaining uncertainty. Use Stratifyre’s backtest results guide to locate the trade log and inspect the trade that changed your conclusion.
Put your strategy rules to the test
Build your strategy, inspect historical trades, and review the assumptions behind your results.
Build and test your strategy