Backtest a crude-oil trend strategy with ATR stops
Compare a fixed crude-oil stop with an ATR-based initial stop, freeze the entry rules, and translate price distance into CL or MCL contract risk.
A $1.00-per-barrel stop has the same price distance on every oil trade. Its relationship to recent volatility can change substantially. An ATR-based stop asks a narrower question: does adjusting the initial distance to recent price movement improve this particular entry strategy after costs?
Keep the entry rule fixed and compare two initial stops. The outright-contract recipe below remains a research specification; the actual Stratifyre screenshots show a separate, completed hourly comparison on continuous CL prices. Reported costs and protective-stop behavior retain the limitations described alongside those images.
Decide what “ATR stop” means
Average True Range, or ATR, measures price movement rather than trend direction. True range is the largest of the current high minus low, the absolute distance from the high to the previous close, and the absolute distance from the low to the previous close. Those last two comparisons include gaps. Fidelity’s ATR guide explains the calculation and its use in setting volatility-based stops.
Use ATR(14) on completed one-hour bars, with Wilder’s smoothing. Fourteen means fourteen bars, not fourteen days. Save its value when the entry order is submitted. For the ATR version, the intended initial distance is twice that saved value.
There are three separate choices:
- Sampling: take ATR from the last completed signal bar when submitting the order.
- Anchor: subtract the saved distance from the actual first entry fill.
- Persistence: leave that stop price fixed for the trade; disable trailing and break-even stages.
A stop recalculated from the latest ATR every hour is a different experiment. So is a stop following the highest price since entry. Avoid mixing either behavior into the first comparison.
Freeze the entry and the test window
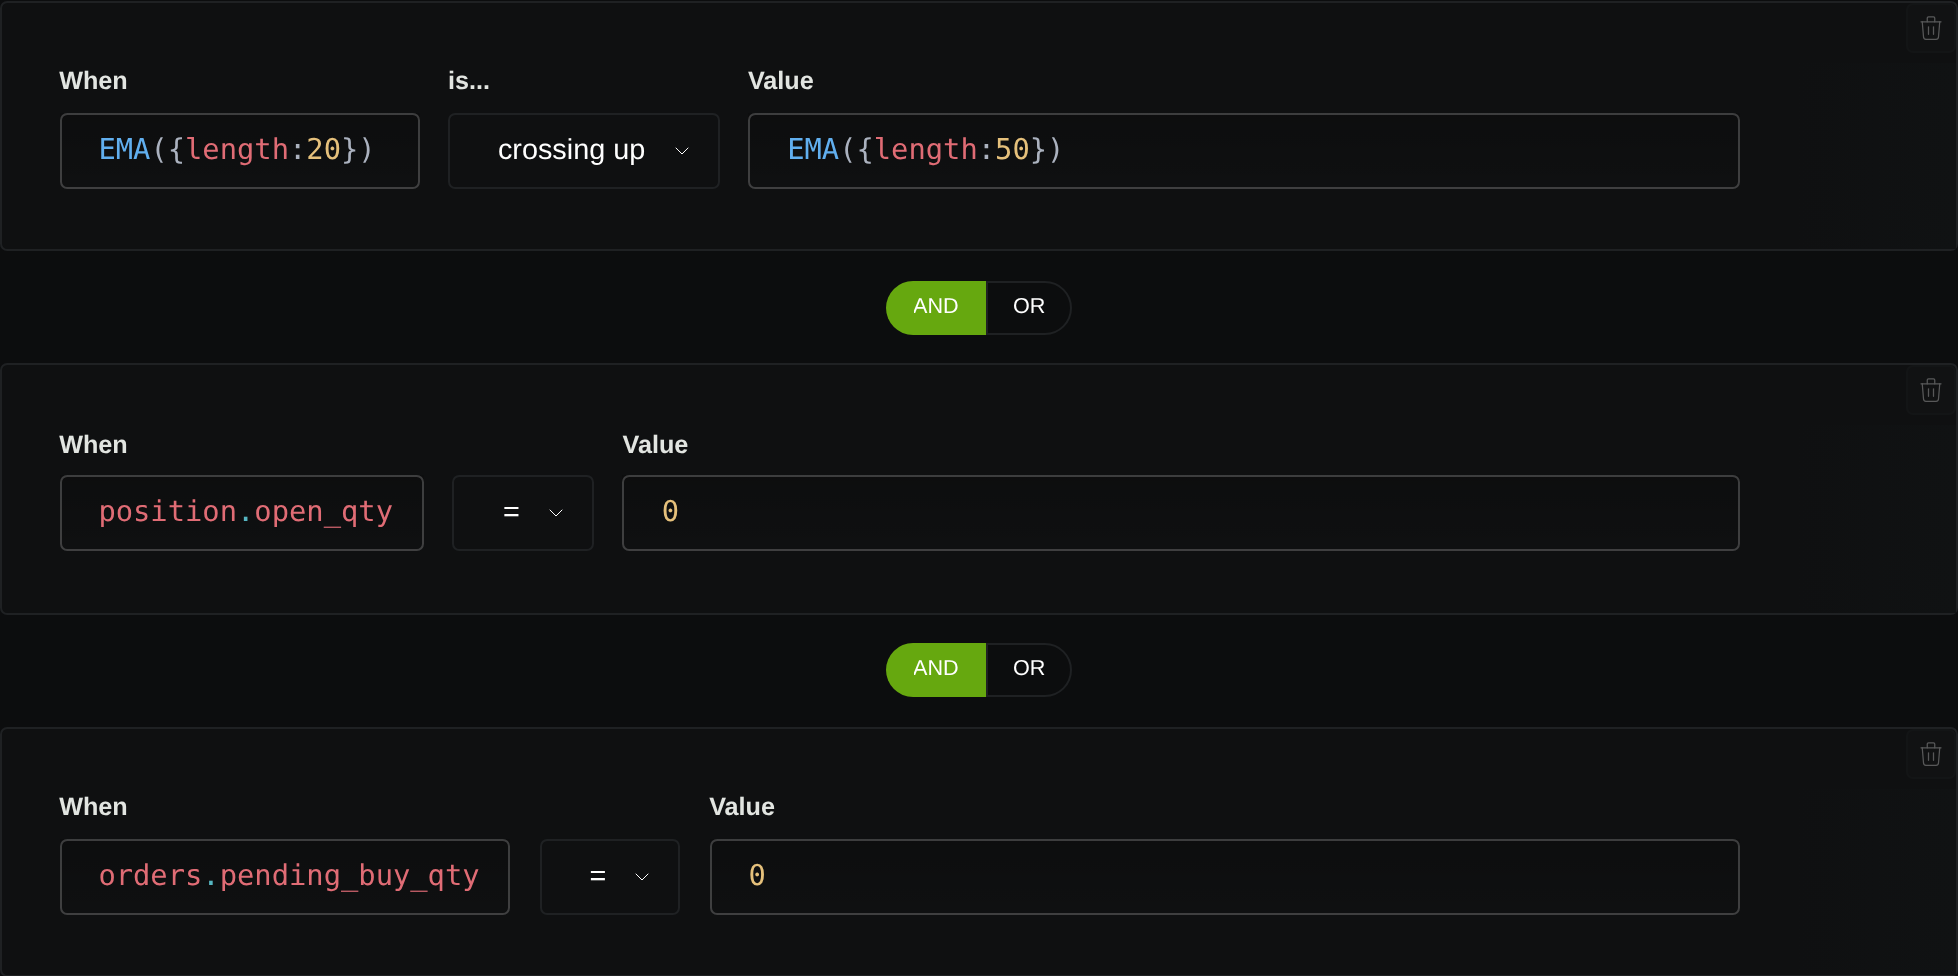
Use a simple long-only trend entry: buy one contract after a 20-period EMA crosses above a 50-period EMA on completed hourly closing prices. An upward cross means the fast EMA was at or below the slow EMA on the previous completed bar and is above it on the current one.
Enter only while flat, with no pending entry order. Ignore further entry signals while holding a position. Exit on the opposite cross or the initial stop, whichever executes first. Do not add a profit target, shorts, or additional contracts.
The following is a proposed specification, conditional on confirming the exact historical contract and available data:
| Setting | Same in both versions |
|---|---|
| Contract | NYMEX December 2025 CL outright; record the provider’s exact instrument ID |
| Trading window | October 1–31, 2025, using America/Chicago calendar dates |
| Indicators | Hourly closing-price EMA(20), EMA(50), and Wilder ATR(14) |
| Warmup | At least 250 completed hourly bars before the trading window; no warmup trades |
| Position | One whole CL contract, long only; $100,000 initial simulated capital |
| Desired market fills | Next available one-minute execution bar open strictly after signal confirmation |
| Stop | Protective sell stop, active after the entry fill; GTC protection across sessions |
| Cost placeholders | $3 per contract per side in fees; two adverse ticks per entry and exit |
| Exposure | Overnight positions allowed; close remaining exposure before the final session ends |
The capital and costs are teaching inputs, not current broker terms or a verified margin requirement. Specify the final liquidation timestamp and executable event before launching either run; use the same end treatment. If the engine cannot represent the signal timing, protection, costs, or final liquidation, resolve that mismatch before comparing reports.
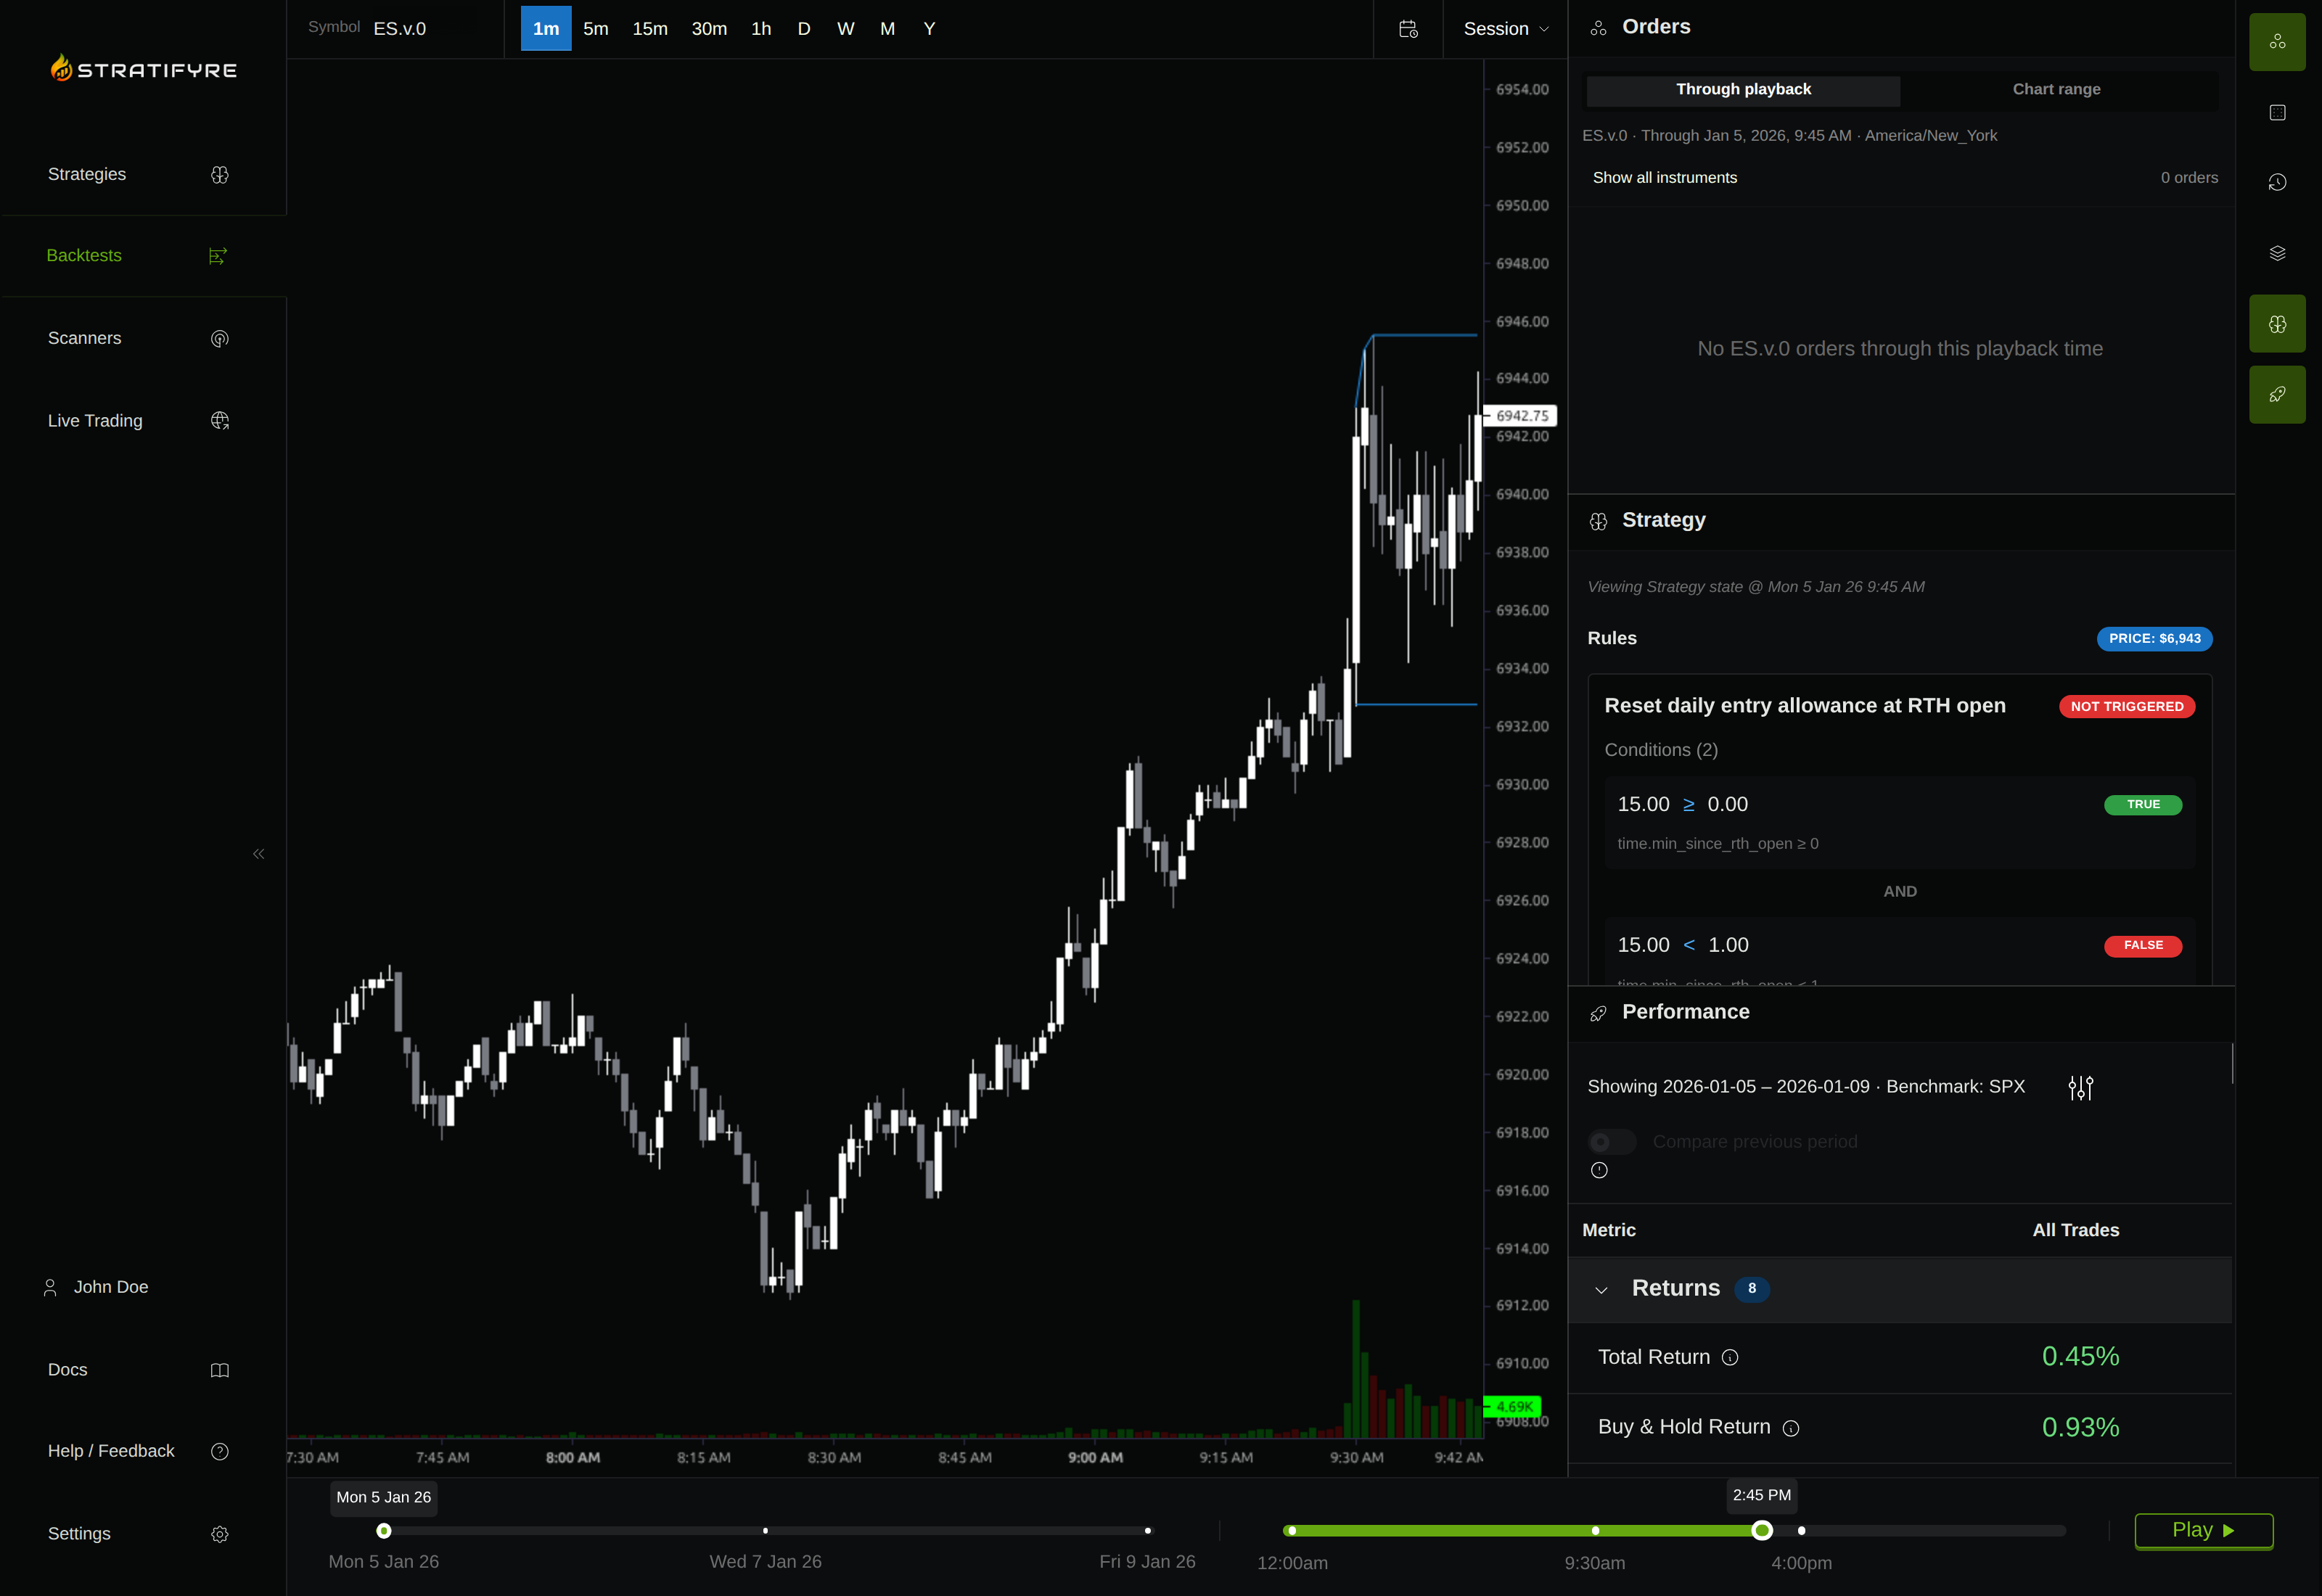
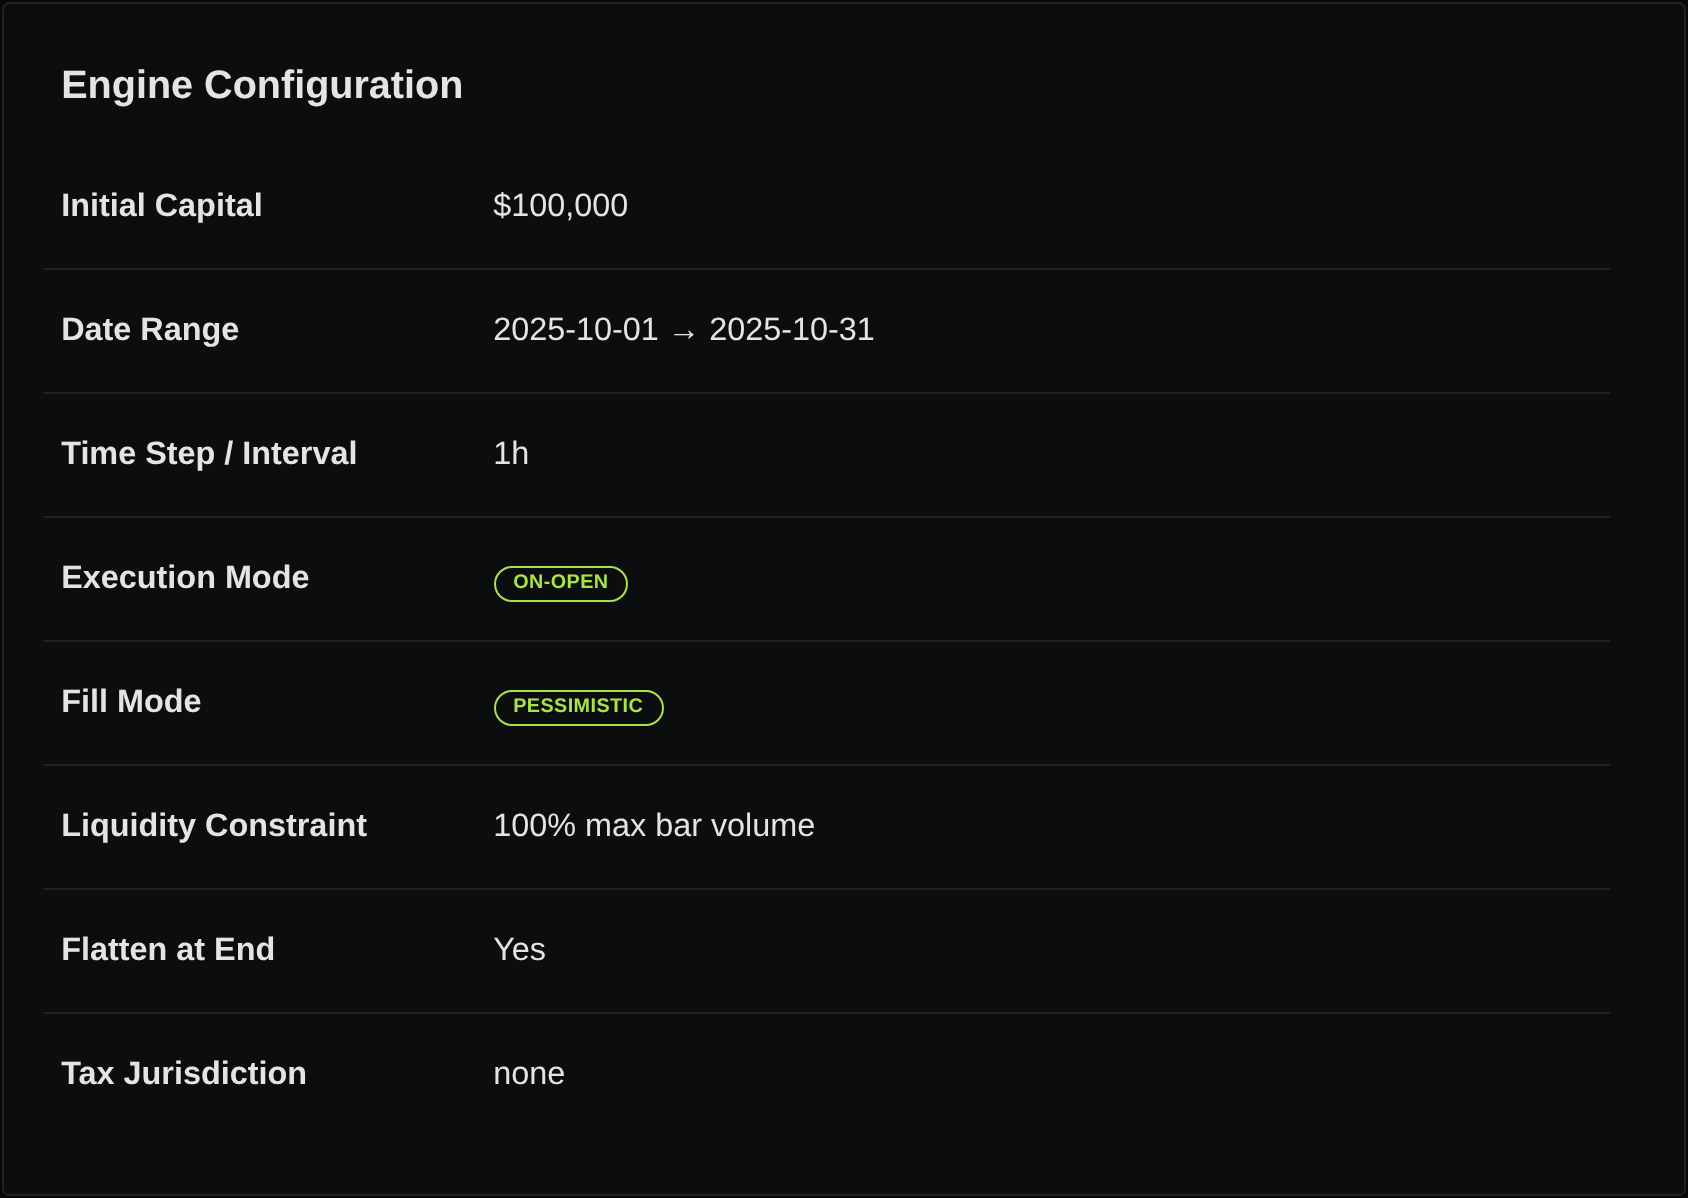
For the captured demonstration, the available instrument was FUT:CME:CL.v.0, a volume-continuous series. Both runs used October 1–31, 2025, $100,000 capital, one contract, hourly evaluation and execution, on-open mode, pessimistic fills, and flatten-at-end. An attempt to combine one-minute execution with hourly indicator sources failed a source-availability check even though the underlying market-data API supplied bars; the hourly comparison does not establish the proposed one-minute or CLZ5 outright execution.
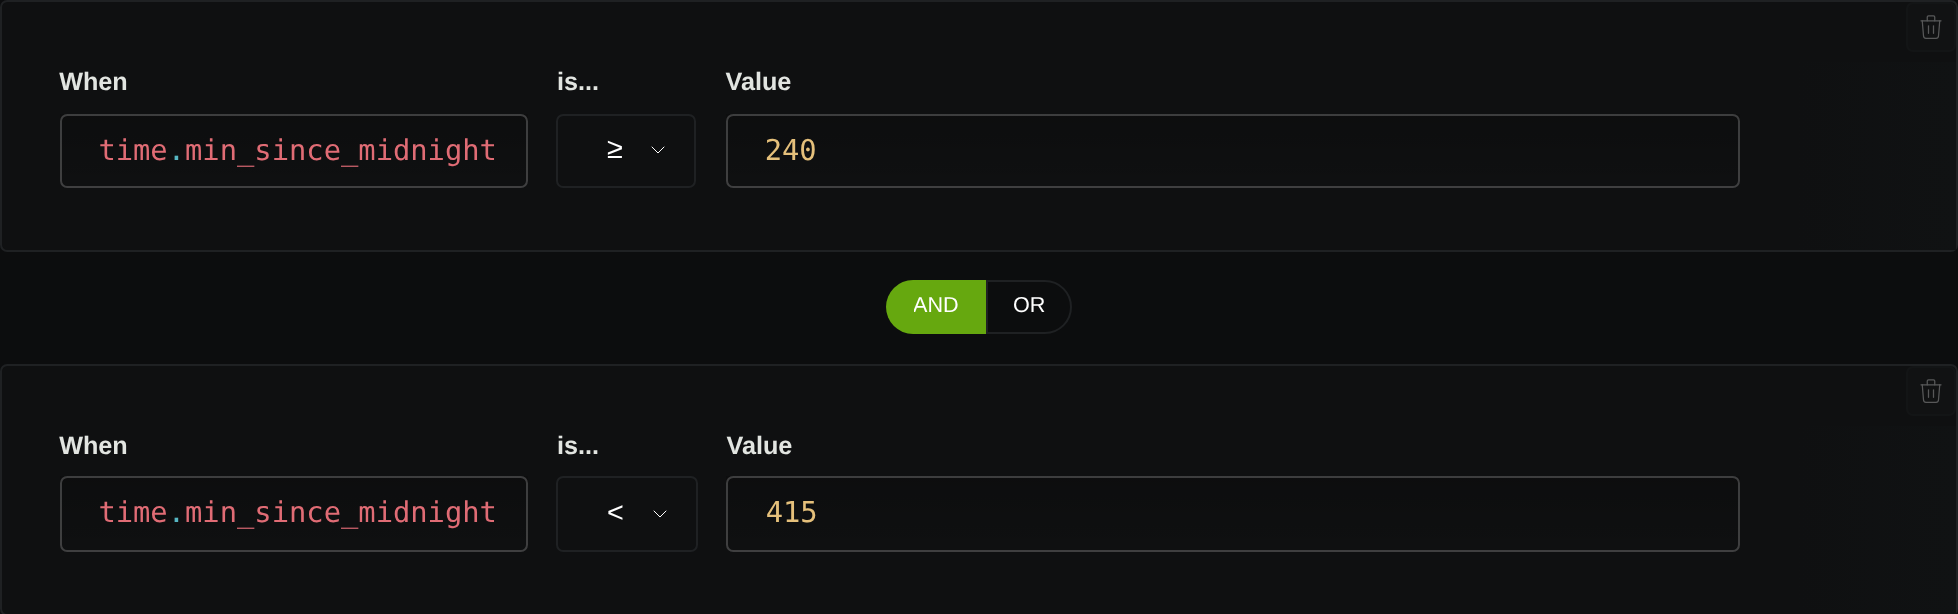
Both products normally trade Sunday through Friday, 5 p.m.–4 p.m. Central Time, with a daily maintenance break beginning at 4 p.m.; this is not a 24/7 calendar. Use America/Chicago for daylight-saving changes and consult the holiday schedule for the selected dates. CME’s WTI fact card gives the regular schedule; CME’s trading-hours calendar covers exceptions.
Change only the initial stop distance
Prespecify the two versions:
- Fixed: first fill minus $1.00 per barrel.
- ATR: first fill minus 2 × the hourly ATR saved at order submission.
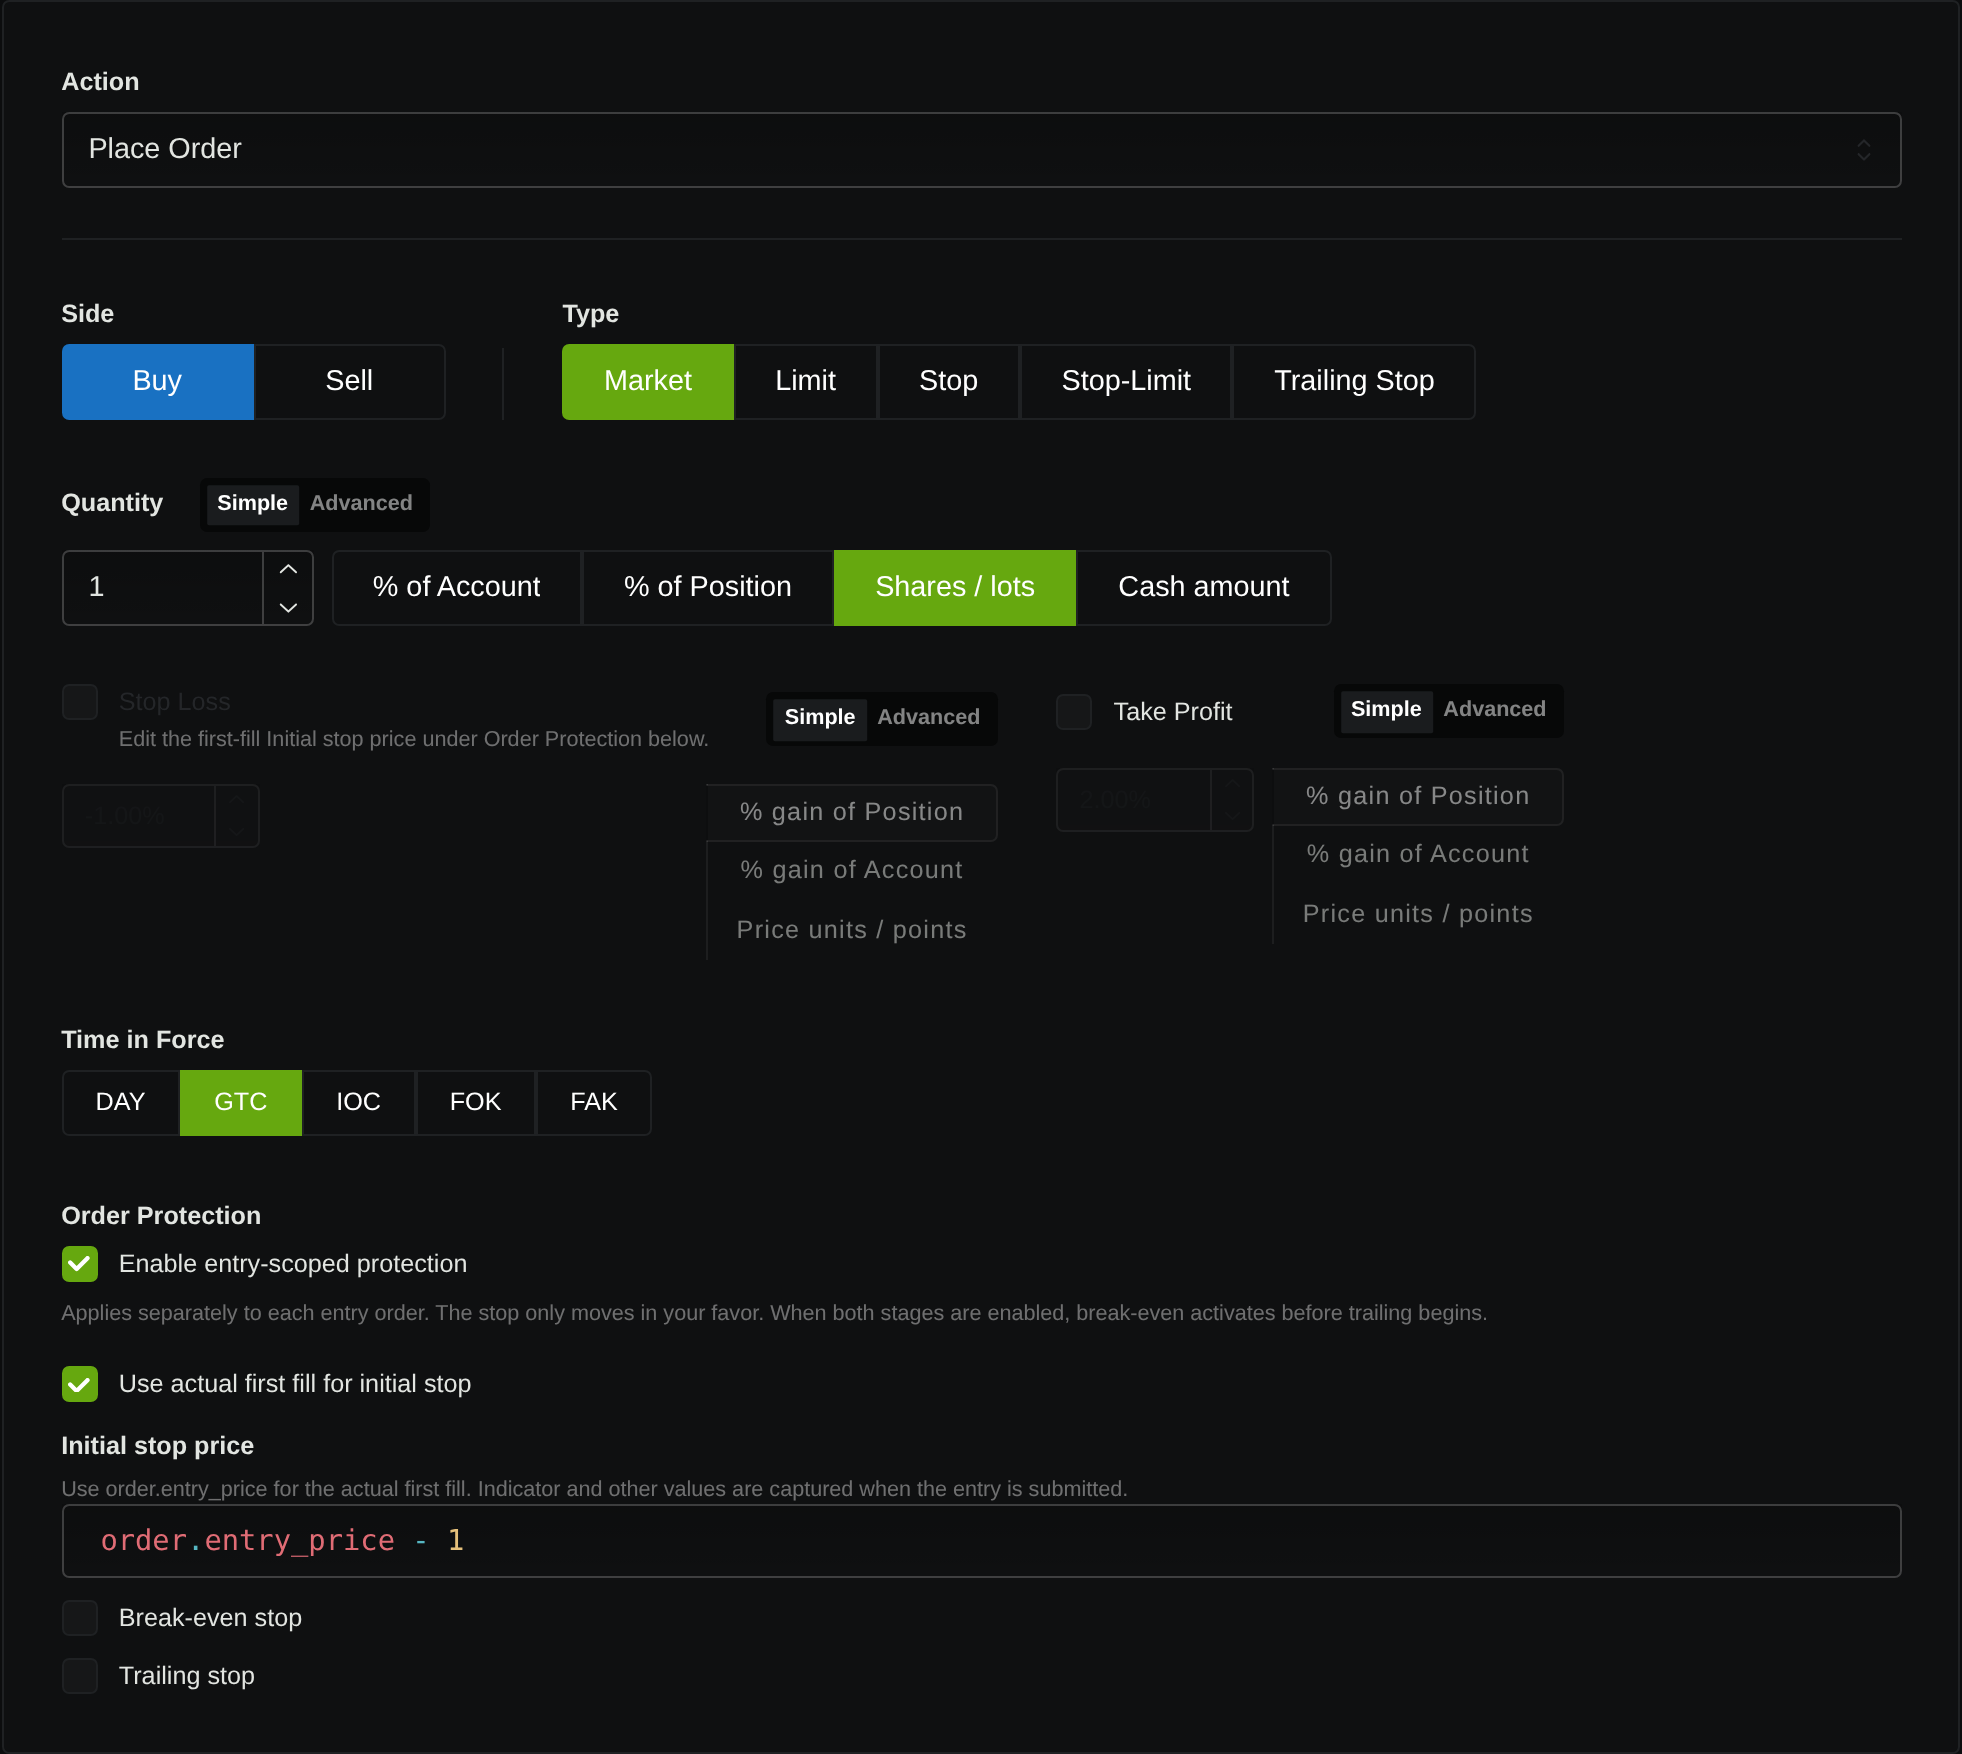
order.entry_price - 1, anchored to the actual first fill. Break-even and trailing stages are disabled.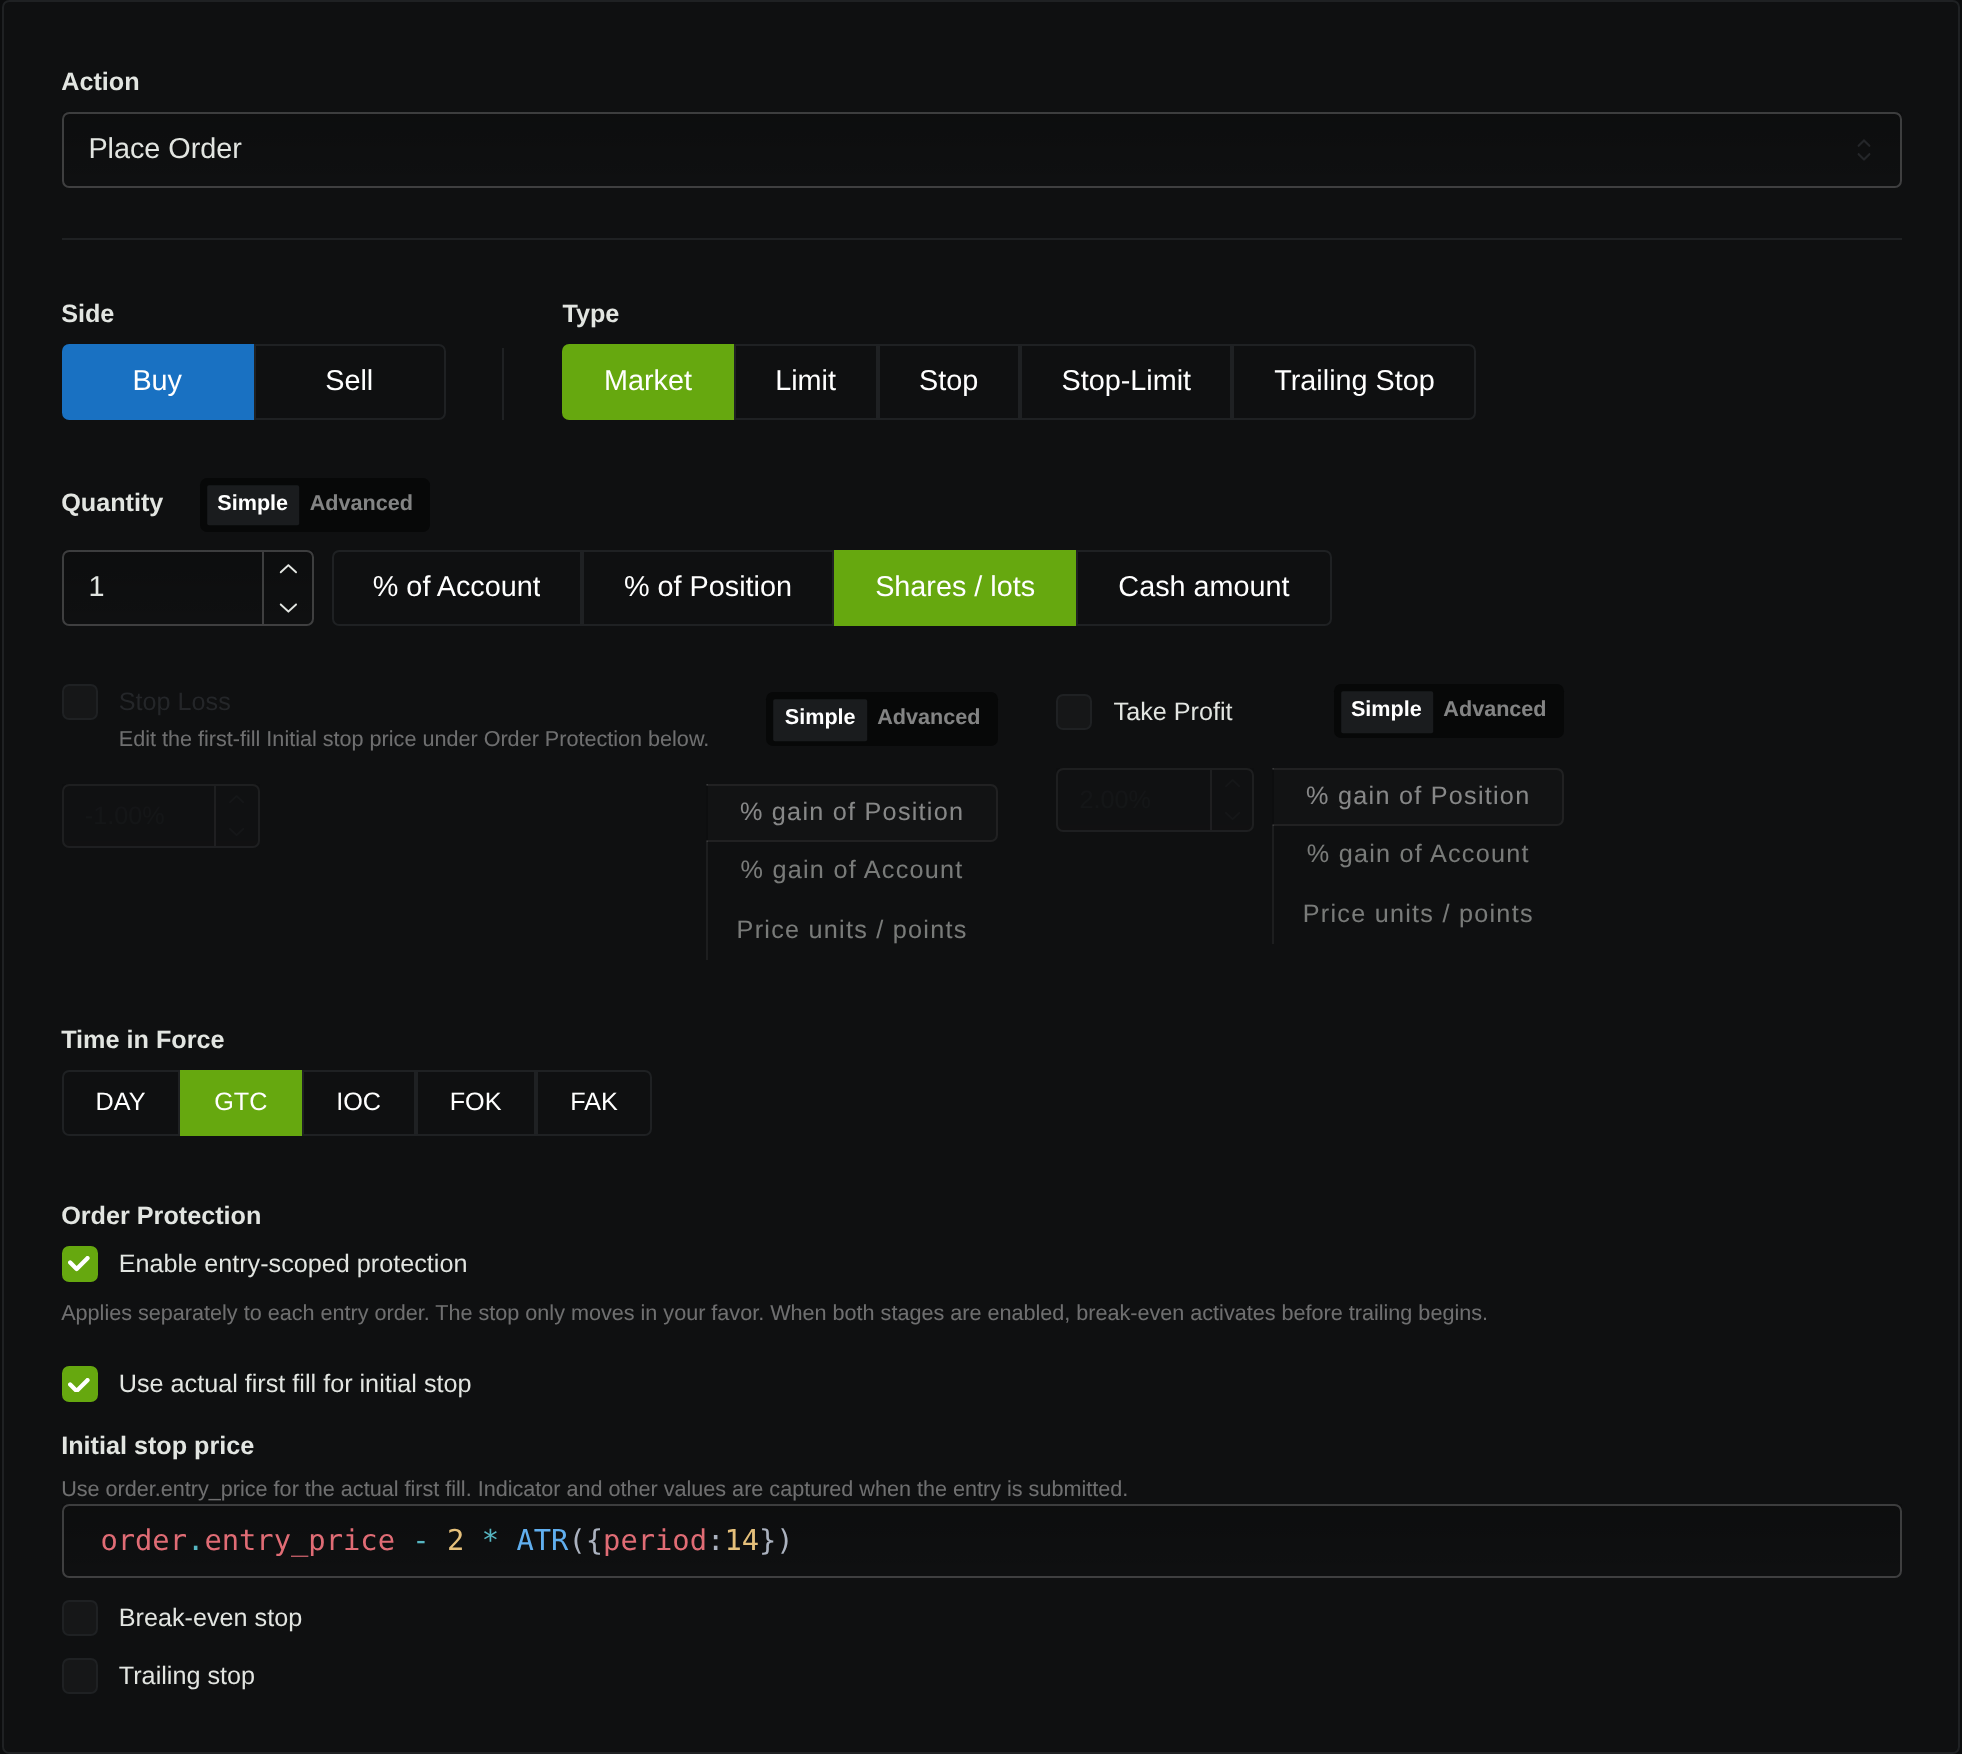
order.entry_price - 2 * ATR({period:14}). The editor states that ordinary indicator inputs are captured at submission while the entry price comes from the first fill.For an invented $75.00 fill and saved ATR of $0.30, the fixed stop is $74.00 and the ATR stop is $74.40. If the saved ATR were $0.80, the ATR stop would be $73.40. The second distance is wider because the submitted order saw greater recent volatility.
Keep the resulting trigger on the $0.01 tick grid. Save the actual rounded trigger and calculate risk from that price, rather than from an unrounded expression. For instance, a $0.307 ATR produces a raw $0.614 distance; the permitted trigger needs rounding, whose direction can change risk by a tick.
Check whether the generated order uses first-fill initial protection or a stop resolved at submission. This recipe requires the former, with ATR frozen at submission. A submission-price stop and a first-fill stop can have different distances after entry slippage. Stratifyre’s order-types documentation explains protective stop mechanics; confirm the saved configuration and an actual filled trade before calling either version implemented as specified.
Convert the stop into contract dollars
CL represents 1,000 barrels; MCL represents 100. Both quote dollars per barrel with a $0.01 minimum price increment. A tick therefore represents $10 per CL contract or $1 per MCL contract. CME’s CL rulebook and MCL rulebook establish those contract terms.
For one long contract:
Initial price risk = (entry fill − rounded stop trigger) × barrels per contract| Synthetic stop choice | Distance per barrel | One CL: price risk | One MCL: price risk |
|---|---|---|---|
| Fixed $1.00 | $1.00 | $1,000 | $100 |
| 2 × $0.30 ATR | $0.60 | $600 | $60 |
| 2 × $0.80 ATR | $1.60 | $1,600 | $160 |
These are arithmetic examples before fees, slippage, and gaps, not observed losses. MCL appears to explain contract scale; it is not a substitute dataset for the proposed CL experiment. Verify MCL independently before testing it.
An ATR stop does not maintain constant dollar risk with a fixed contract quantity. Higher ATR means a wider stop and greater initial dollars at risk. Changing quantity to compensate would add a second variable. If you later test risk-based sizing, include the contract multiplier in the denominator and round down to whole contracts; zero means skip the trade.
Inspect fills before comparing performance
An hourly entry signal and a one-minute execution clock serve different purposes. The former defines the trend; the latter provides finer observations for fills. Selecting a next-open mode does not itself prove that the signal used only completed hourly bars or that the first eligible minute was handled correctly.
Inspect an entry, a normal stop exit, and a gap-through exit where the data provides one. Record the signal confirmation time, order submission time, fill time and price, saved ATR, rounded trigger, and exit reason. Confirm that the stop survives a maintenance break and that an opposite-cross exit cancels its protective order. Missing cases remain unverified.
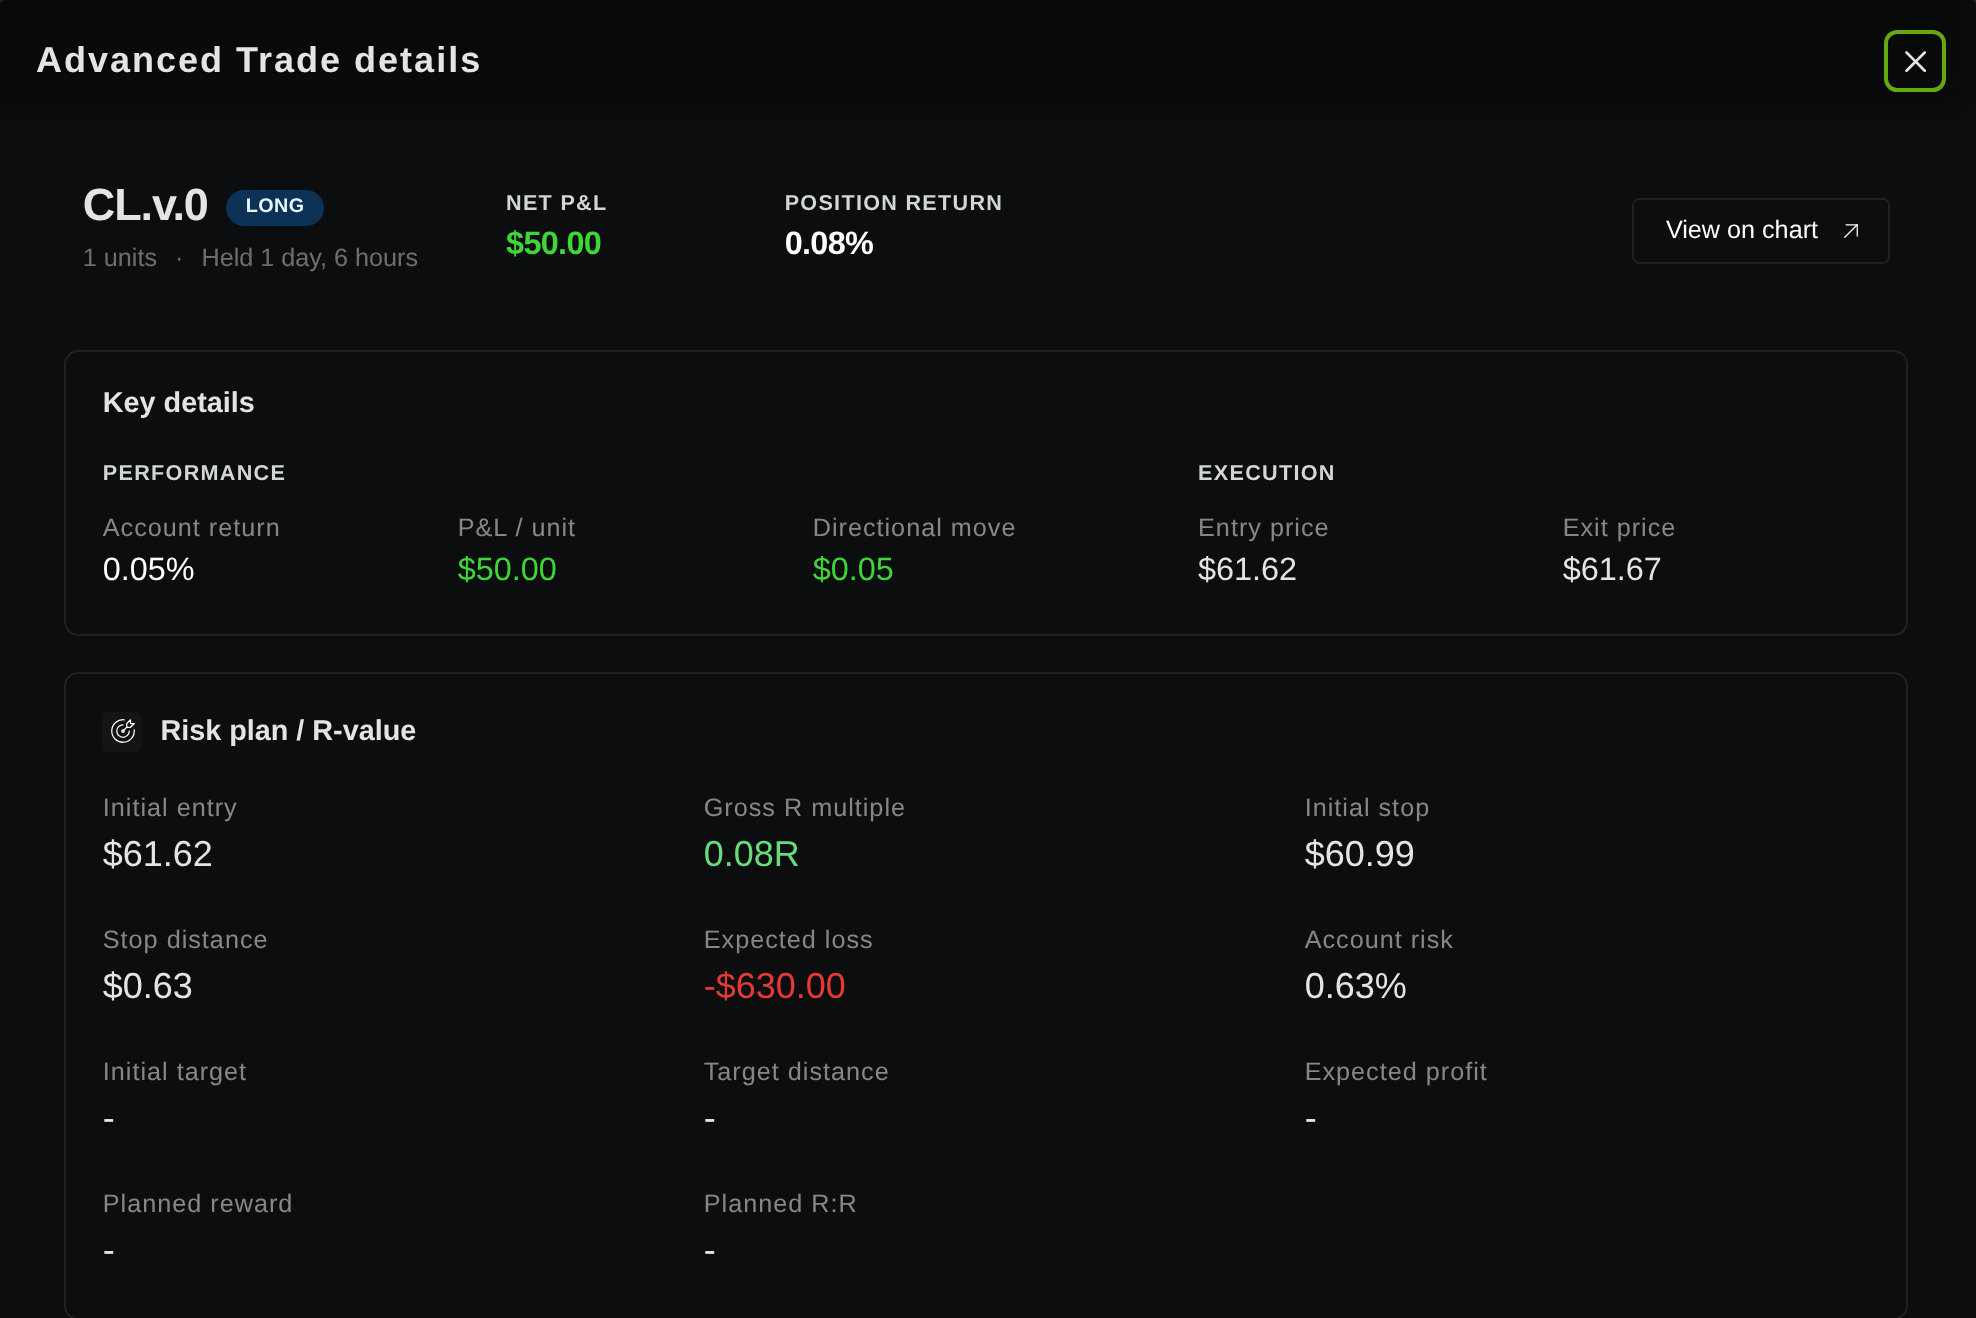
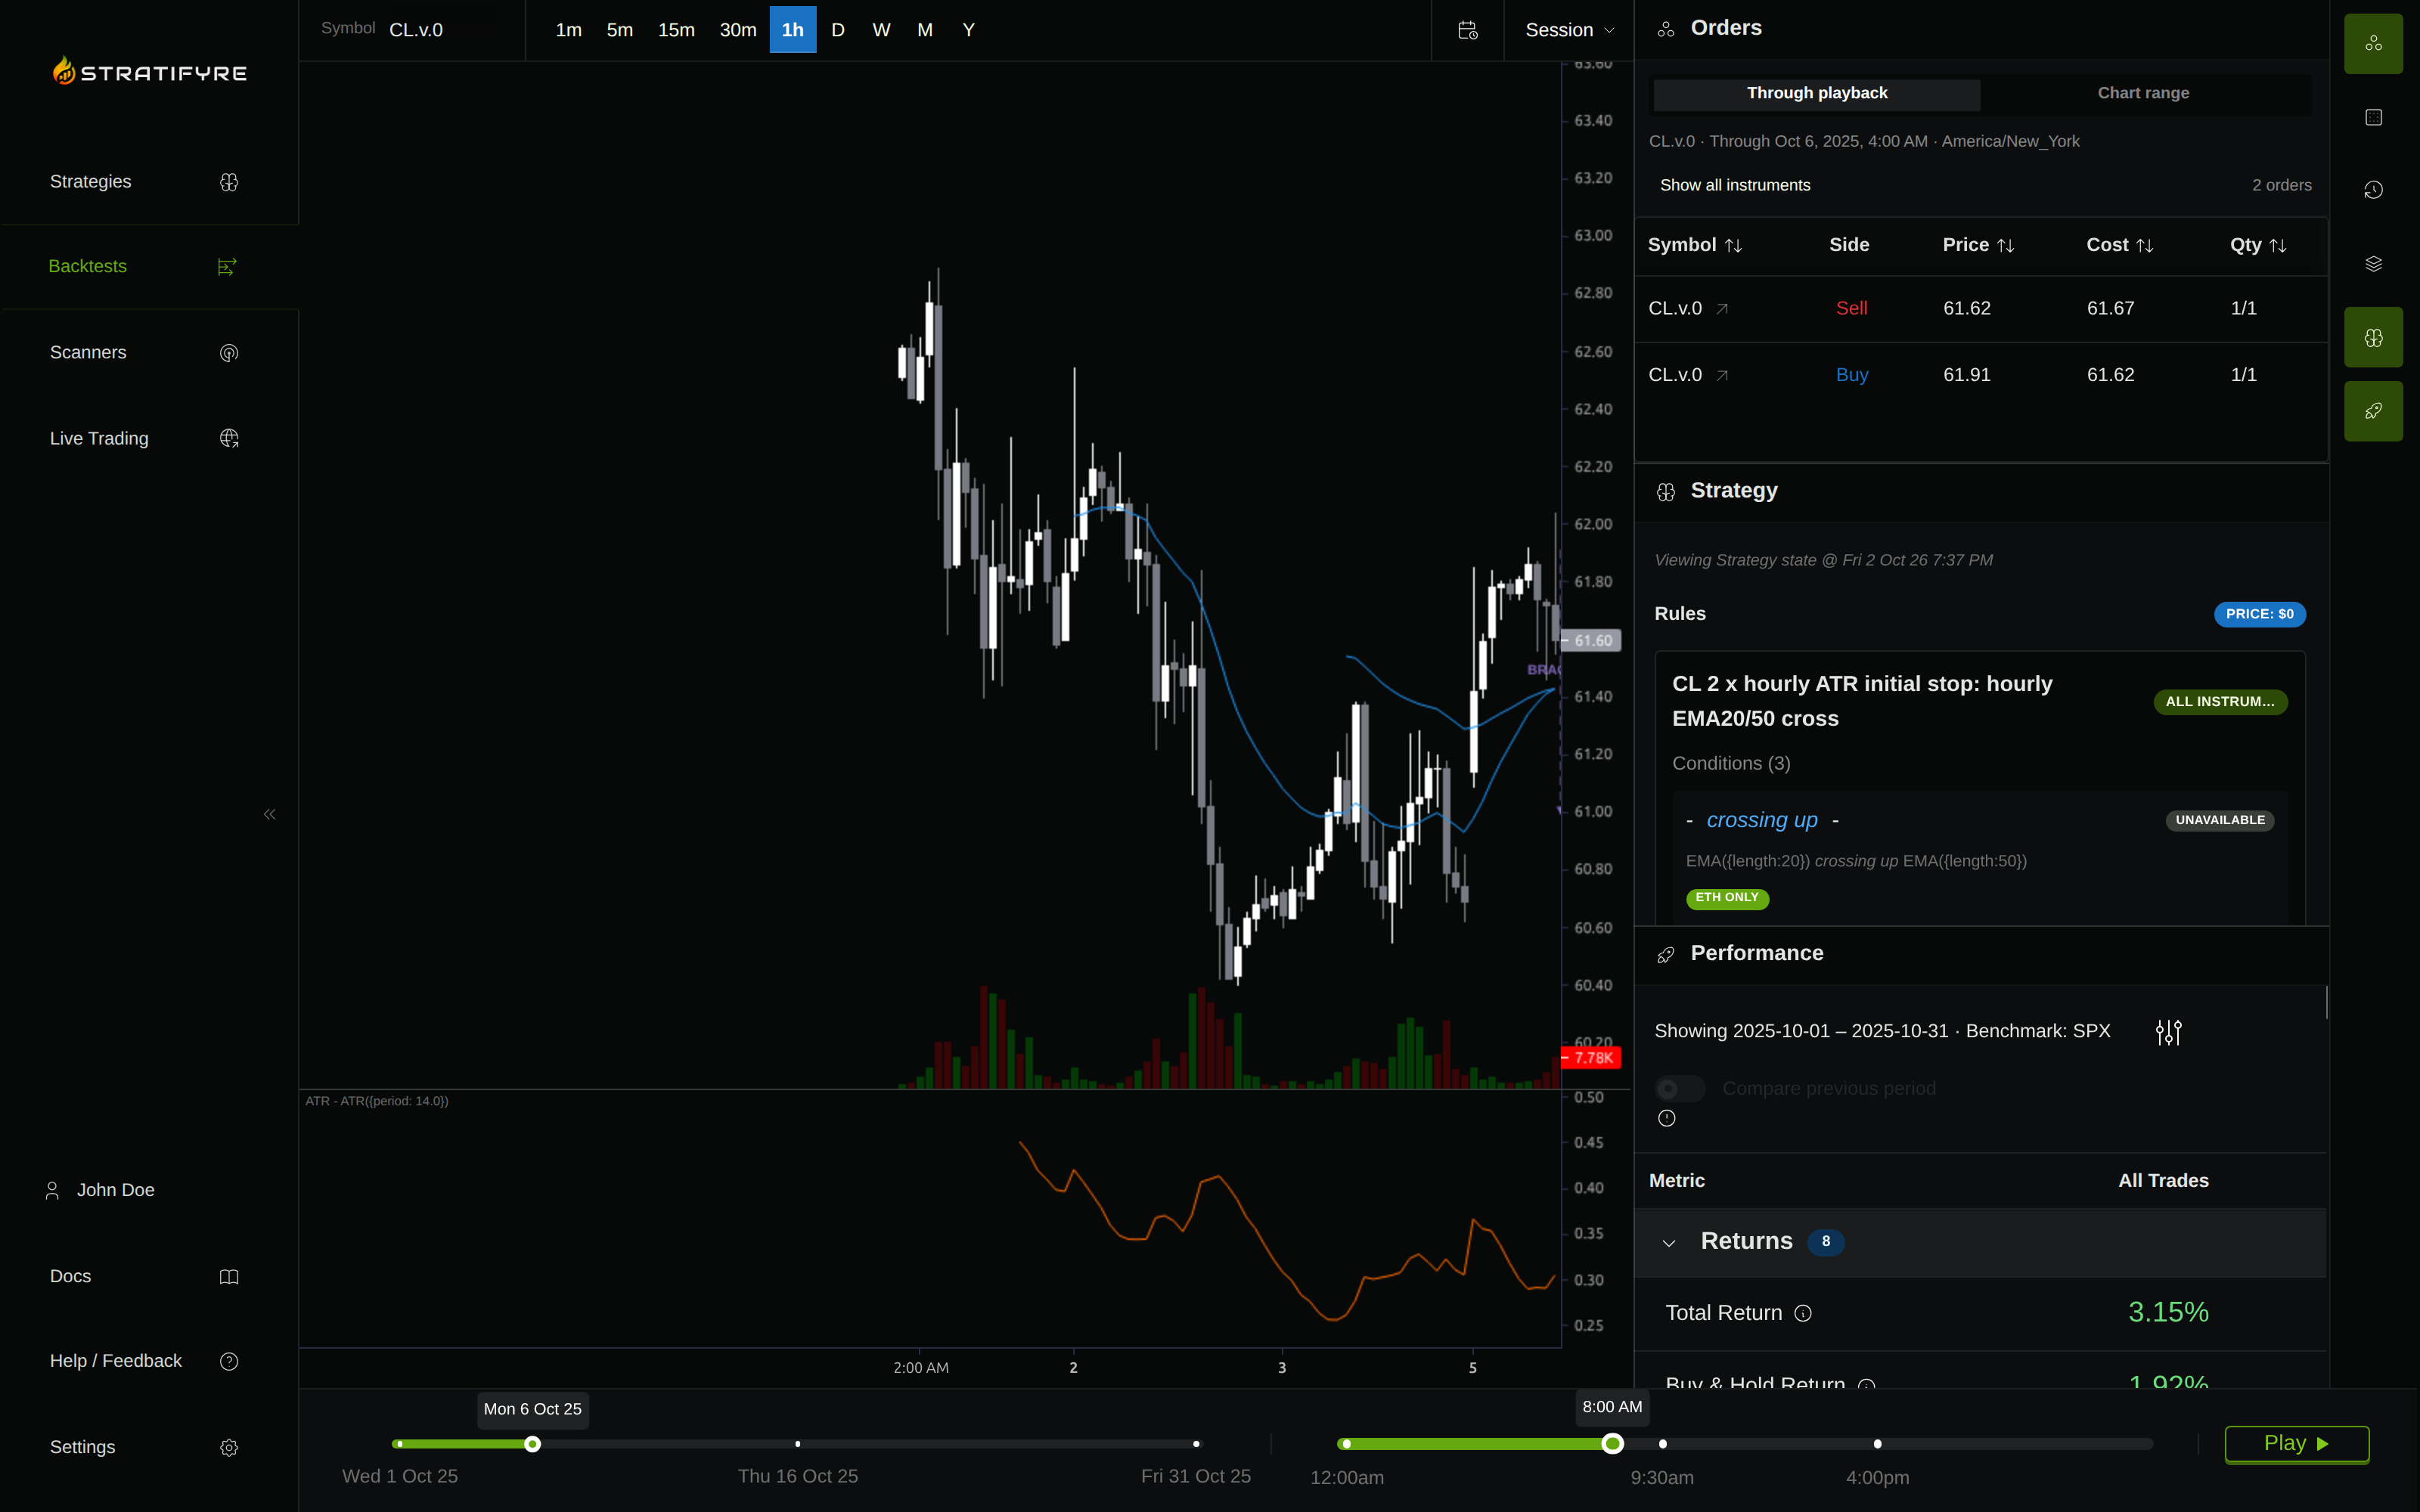
For another synthetic example, a $74.40 sell stop followed by a $74.10 opening price has $0.90 of adverse movement from a $75.00 entry, before additional slippage. That is $900 on one CL contract, exceeding the $600 trigger-distance estimate. A stop trigger is not a guaranteed fill price.
The proposed two-tick adverse slippage is $20 per CL side. With the $3 fee placeholder, a one-contract entry and exit add $46 of modeled friction. Verify whether the settings charge per contract, per fill, or per order; partial fills can change that accounting. Do not assume MCL has the same execution quality or the same percentage cost burden.
Compare the losses and the opportunities
After obtaining two completed, reconciled runs, compare net P&L alongside maximum drawdown in dollars, largest realized loss, fees, time in market, and trade count. More surviving trades are useful only if their later outcomes justify the additional risk and costs.
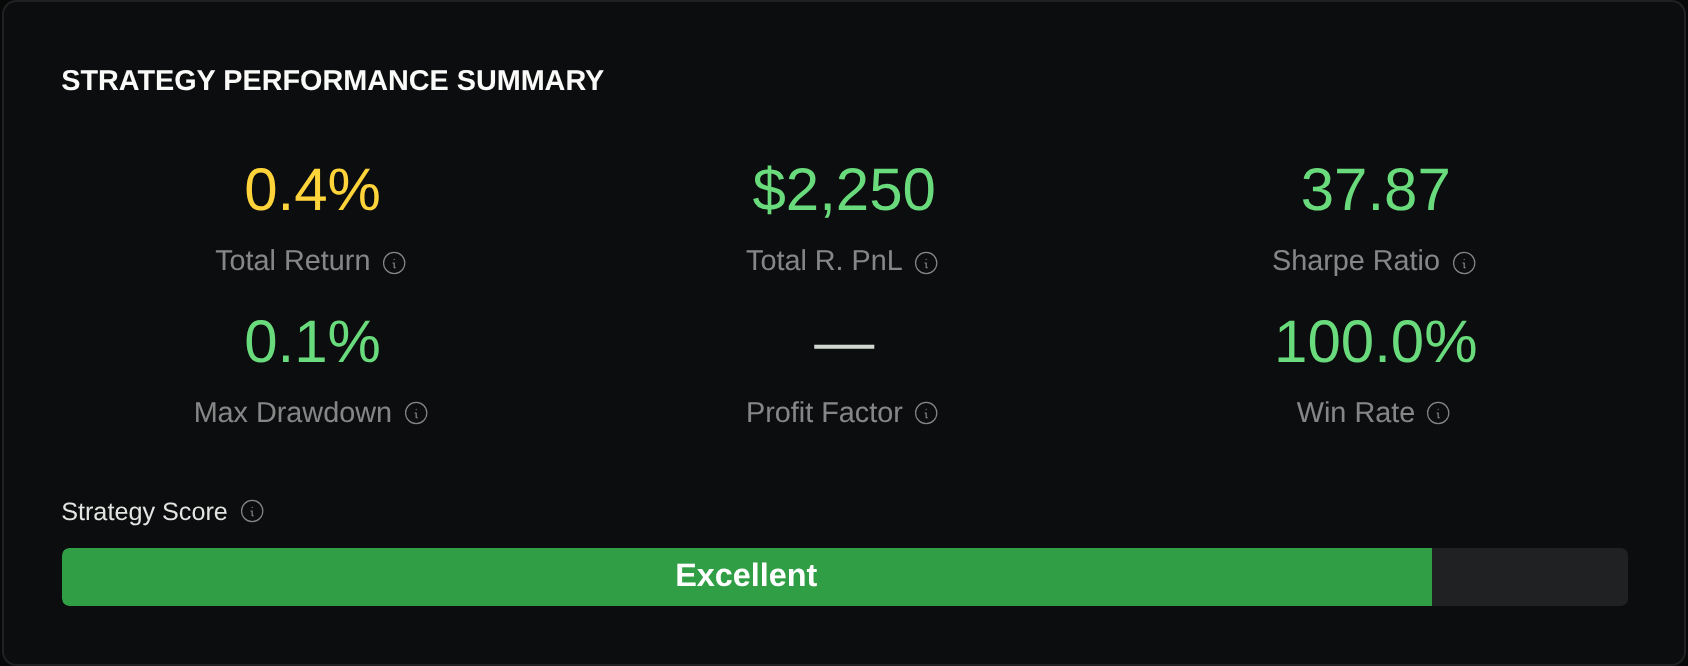
The completed demo reports show three trades each: $2,910 reported P&L for the fixed stop and $3,150 for the ATR stop, with $2,110 maximum drawdown in both API reports. These are provisional product outputs. Every completed trade reports zero fees despite a $3 futures-fee setting, and the stop/replay discrepancy above remains unresolved; the figures do not establish an ATR advantage after costs.
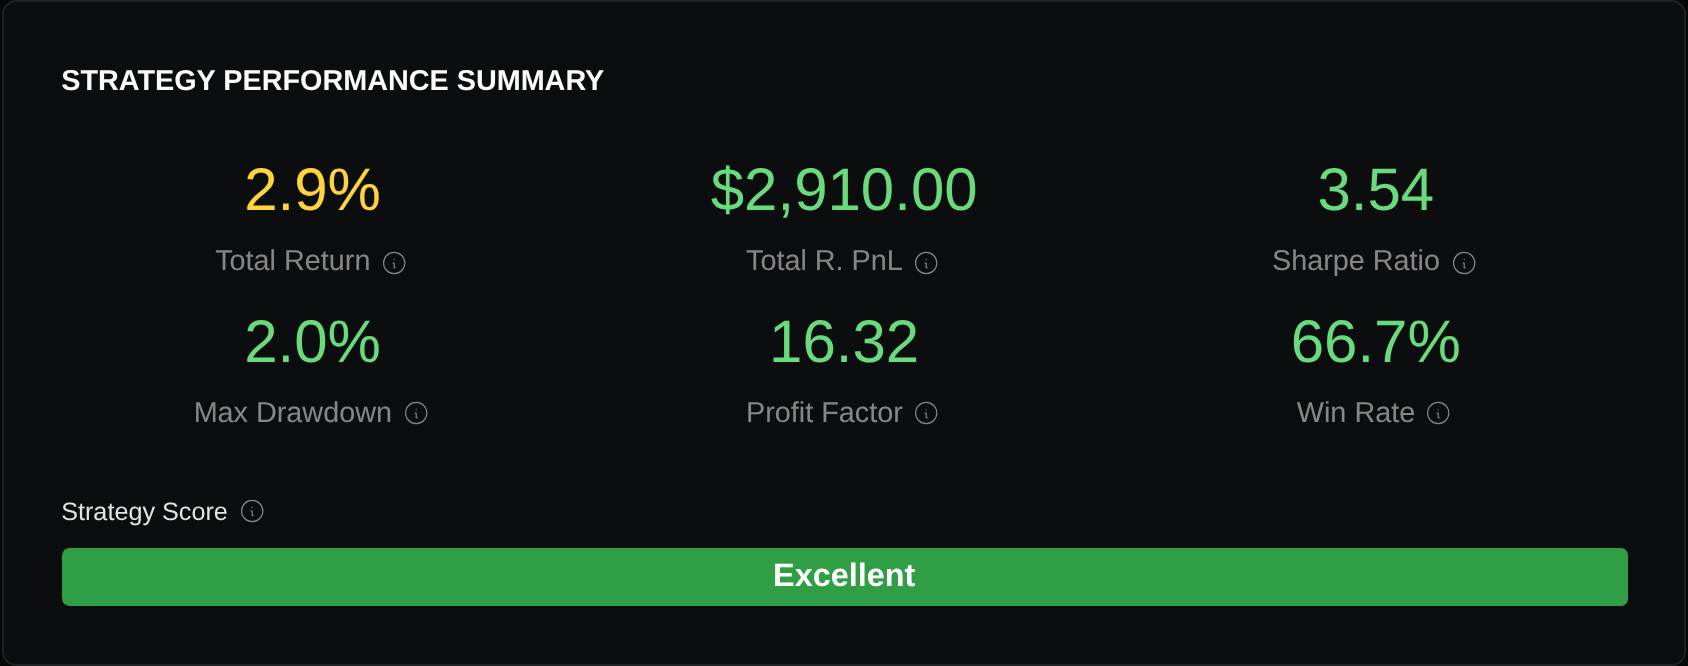
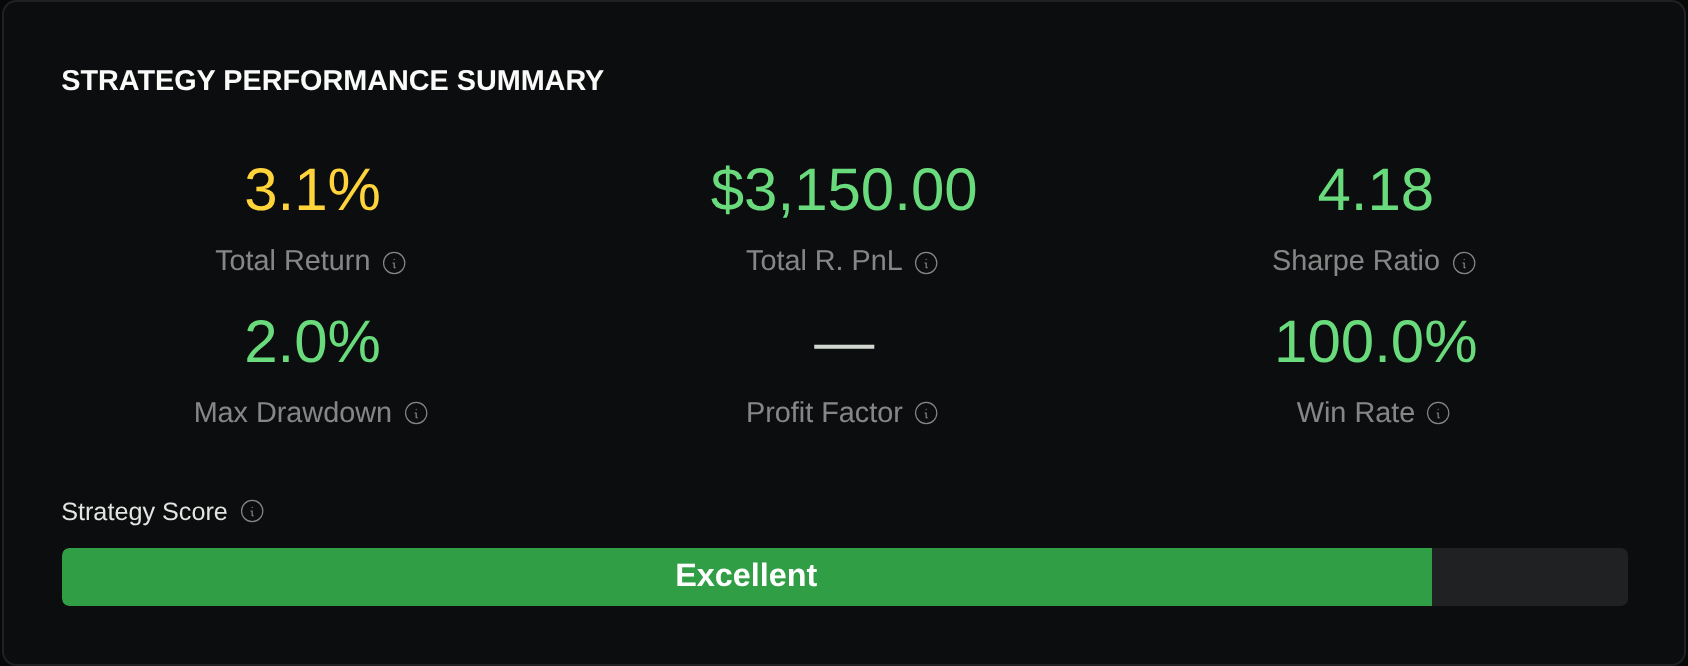
Identical entry rules do not guarantee identical trade lists. An earlier stop can make one version flat for the next cross while the other remains invested. Compare both the underlying signal times and the orders each version accepted; do not pair unrelated trades as if only their exit changed.
Before running, define a low-ATR group as submitted orders with ATR at or below $0.40, a high-ATR group at or above $0.80, and a middle group for the remainder. These are teaching thresholds, not measured oil regimes. Review counts and losses within each group using the saved submission ATR. A group with few trades cannot establish which stop is better.
The outright-contract experiment deliberately avoids a contract switch. For a later continuous-series test, first inspect which contract supplied each bar, the roll rule, price adjustments, and whether positions are actually closed and reopened. A stitched price jump can contaminate true range and ATR; a smooth chart cannot establish executable rollover.
CL has physical-delivery terms. MCL settles financially and stops trading one business day before the corresponding CL expiry. Confirm exact dates in CME’s expiration calendar; do not copy an expiry or roll policy between them. The MCL rulebook specifies its settlement and termination relationship.
If one stop looks preferable, keep its settings fixed and test another prespecified contract window with fresh warmup. The useful decision is whether the changed exit produced acceptable losses and costs across the examined conditions, not whether ATR sounds more sophisticated.
Use Stratifyre’s backtesting workflow to test one exit change while keeping your oil entry rules fixed, then inspect the trades that explain the difference.
Put your strategy rules to the test
Build your strategy, inspect historical trades, and review the assumptions behind your results.
Build and test your strategy