Multi-timeframe backtesting: when is the hourly candle usable?
Audit a five-minute entry with an hourly filter by checking completed candles, source coverage, and actual fill timestamps before comparing returns.
Before a five-minute entry uses an hourly filter, check when that hour ended, which version of its candle the rule saw, and when the order filled. An hourly candle labelled 00:00 contains prices through 01:00; its final close cannot justify an entry at 00:25.
We saved and ran a small Binance BTC/USDT experiment to inspect that boundary. The hourly-filter run failed during source loading, while the baseline returned fills that did not match our intended completed-candle timing. These observations provide an audit example, not a successful filter demonstration or a valid performance comparison.
Separate the candle label from its availability
For a continuous market using these UTC buckets, the hour opening at 00:00 covers the period up to 01:00. Its opening timestamp identifies the candle; it does not mean every price in the candle was known at 00:00.
Three different inputs can look like an “hourly close”:
- Developing close: the latest known price inside the unfinished hour. It can change before 01:00.
- Completed close: the final value after the hour ends.
- Previous candle: a historical index relative to the series currently exposed to the rule.
Developing data can be causal if it contains only observations already received. It still defines a different filter from “use the last completed hour.” An offset such as [1] selects history; its timing depends on which candle occupies index zero.
TradingView documents the same general distinction and explains how higher-timeframe requests can expose future historical values or change before confirmation. Its offset and lookahead controls are specific to Pine Script; they are not interchangeable with Stratifyre expressions. TradingView higher-timeframe documentation.
Inspect the last five minutes of the hour
The following table is author analysis of actual returned Binance BTC/USDT candles for January 11, 2025, with times in UTC and prices in USDT. The hourly candle opening at 00:00 opened at 94,726.10 and eventually closed at 94,600.69.
| Five-minute opening label | Five-minute close | When that five-minute close is complete | Is the 00:00 hour complete? |
|---|---|---|---|
| 00:45 | 94,391.13 | 00:50 | No |
| 00:50 | 94,523.46 | 00:55 | No |
| 00:55 | 94,600.69 | 01:00 | Yes, at this boundary |
| 01:00 | 94,684.07 | 01:05 | The previous hour is complete; the new hour is developing |
At 00:55, the last completed five-minute candle closes at 94,523.46. Treating the eventual hourly close of 94,600.69 as already available would import the next five minutes into the decision.
At 01:00, that hourly close becomes complete, assuming the required observations arrived. A fill using that completed information must follow the observation and order-submission sequence; completion does not grant a fill at the hour’s earlier 00:00 open.
Stratifyre’s current runtime source reconstructs developing auxiliary candles from completed finer observations. At an exact boundary, the latest candle can itself be the just-completed hour; a fixed [1] can then select an older hour until the new developing candle appears. Therefore verify the candle identity at the boundary instead of assuming [1] always means the newest completed hour. Our failed filtered run did not establish its deployed boundary behavior.
Save the filter and control the comparison
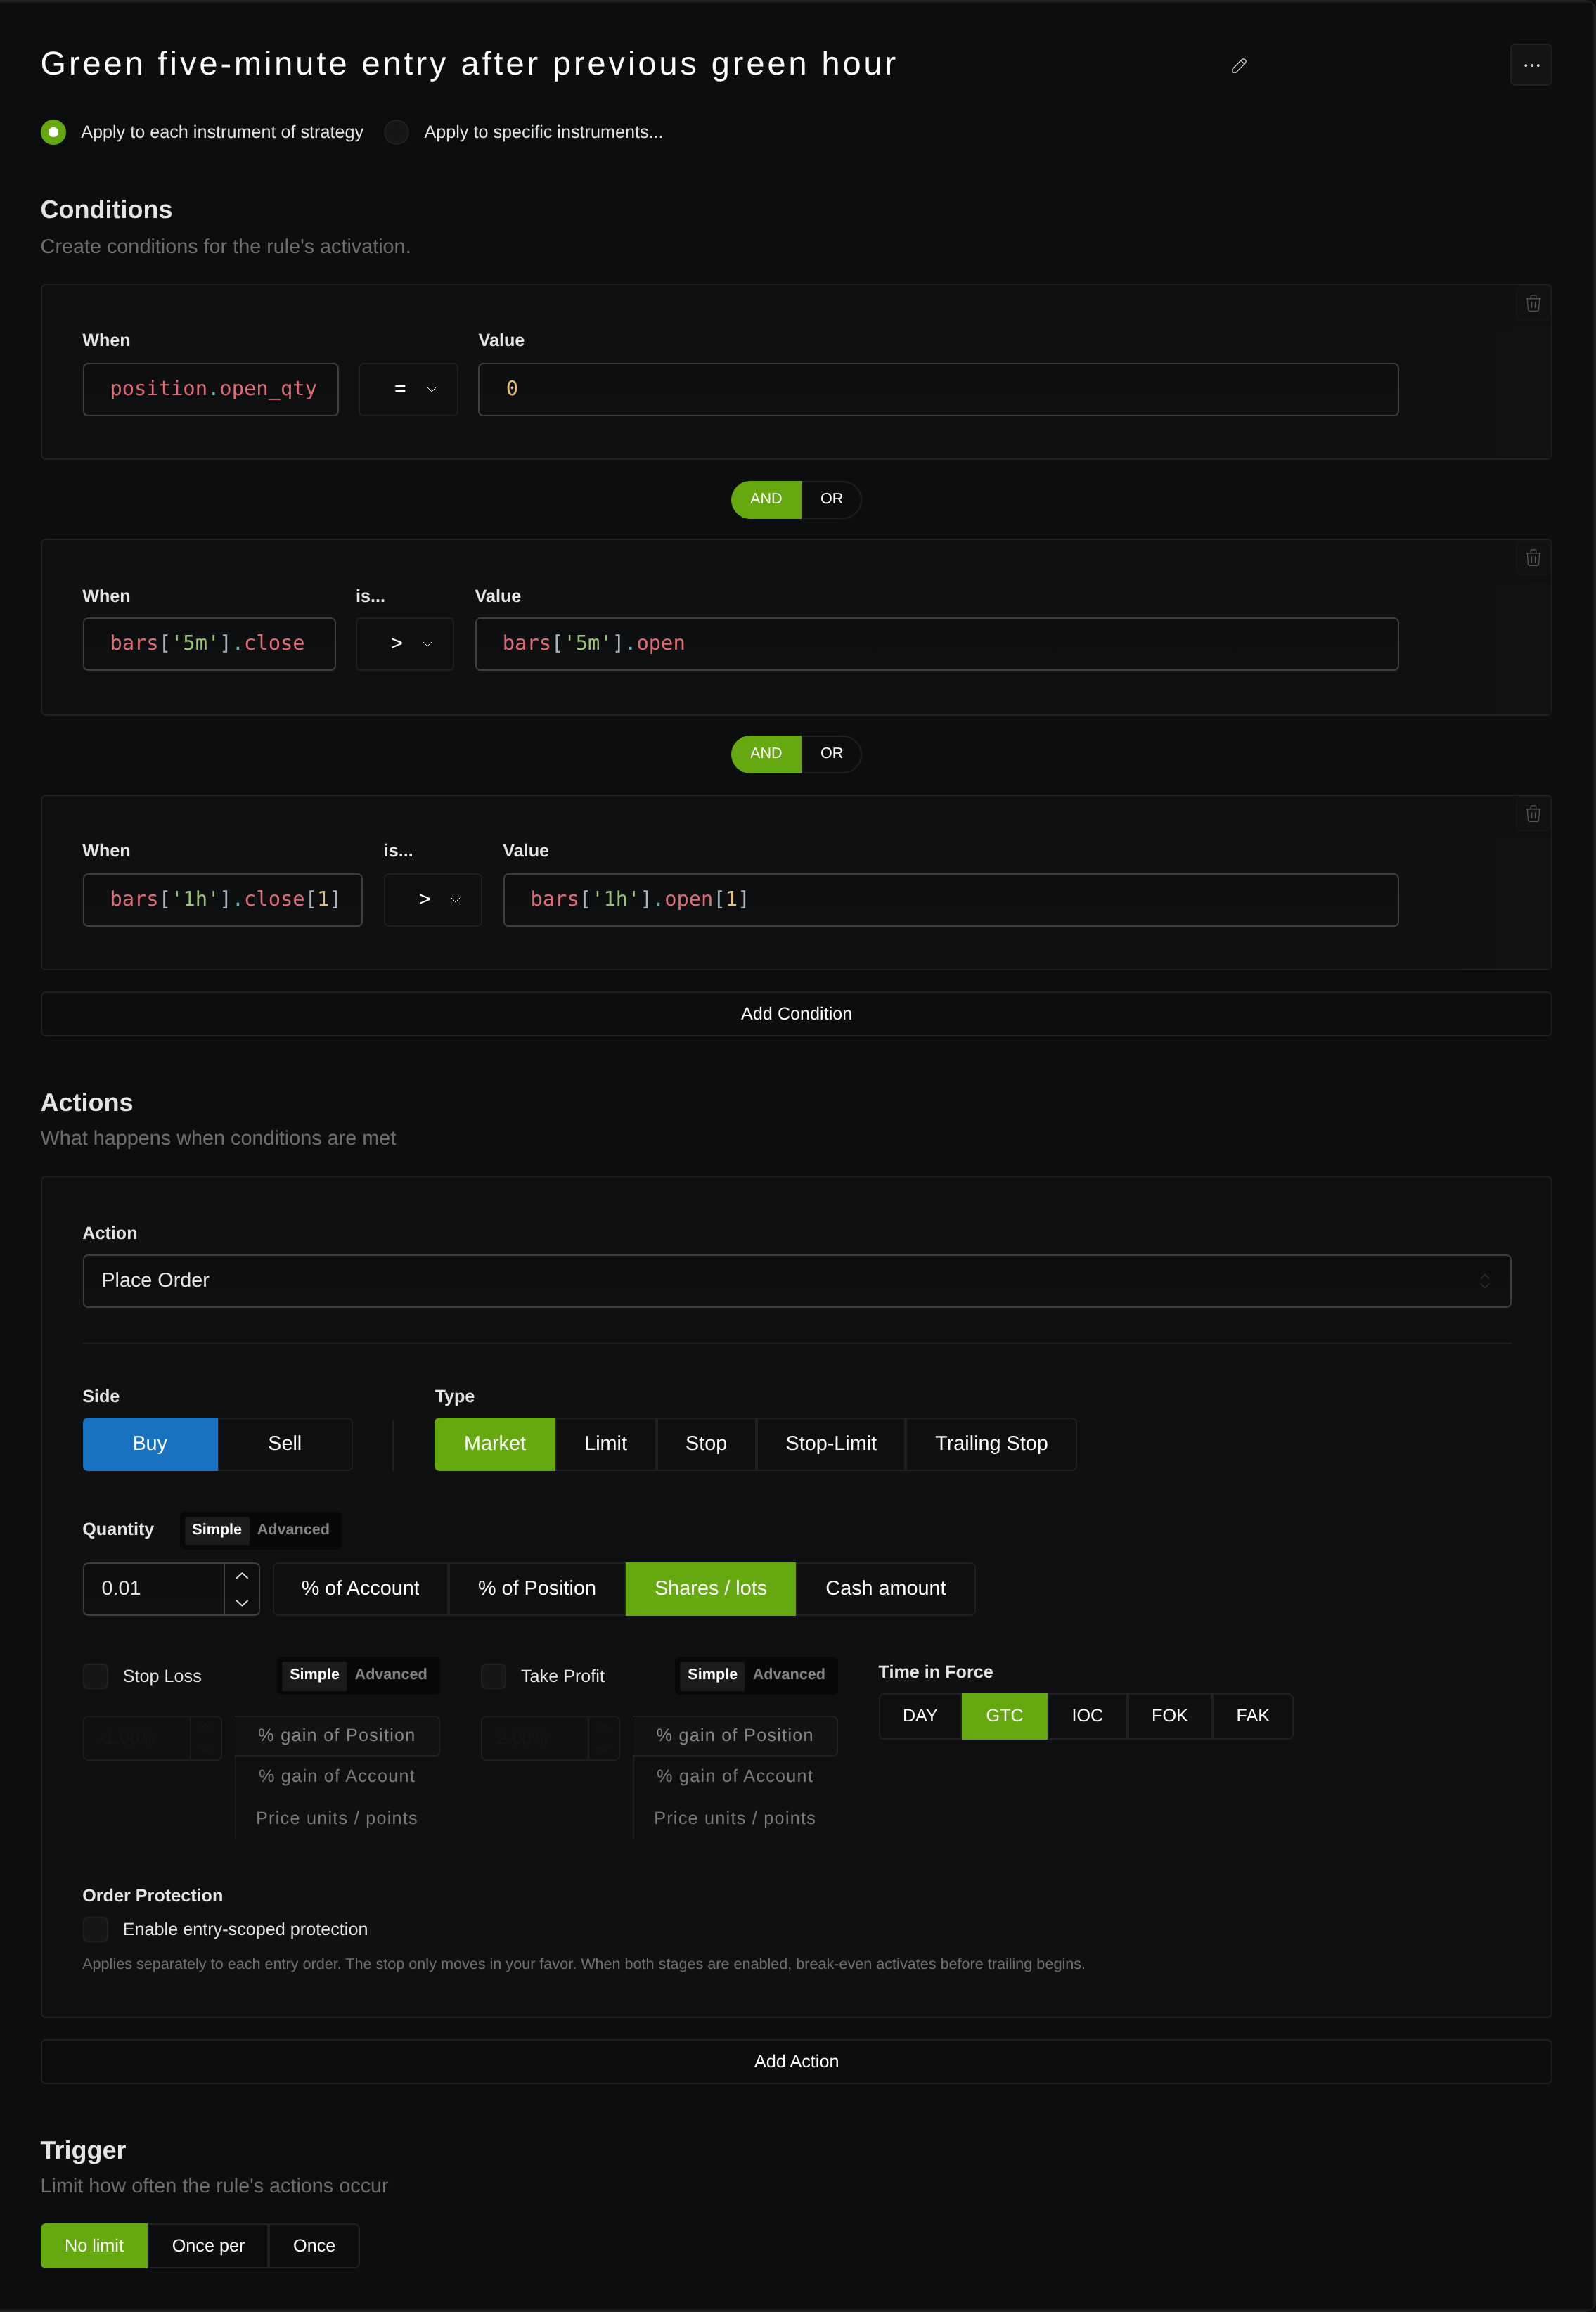
Our prespecified entry was deliberately simple: while flat, buy 0.01 BTC when a five-minute candle closes above its open. Exit on a five-minute candle closing below its open. The filtered version added a green previous-hour requirement:
position.open_qty = 0AND bars['5m'].close > bars['5m'].openAND bars['1h'].close[1] > bars['1h'].open[1]The baseline omitted only the hourly condition. Both saved configurations requested January 11, 2025, a 5m timestep, $10,000 initial capital, On-Open execution, pessimistic fill mode, final flattening, and zero configured commission/slippage. Zero costs isolate this timing diagnostic; they do not describe executable trading economics.
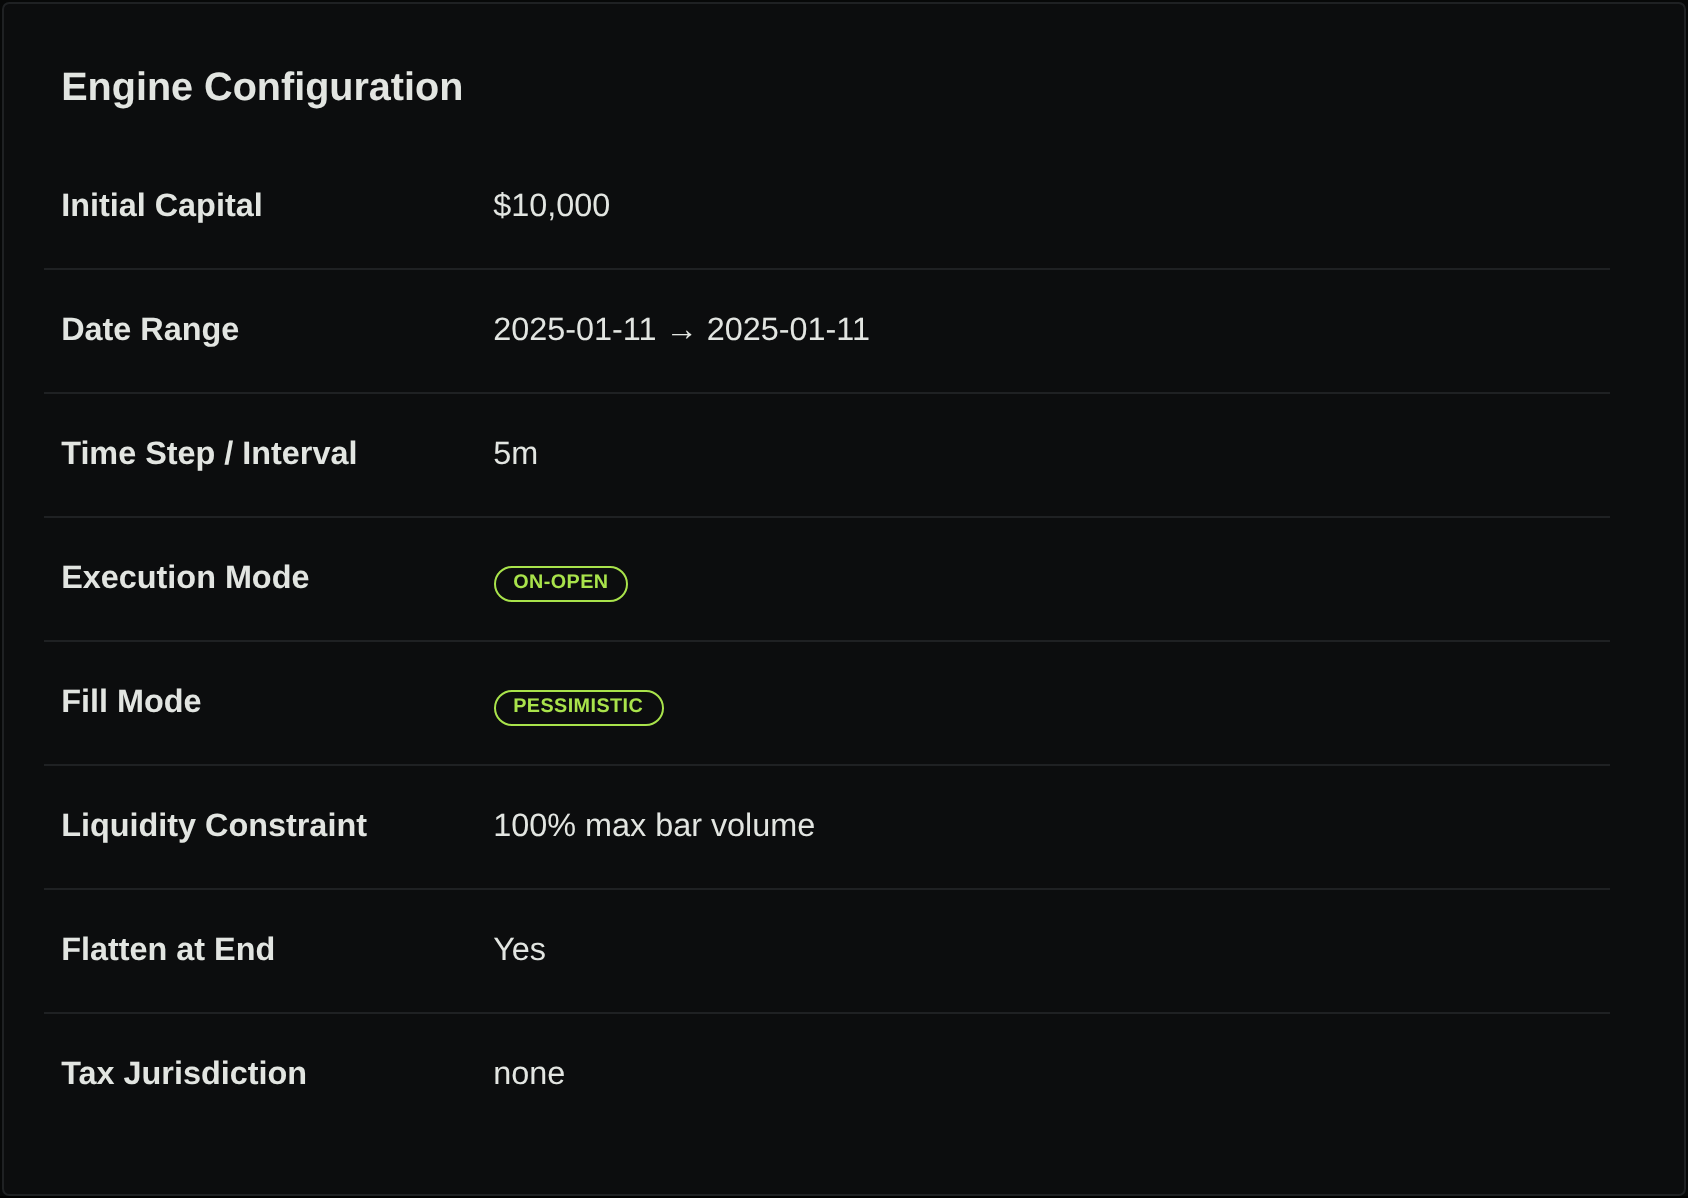
These are signal timeframes: five minutes defines the entry, and one hour defines its context. Changing to one-second execution data answers another question. See the existing one-second versus one-minute fill analysis for that distinction.
Coverage passed through one channel and failed through another
The historical marketdata requests returned 1,560 minute candles, 312 five-minute candles and 26 hourly candles from January 10 at 22:00 through January 12 at 00:00 UTC, including warmup. Each returned series had consecutive interval openings without gaps.
The saved hourly-filter job nevertheless ended in ERROR, with zero trades and no performance report. Its runtime event reported missing source coverage for the hour at the minute opening January 10, 22:59 UTC, with a 23:00 UTC decision cutoff.
That exact minute exists in the separate returned marketdata: it opens at 94,797.32 and closes at 94,767.70. This establishes availability through that endpoint; it does not prove that the job’s dependency loader delivered it. Calling this “no Binance data” would overstate the observation.
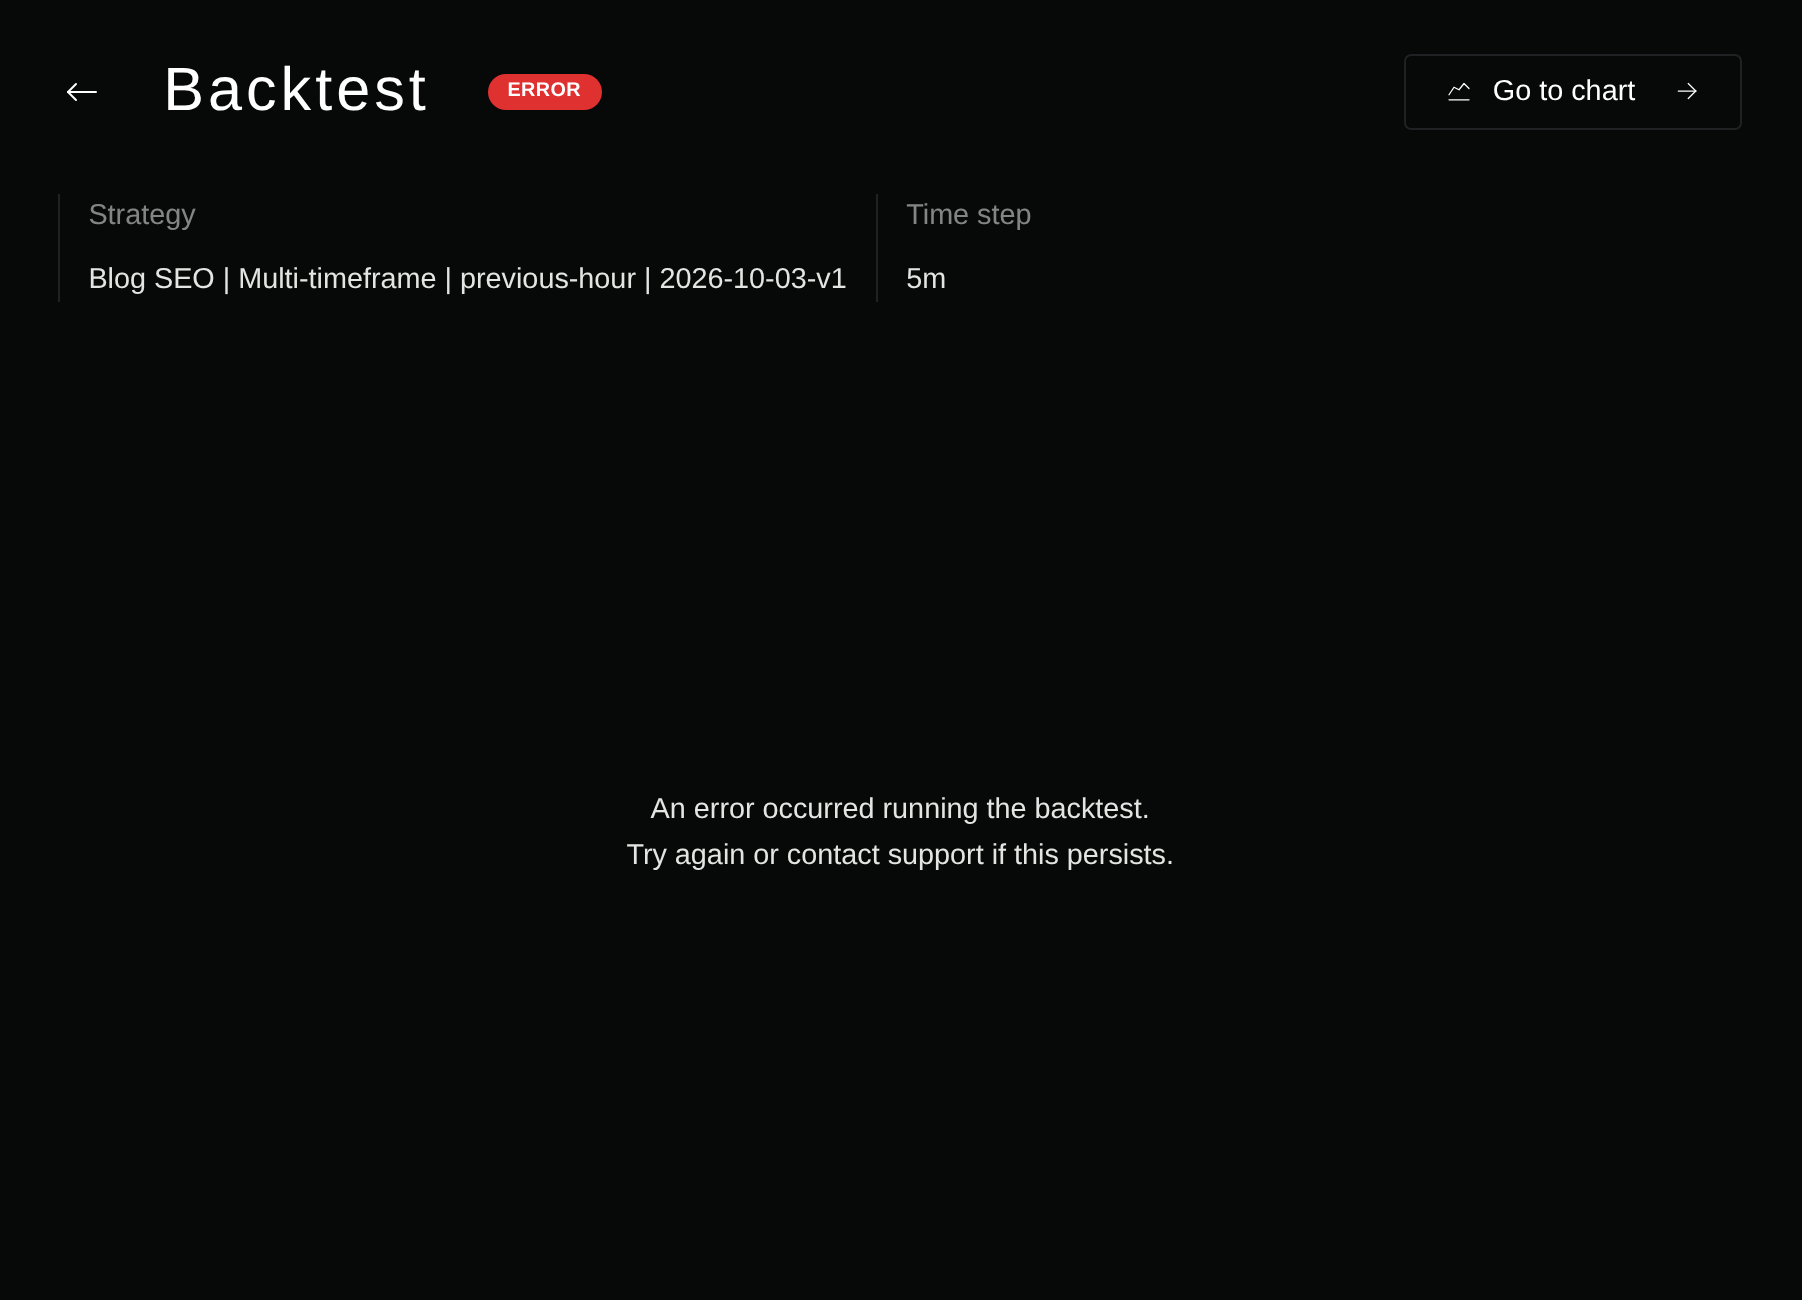
There is no filtered return to compare with the baseline. An error is not a zero-return strategy, and a separately available candle is not proof of a completed backtest.
Audit the first baseline fill before trusting its report
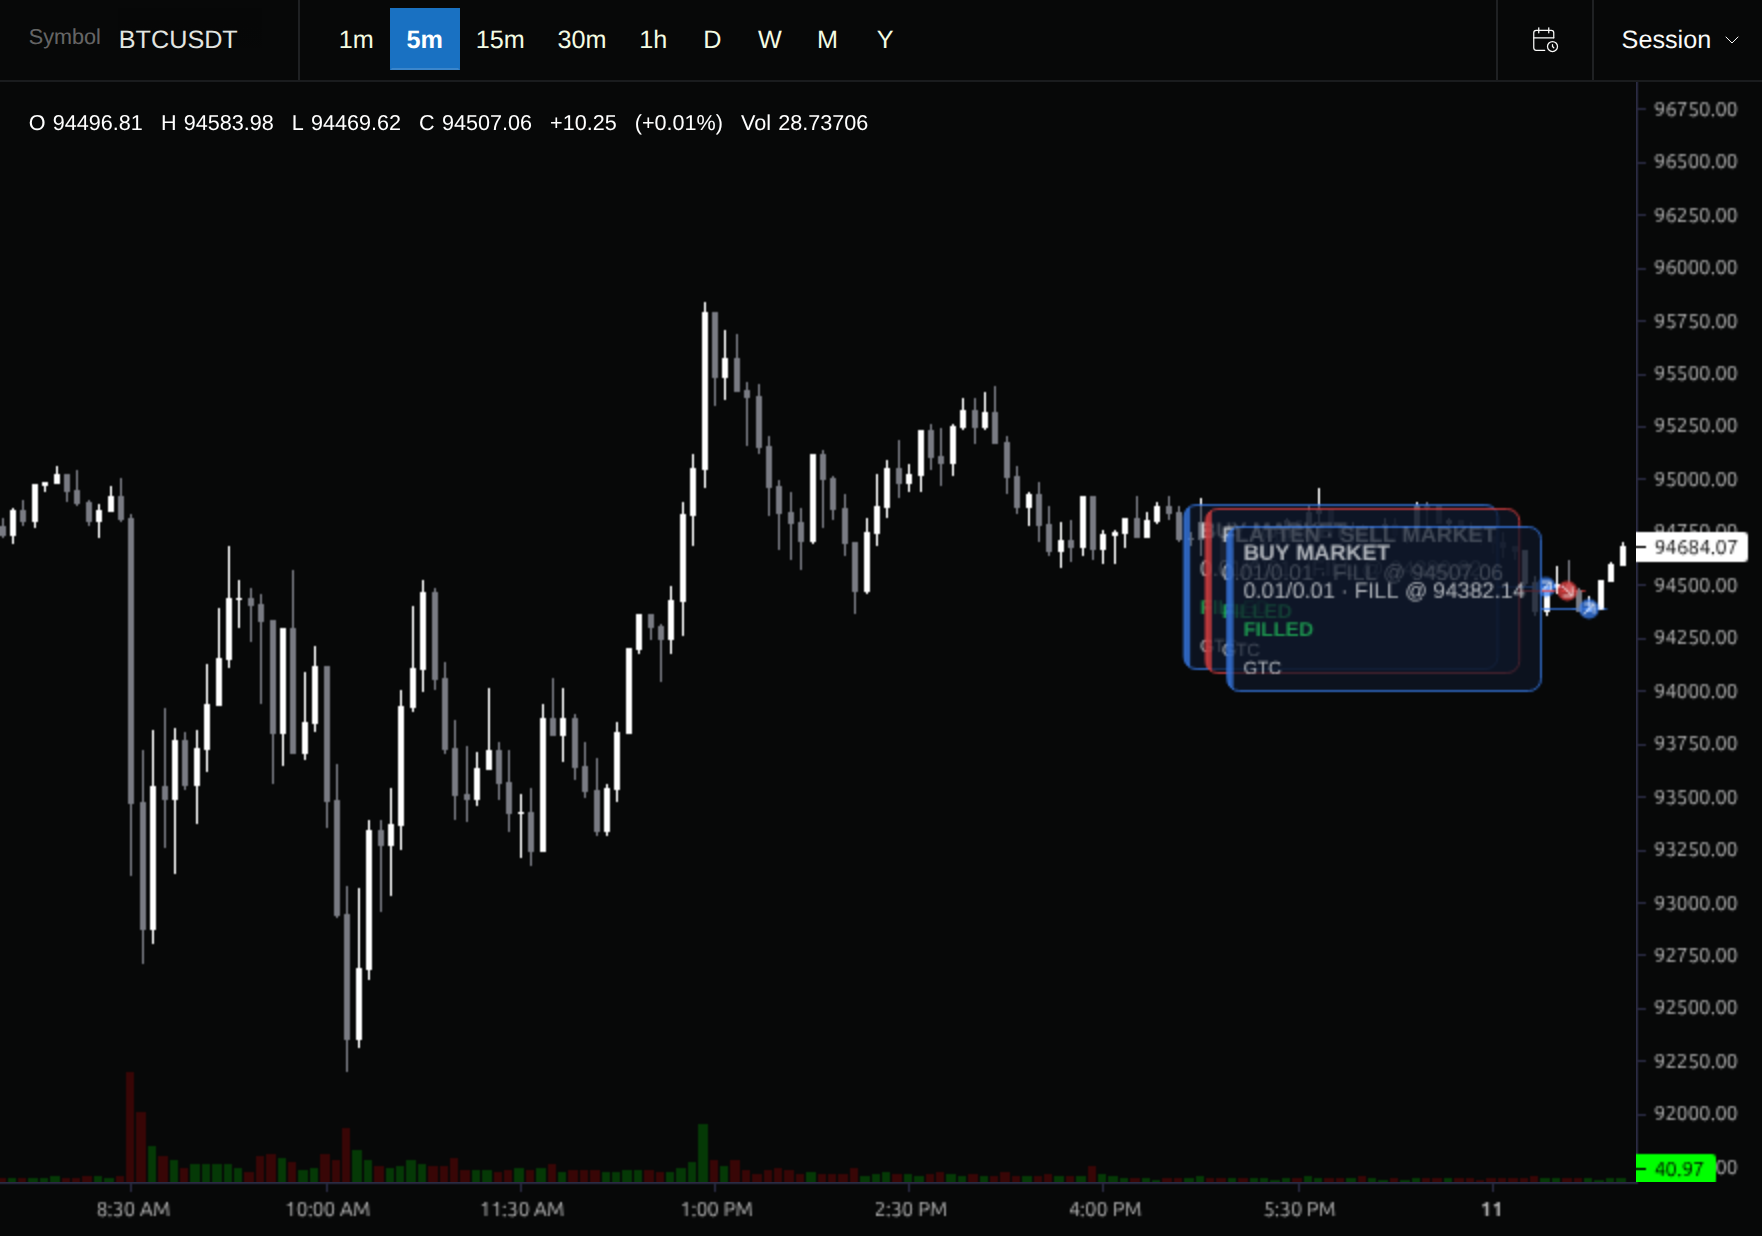
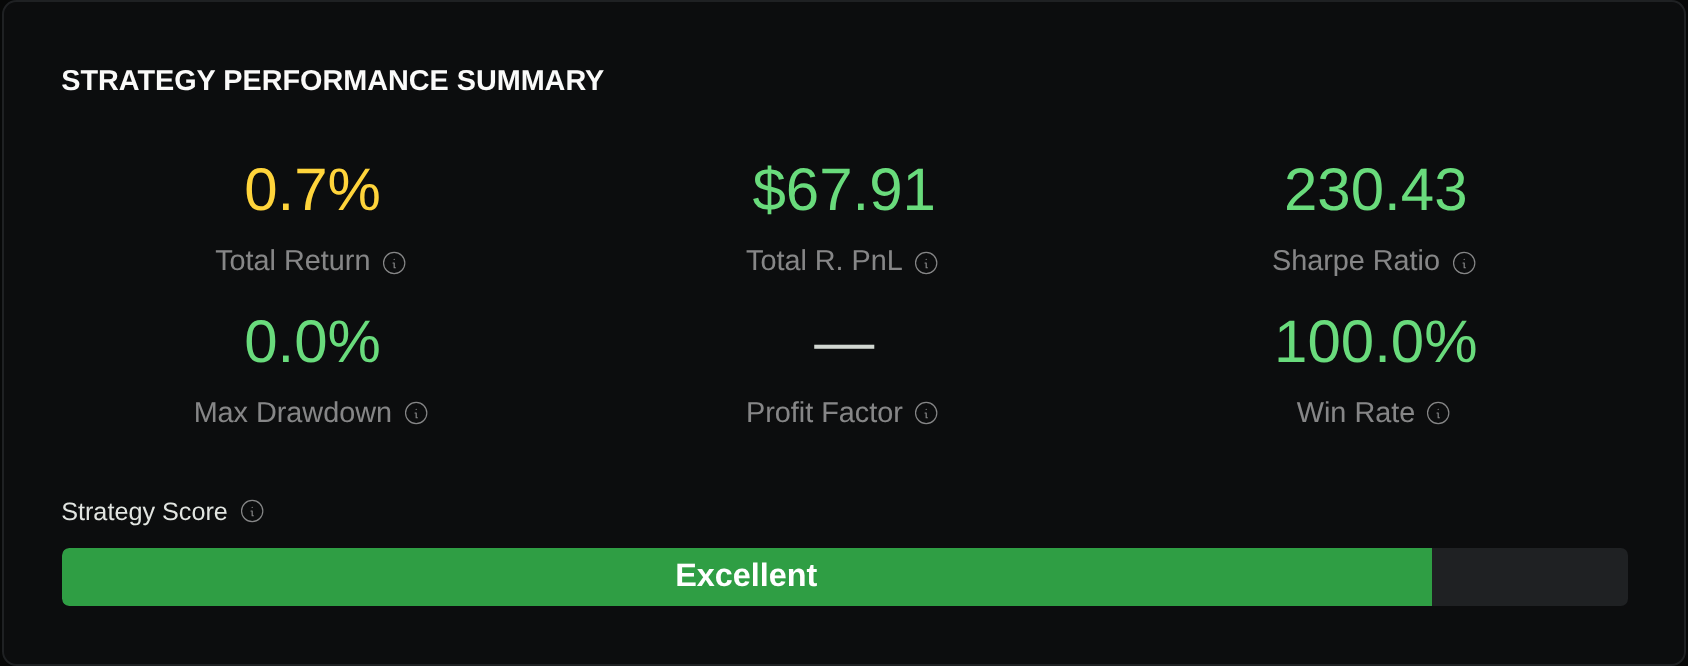
The baseline completed with 72 trades and reported $67.91 profit. Its trade P&Ls sum to $67.9062, matching the report and $10,067.9062 ending equity. That arithmetic agrees; the timing requires a different check.
Its first recorded entry is at 00:25 UTC, priced at 94,380.82. This matches the open of the five-minute candle labelled 00:25, which later closes at 94,496.80 at 00:30. The preceding 00:20 candle is red, falling from 94,515.15 to 94,380.83.
For our intended completed-green-candle entry, the preceding candle cannot justify that buy, and the 00:25 candle’s final green state is not known at its opening. Across all 72 entries, the recorded price matches the same candle’s open; every same candle is green. None of the preceding candles is green: 71 are red and one closes exactly at its open.

The runtime source explicitly models On-Open same-tick reconciliation at the triggering bar’s open, consistent with these recorded fills. Do not interpret On-Open as an automatically verified completed-close → next-open policy. This diagnostic cannot establish a trading edge or an advantage from the hourly filter.
Make the boundary audit repeatable
Before comparing returns, retain one record containing:
- The higher candle’s opening label, actual completion boundary and selected historical index.
- The lower candle that generated the signal, its completion time and the values actually available then.
- Required warmup observations and confirmation that the execution workflow received them.
- Order-submission time, first eligible fill and recorded fill price.
- Fixed sizing, costs, session and date-window assumptions for both variants.
Inspect the decision immediately before the hour ends, the boundary itself, and the first decision inside the new hour. If the selected higher-timeframe value changes, identify whether a candle completed, a developing candle updated, or the historical index shifted. A larger return does not resolve those questions.
Choose one hour boundary in your own strategy and use the backtest results guide to inspect its trade and source candles before treating the comparison as performance evidence.
Put your strategy rules to the test
Build your strategy, inspect historical trades, and review the assumptions behind your results.
Build and test your strategy