How to backtest an RSI pullback strategy on SPY
Separate oversold readings from recovery signals, define next-session execution, and compare an SPY RSI rule with a consistent buy-and-hold baseline.
A useful SPY RSI backtest starts with a precise question: does buying after RSI recovers from an oversold reading behave differently from buying while it is still oversold? Those are different strategies, even when both use the same indicator and threshold.
SPY is the State Street SPDR S&P 500 ETF Trust, which seeks to track the S&P 500’s price and yield performance before expenses. The experiment here concerns shares of that ETF. State Street’s fund page identifies its objective and NYSE Arca listing.
The following recipe uses illustrative rules and costs. It specifies what to test and how to interpret the trades; its thresholds are not optimized settings or a forecast of returns.
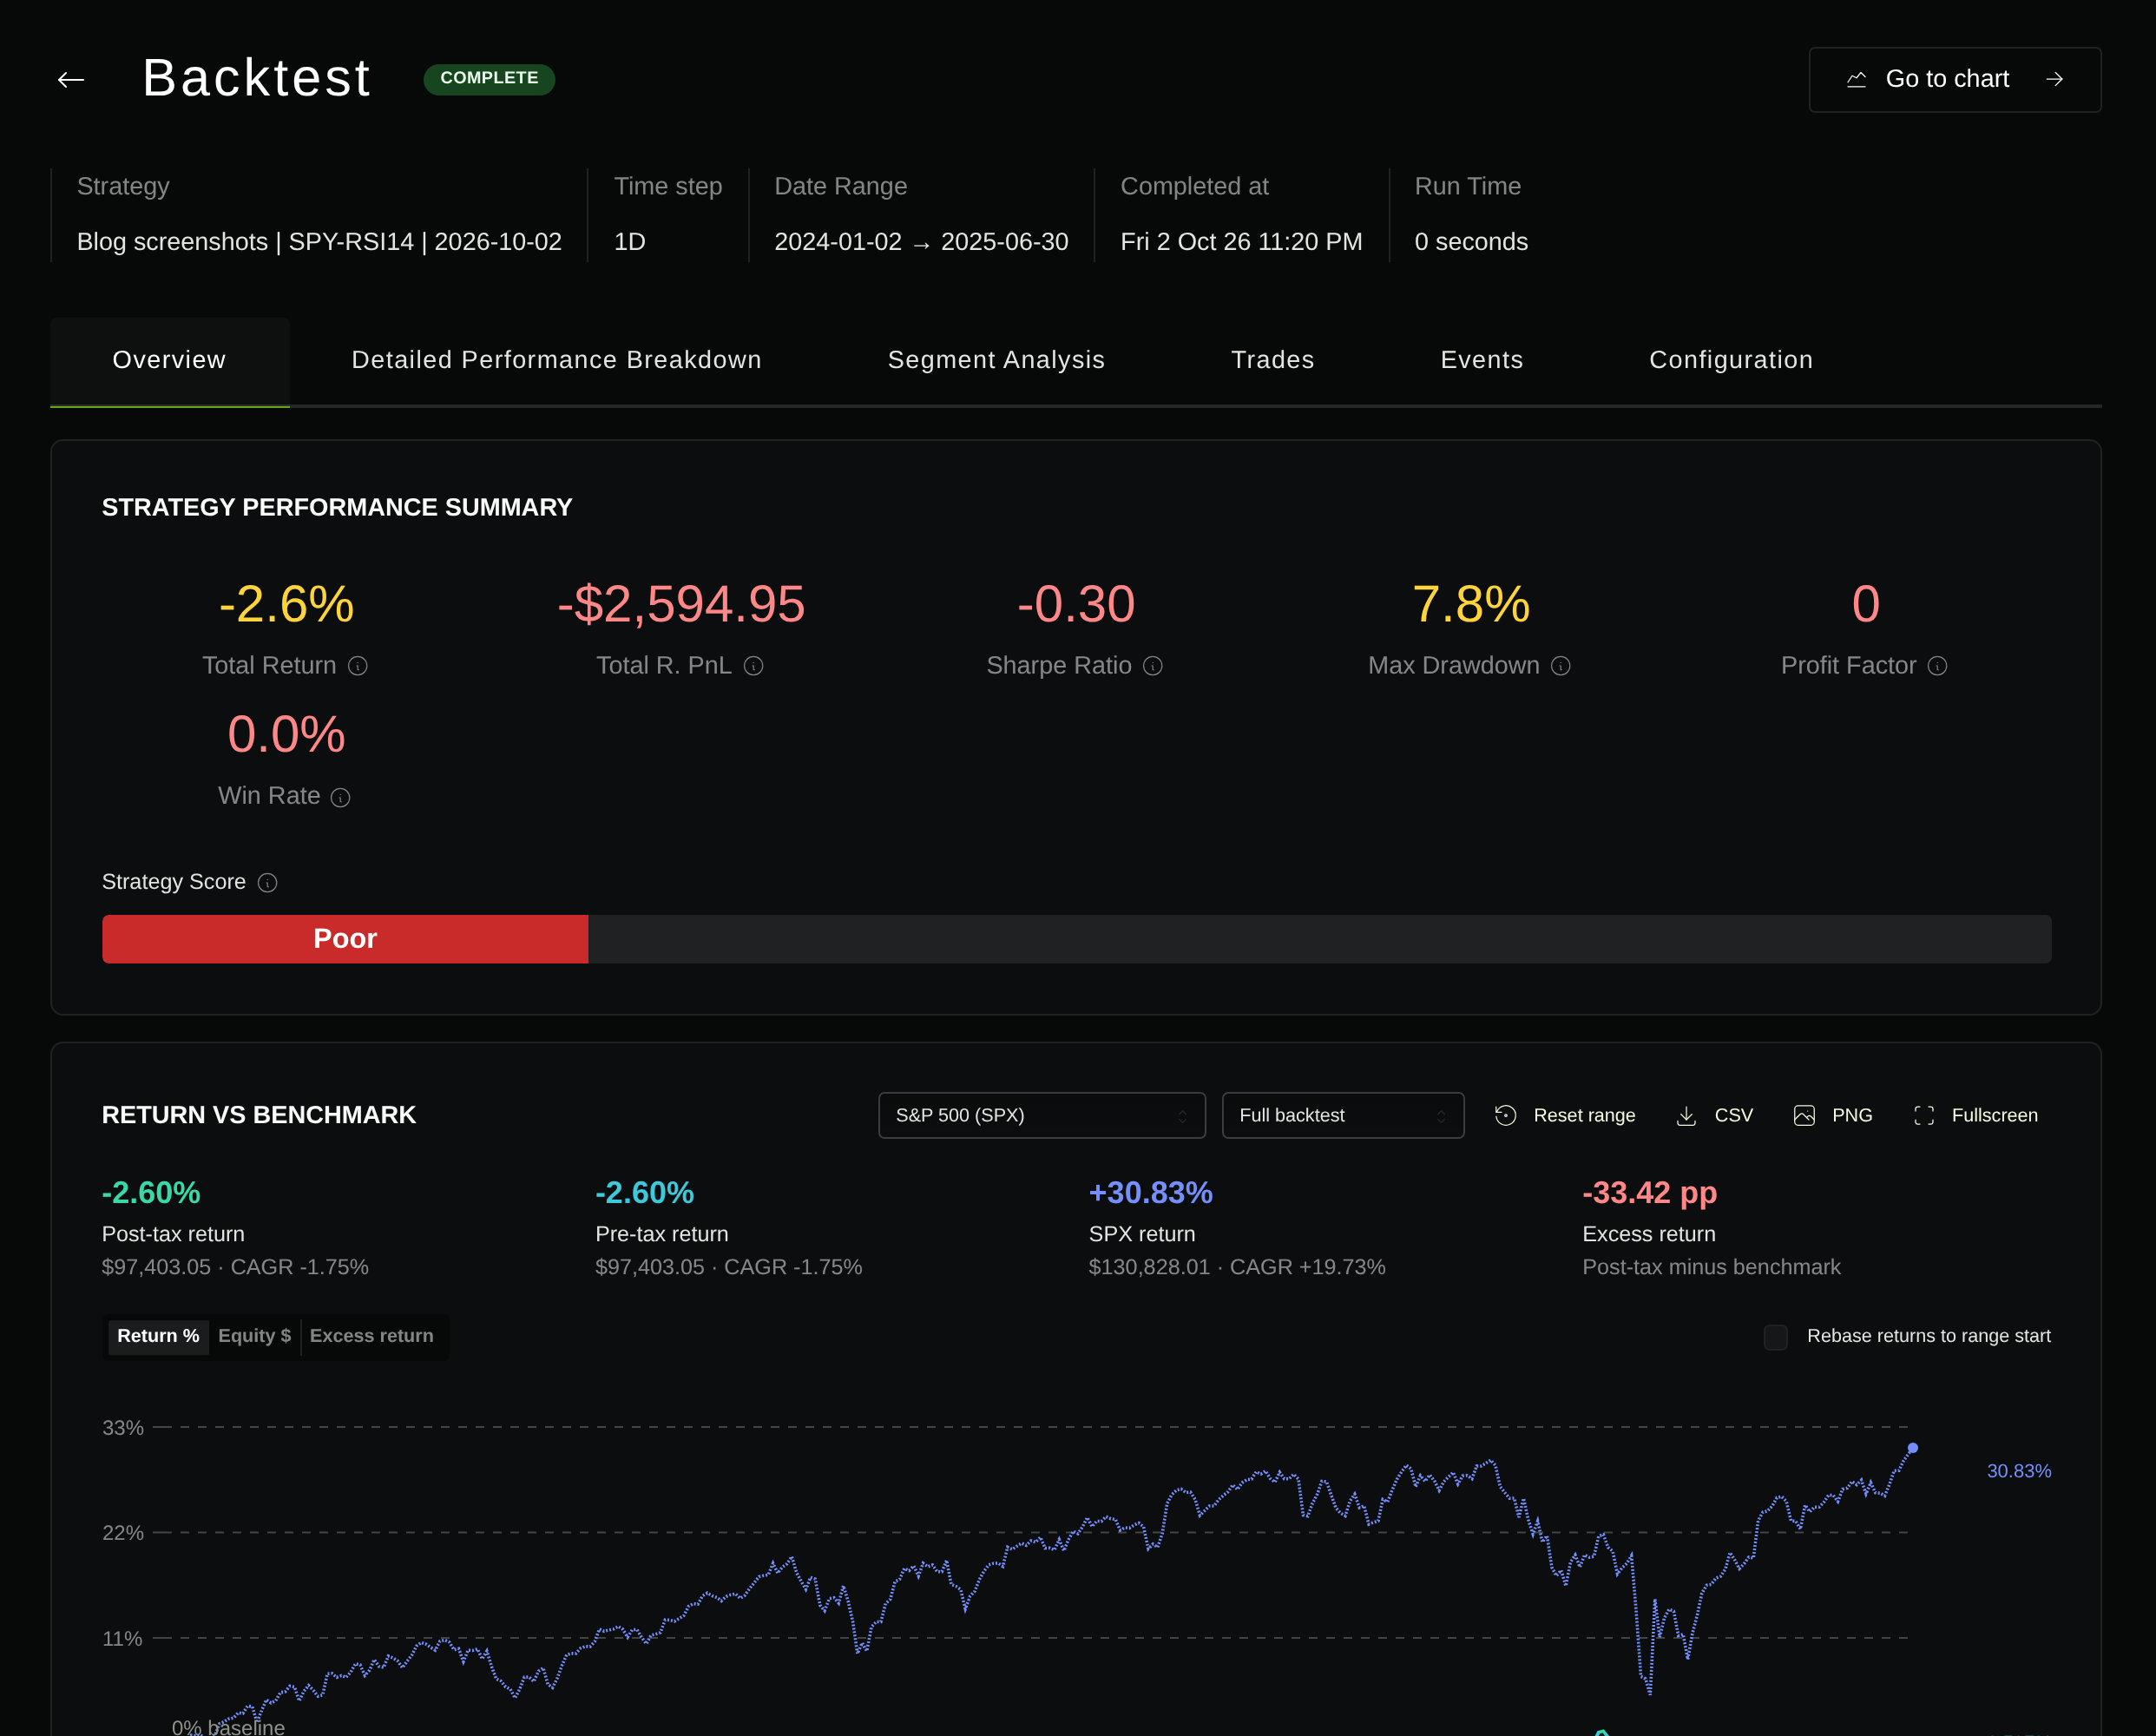
The product captures below come from a separate, completed demo-account run on daily SPY bars from January 2, 2024 through June 30, 2025. That shorter demonstration produced one losing closed trade; it does not complete the six-year comparison specified below.
Separate an oversold condition from a recovery trigger
RSI measures price momentum on a scale from 0 to 100. A reading below 30 is conventionally described as oversold, but it does not establish that a bounce is imminent. RSI can stay at extreme levels during a strong trend. Fidelity’s RSI guide explains both points.
Consider this invented sequence of completed daily readings:
| Bar | RSI | Signal at this close |
|---|---|---|
| A | 31 | Not oversold; crossing not evaluated |
| B | 28 | Oversold condition |
| C | 26 | Oversold condition |
| D | 30 | Neither |
| E | 32 | Recovery trigger |
The condition RSI < 30 is true on B and C. The recovery trigger is true on E: the previous reading was at or below 30, and the current reading is above 30. Reaching exactly 30 does not trigger this definition. A has no previous reading in the example, so its crossing is not evaluated.
A condition-entry strategy would submit its first buy after B closes. A recovery-entry strategy would wait until E closes. The table describes signal logic, not historical SPY prices or trades.
Neither rule proves that a decline is over. The recovery version can enter later, miss a rebound, or buy before another fall. The backtest should expose those tradeoffs.
Fix the experiment before running it
Use one configuration for both entry variants, changing only the entry condition:
| Setting | Illustrative specification |
|---|---|
| Asset | SPY shares, USD, long only |
| Dates | January 2, 2020 through December 31, 2025, inclusive |
| Bars | One completed daily regular-session bar |
| Clock | America/New_York; follow exchange holidays and early closes |
| RSI | RSI(14), Wilder smoothing, closing-price input |
| History | 250 completed daily bars before the evaluation window; no warmup trades |
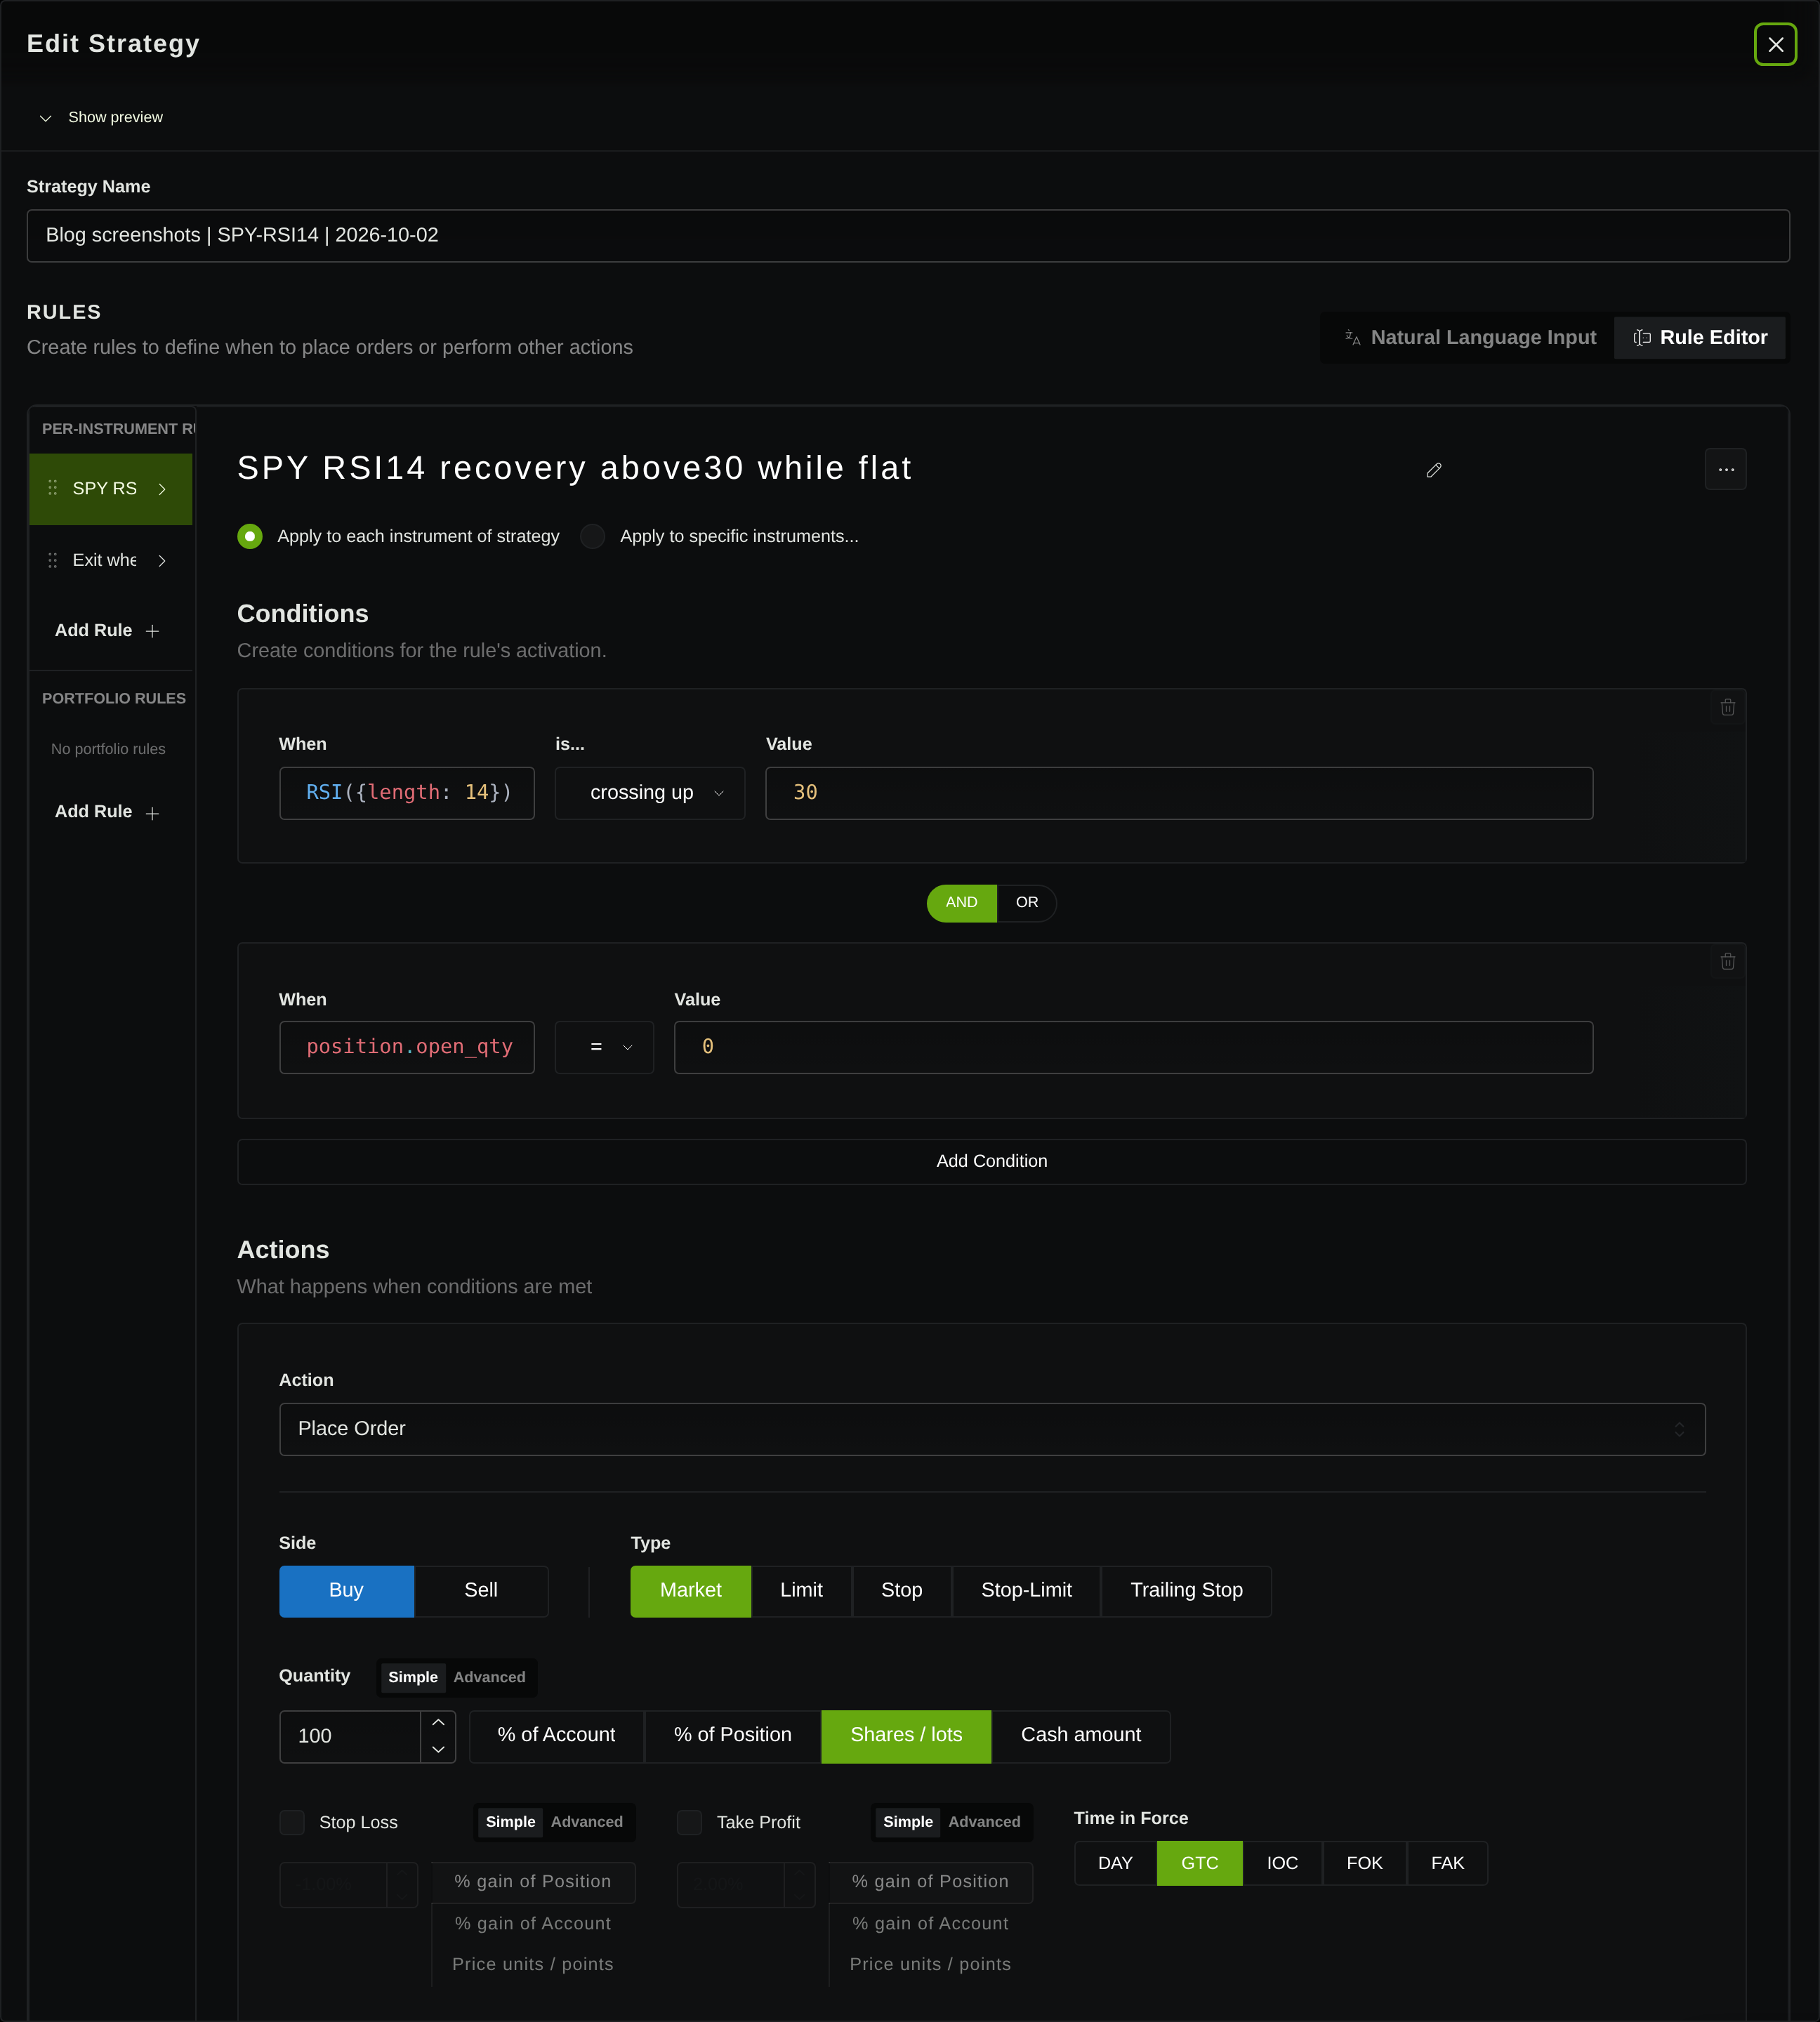
| Entry | While flat, previous RSI ≤ 30 and current RSI > 30 |
| Variant | While flat, current RSI < 30 |
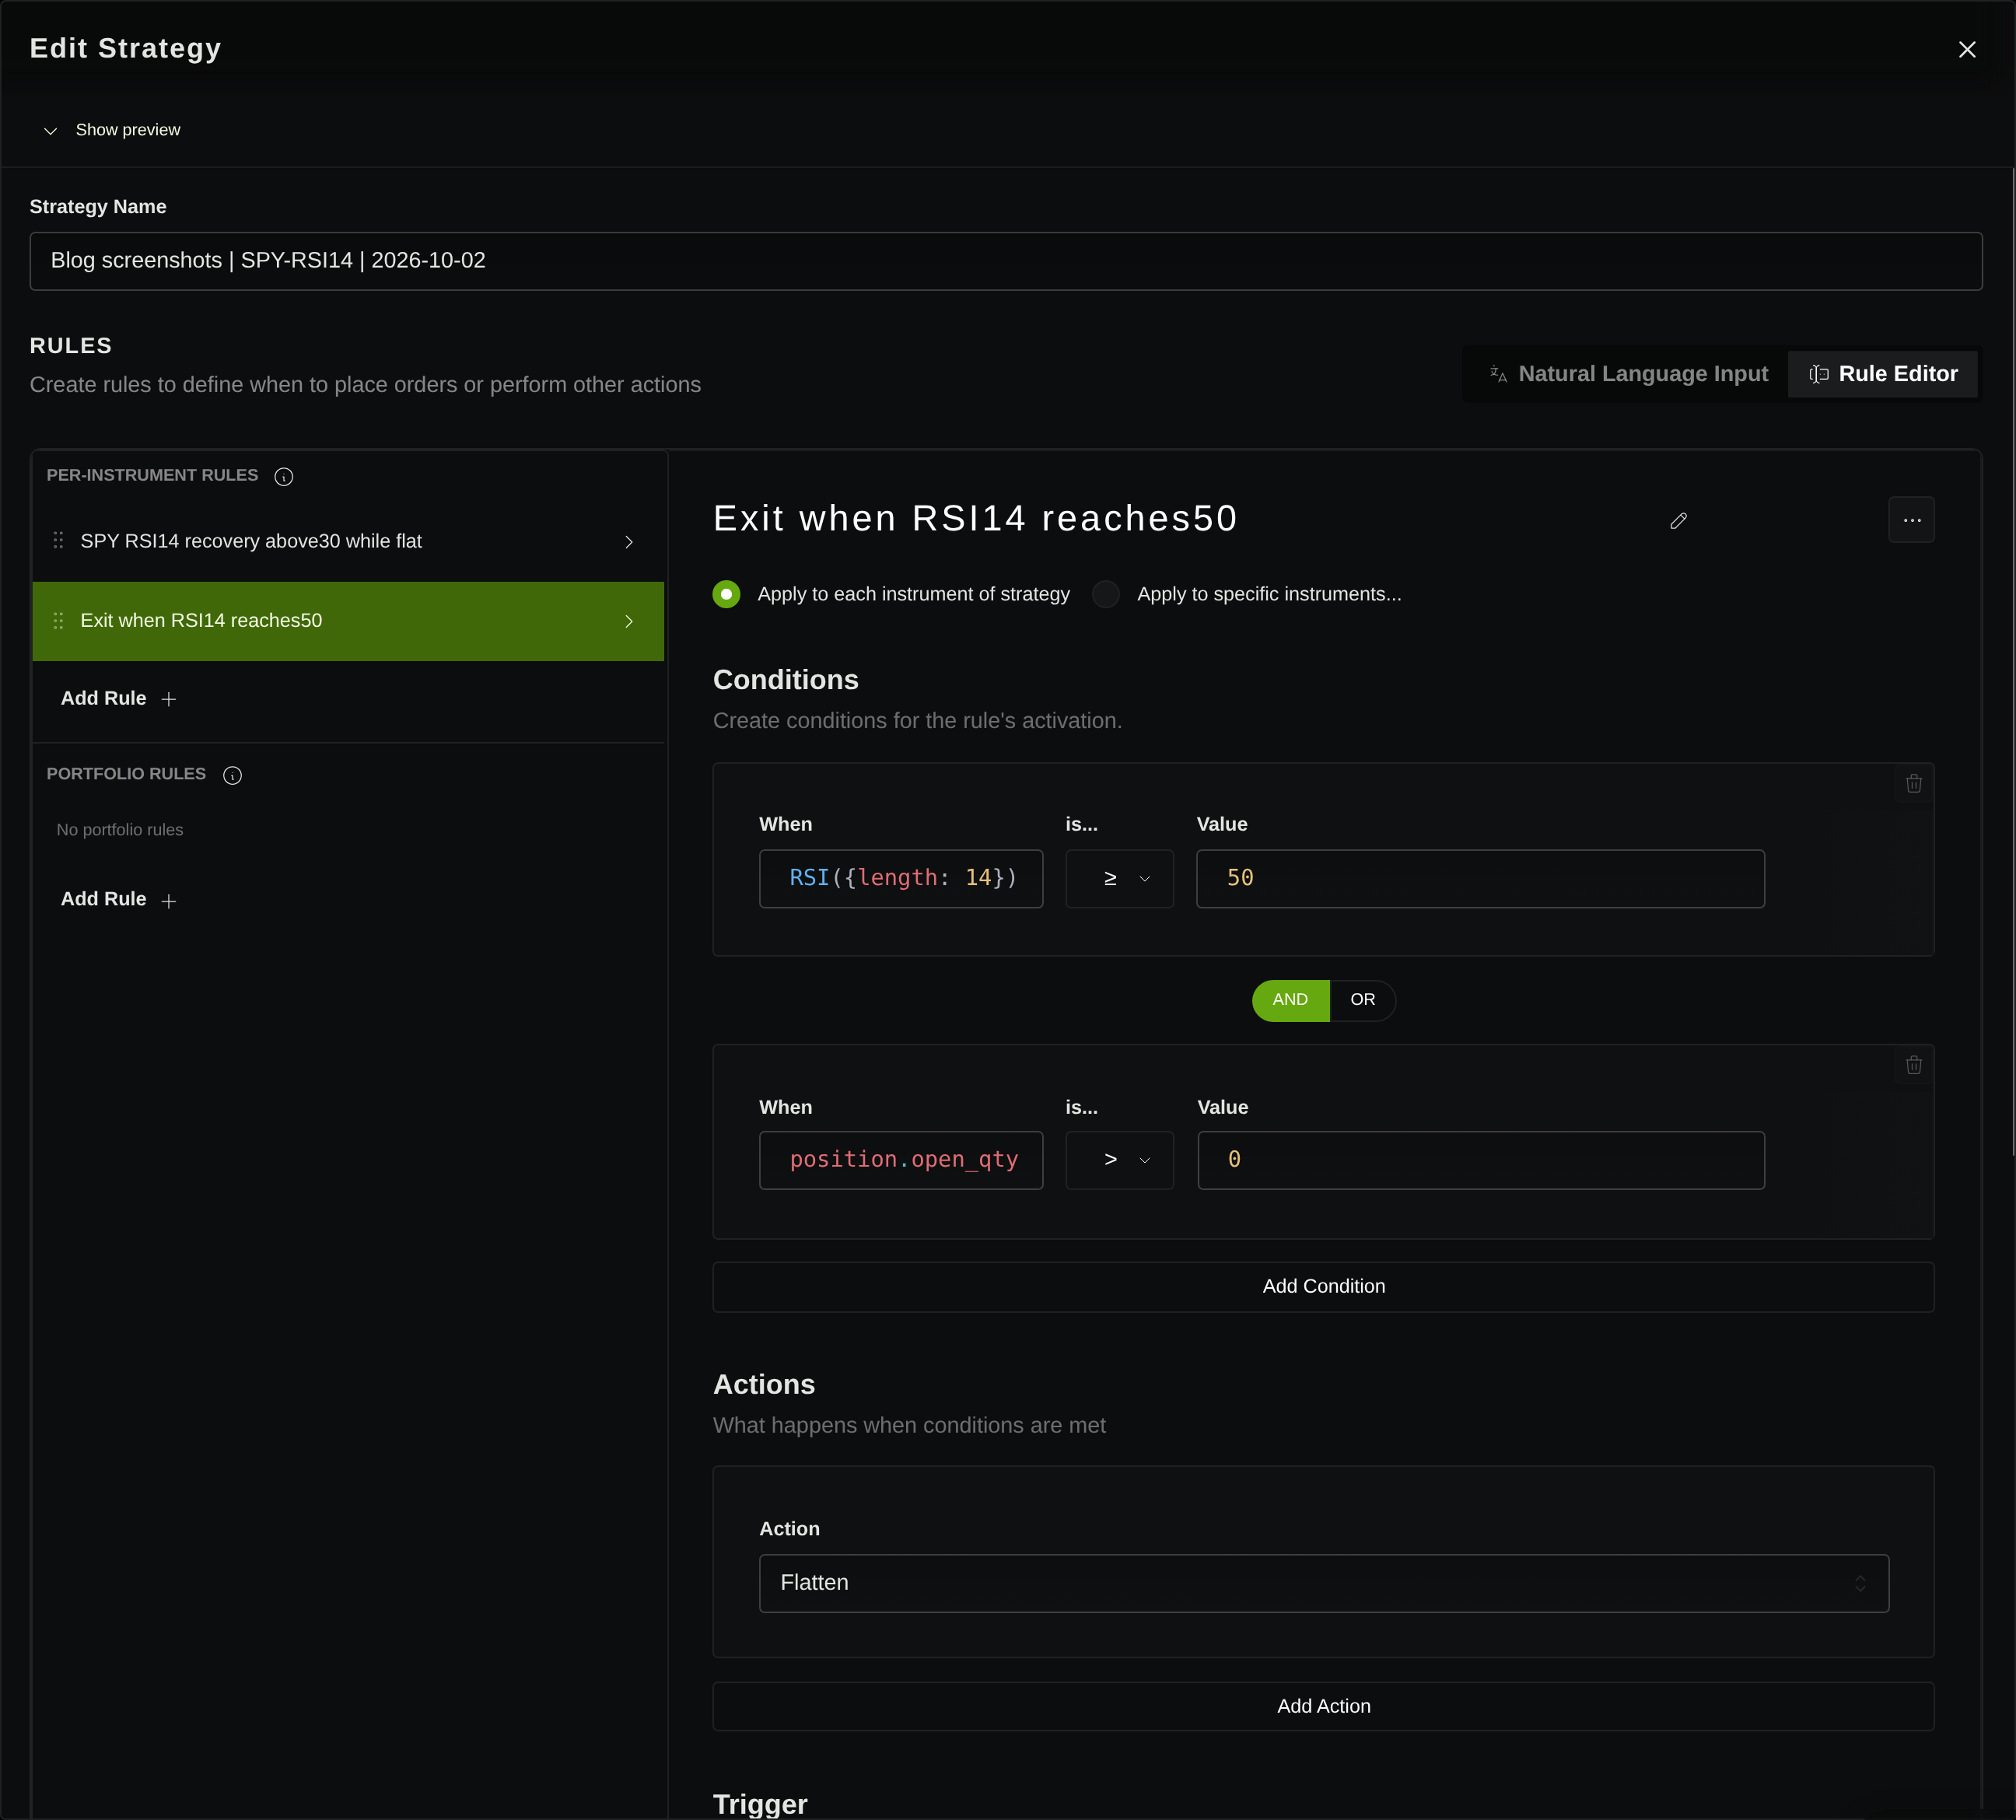
| Exit | While long, current RSI ≥ 50 |
| Fills | Market order at the next regular session’s open, with modeled slippage |
| Size | One position of 100 whole shares; no additions or leverage |
| Cash | $100,000; unused cash earns no interest |
| Costs | $1 commission per filled order; 0.05% slippage against the trader on each fill |
| Prices | Split-adjusted OHLC; no dividend adjustment or dividend cash credits |
| End | Mark any open position at the final session’s close; no later fills |
Do not replace Wilder smoothing with a simple rolling average and assume the signals will match. Record the period, smoothing method, input price, and warmup together. The extra history initializes the indicator before the first tradable session; it is not part of the performance window.
For this experiment, entry is allowed only when cash covers 100 shares at the modeled fill price plus commission. Reject an unaffordable entry rather than reducing the quantity or borrowing. Exit takes priority; never close and reopen on the same evaluation.
There is deliberately no stop-loss or maximum holding time in this first specification. A position can remain open through further declines until RSI reaches 50. That makes the exit assumption visible; it is not a suggested live risk policy.
Keep the signal and fill on different sessions
The final daily close is known only after that session completes. A strategy using it to compute RSI should not assume it can then buy at the same already-observed close.
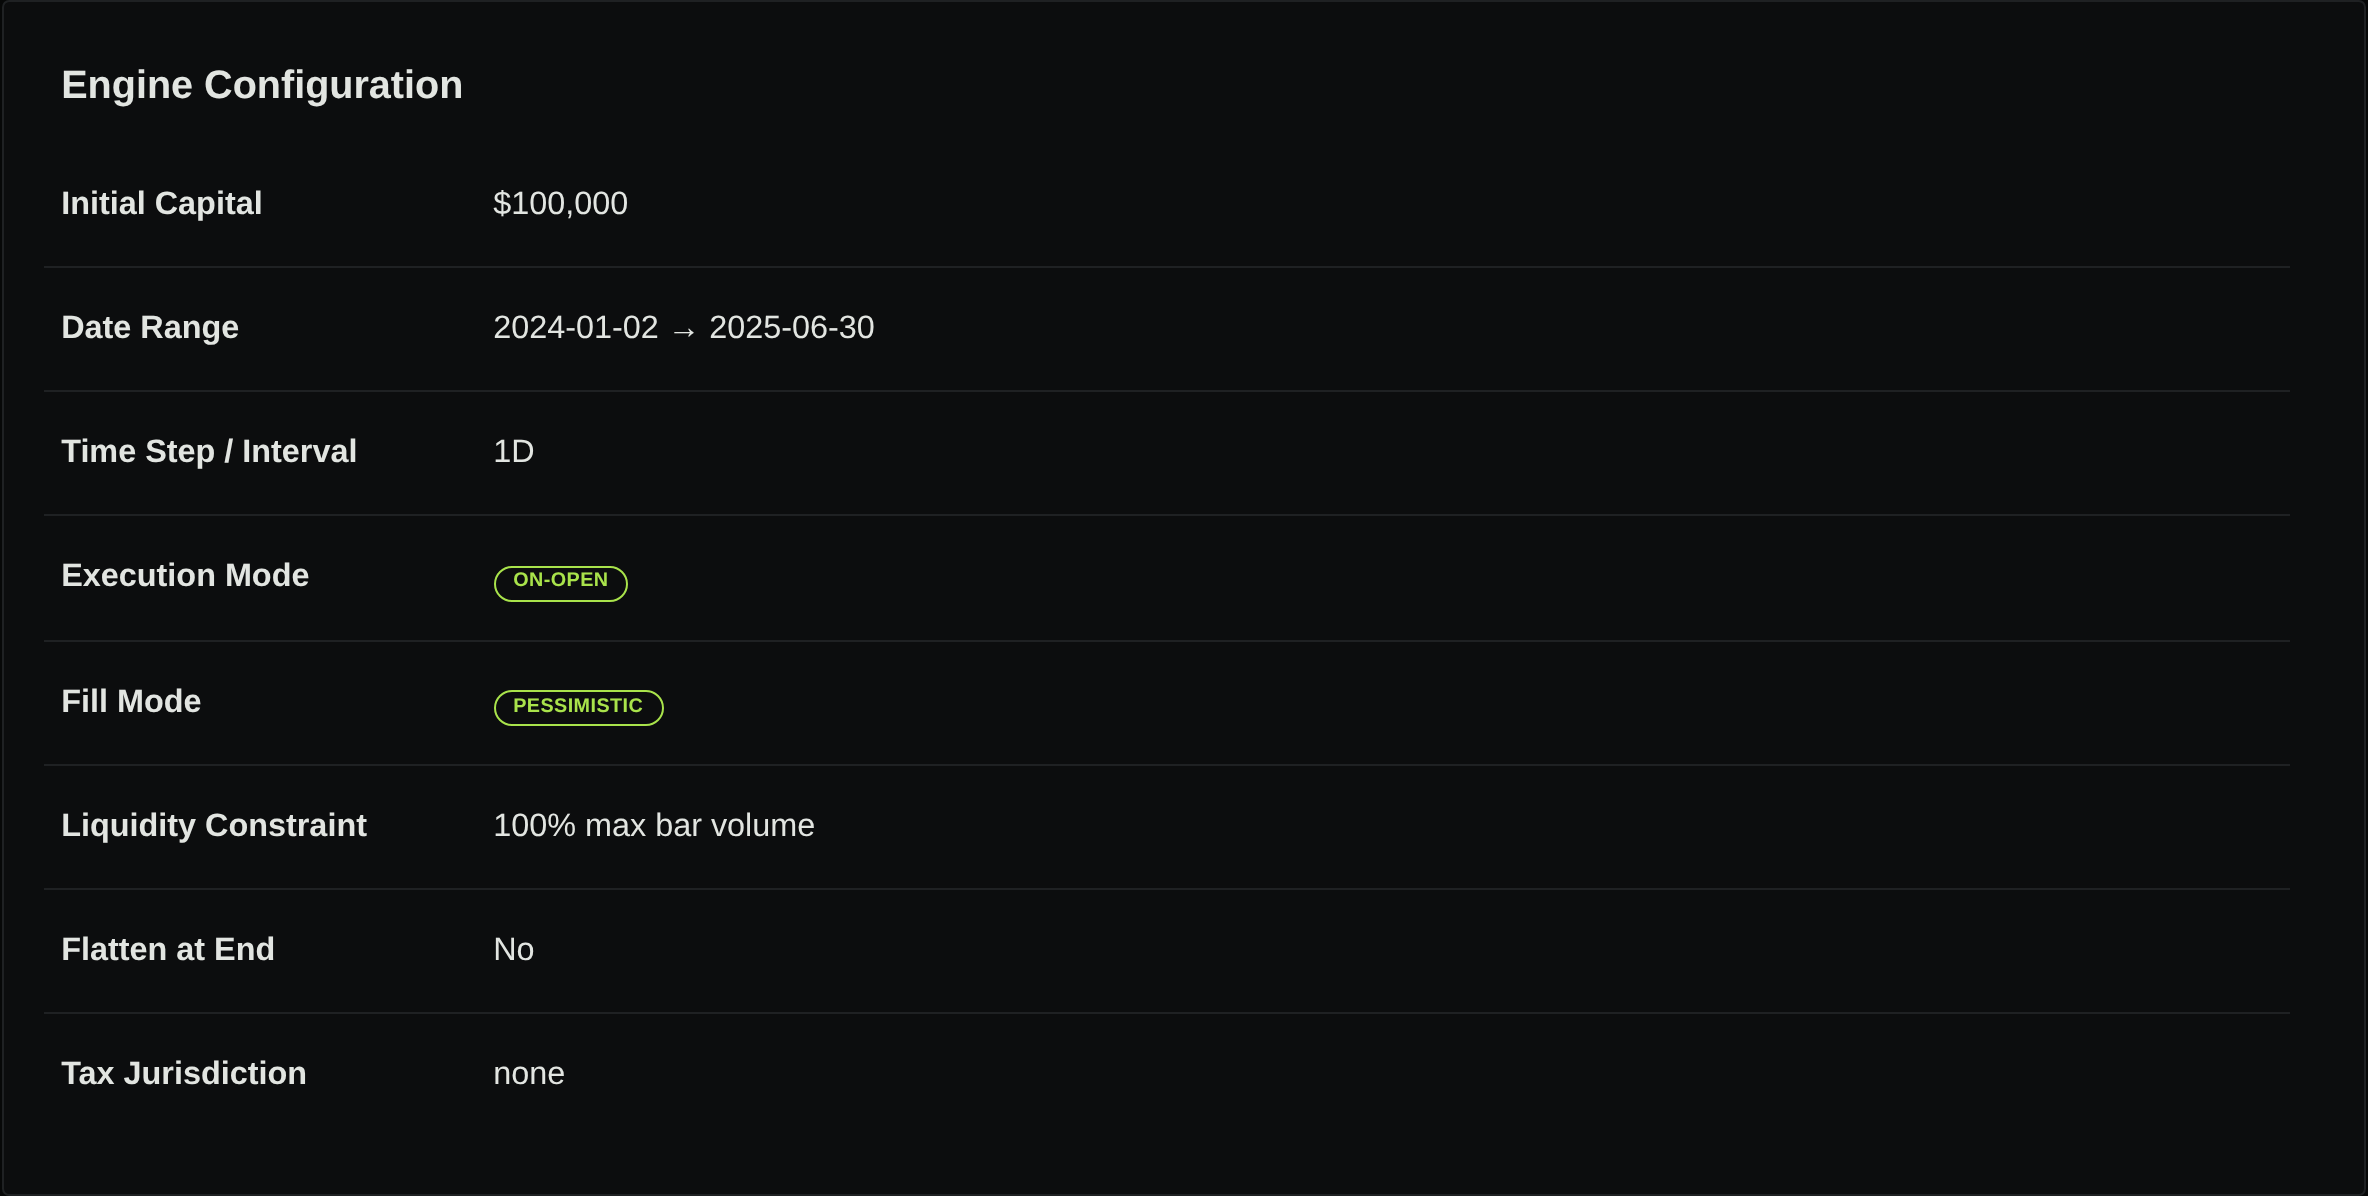
For this recipe, calculate the signal after the close, submit the order, and model the fill at the next trading session’s open. A Friday signal may therefore fill on Monday or after a market holiday. The NYSE calendar and hours distinguish NYSE Arca’s regular session, normally 9:30 a.m. to 4:00 p.m. Eastern, from extended trading and early closes.
Stratifyre’s backtest guide describes On-Open execution as evaluating completed bars and filling market orders at the following bar’s open. Match the selected bars to the intended regular session and inspect the first fill’s timestamp and price. A daily bar’s label alone does not establish which trading hours it contains.
The overnight gap remains part of the trade. If RSI recovers today and SPY opens substantially higher tomorrow, the entry price should reflect that higher open rather than today’s close.
Decide what adjusted prices mean
The recipe above is a price-only experiment: splits are normalized, while distributions are excluded from both the price adjustment and the portfolio cash ledger. It does not measure an investor’s total return.
Check the actual data convention instead of treating “adjusted” as a complete explanation. For example, Massive’s stock-data documentation distinguishes split-adjusted bars from dividend-adjusted data. That vendor example does not establish the convention of any particular Stratifyre dataset.
SPY makes distributions; State Street lists quarterly distribution frequency on its fund page. A price-only test leaves that income out. For a separate total-return experiment, specify entitlement, payment timing, and whether cash is retained or reinvested, then apply the same policy to the strategy and baseline.
Avoid crediting dividend cash on top of a price series that already embeds the same distribution return. Keep signal prices, execution prices, share quantities, and portfolio accounting consistent, and document any conversion between them.
Compare with a matching buy-and-hold baseline

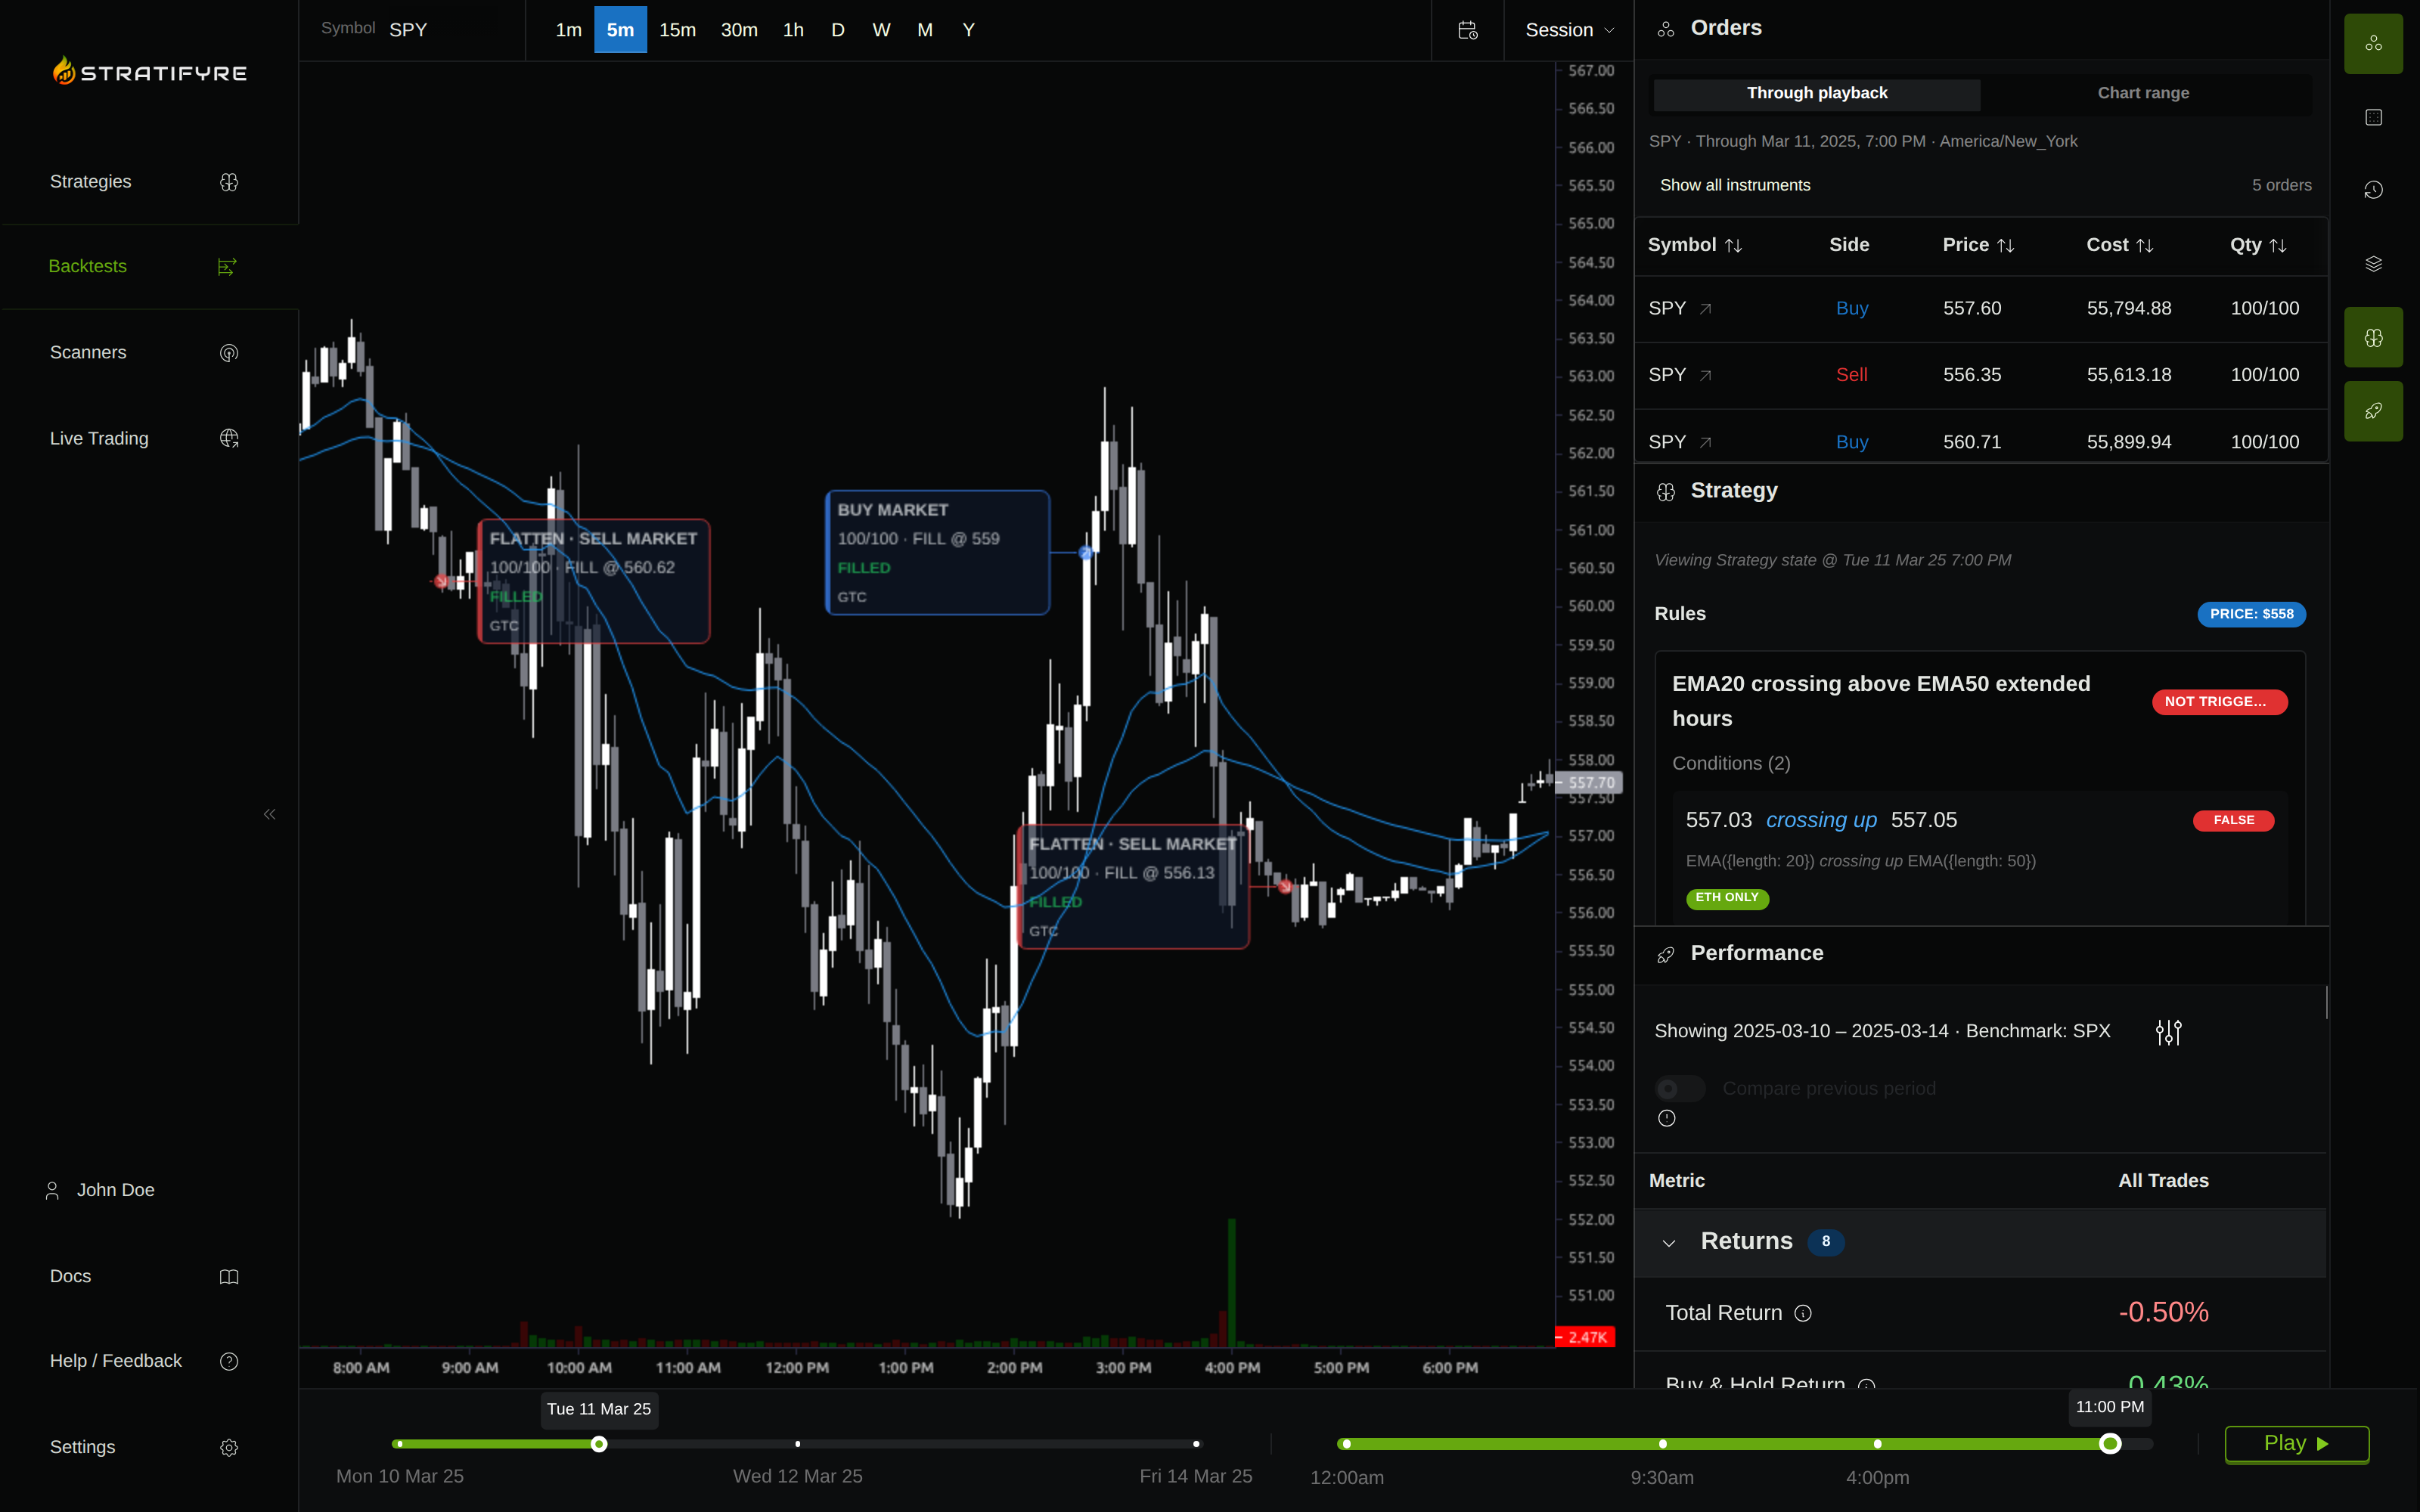
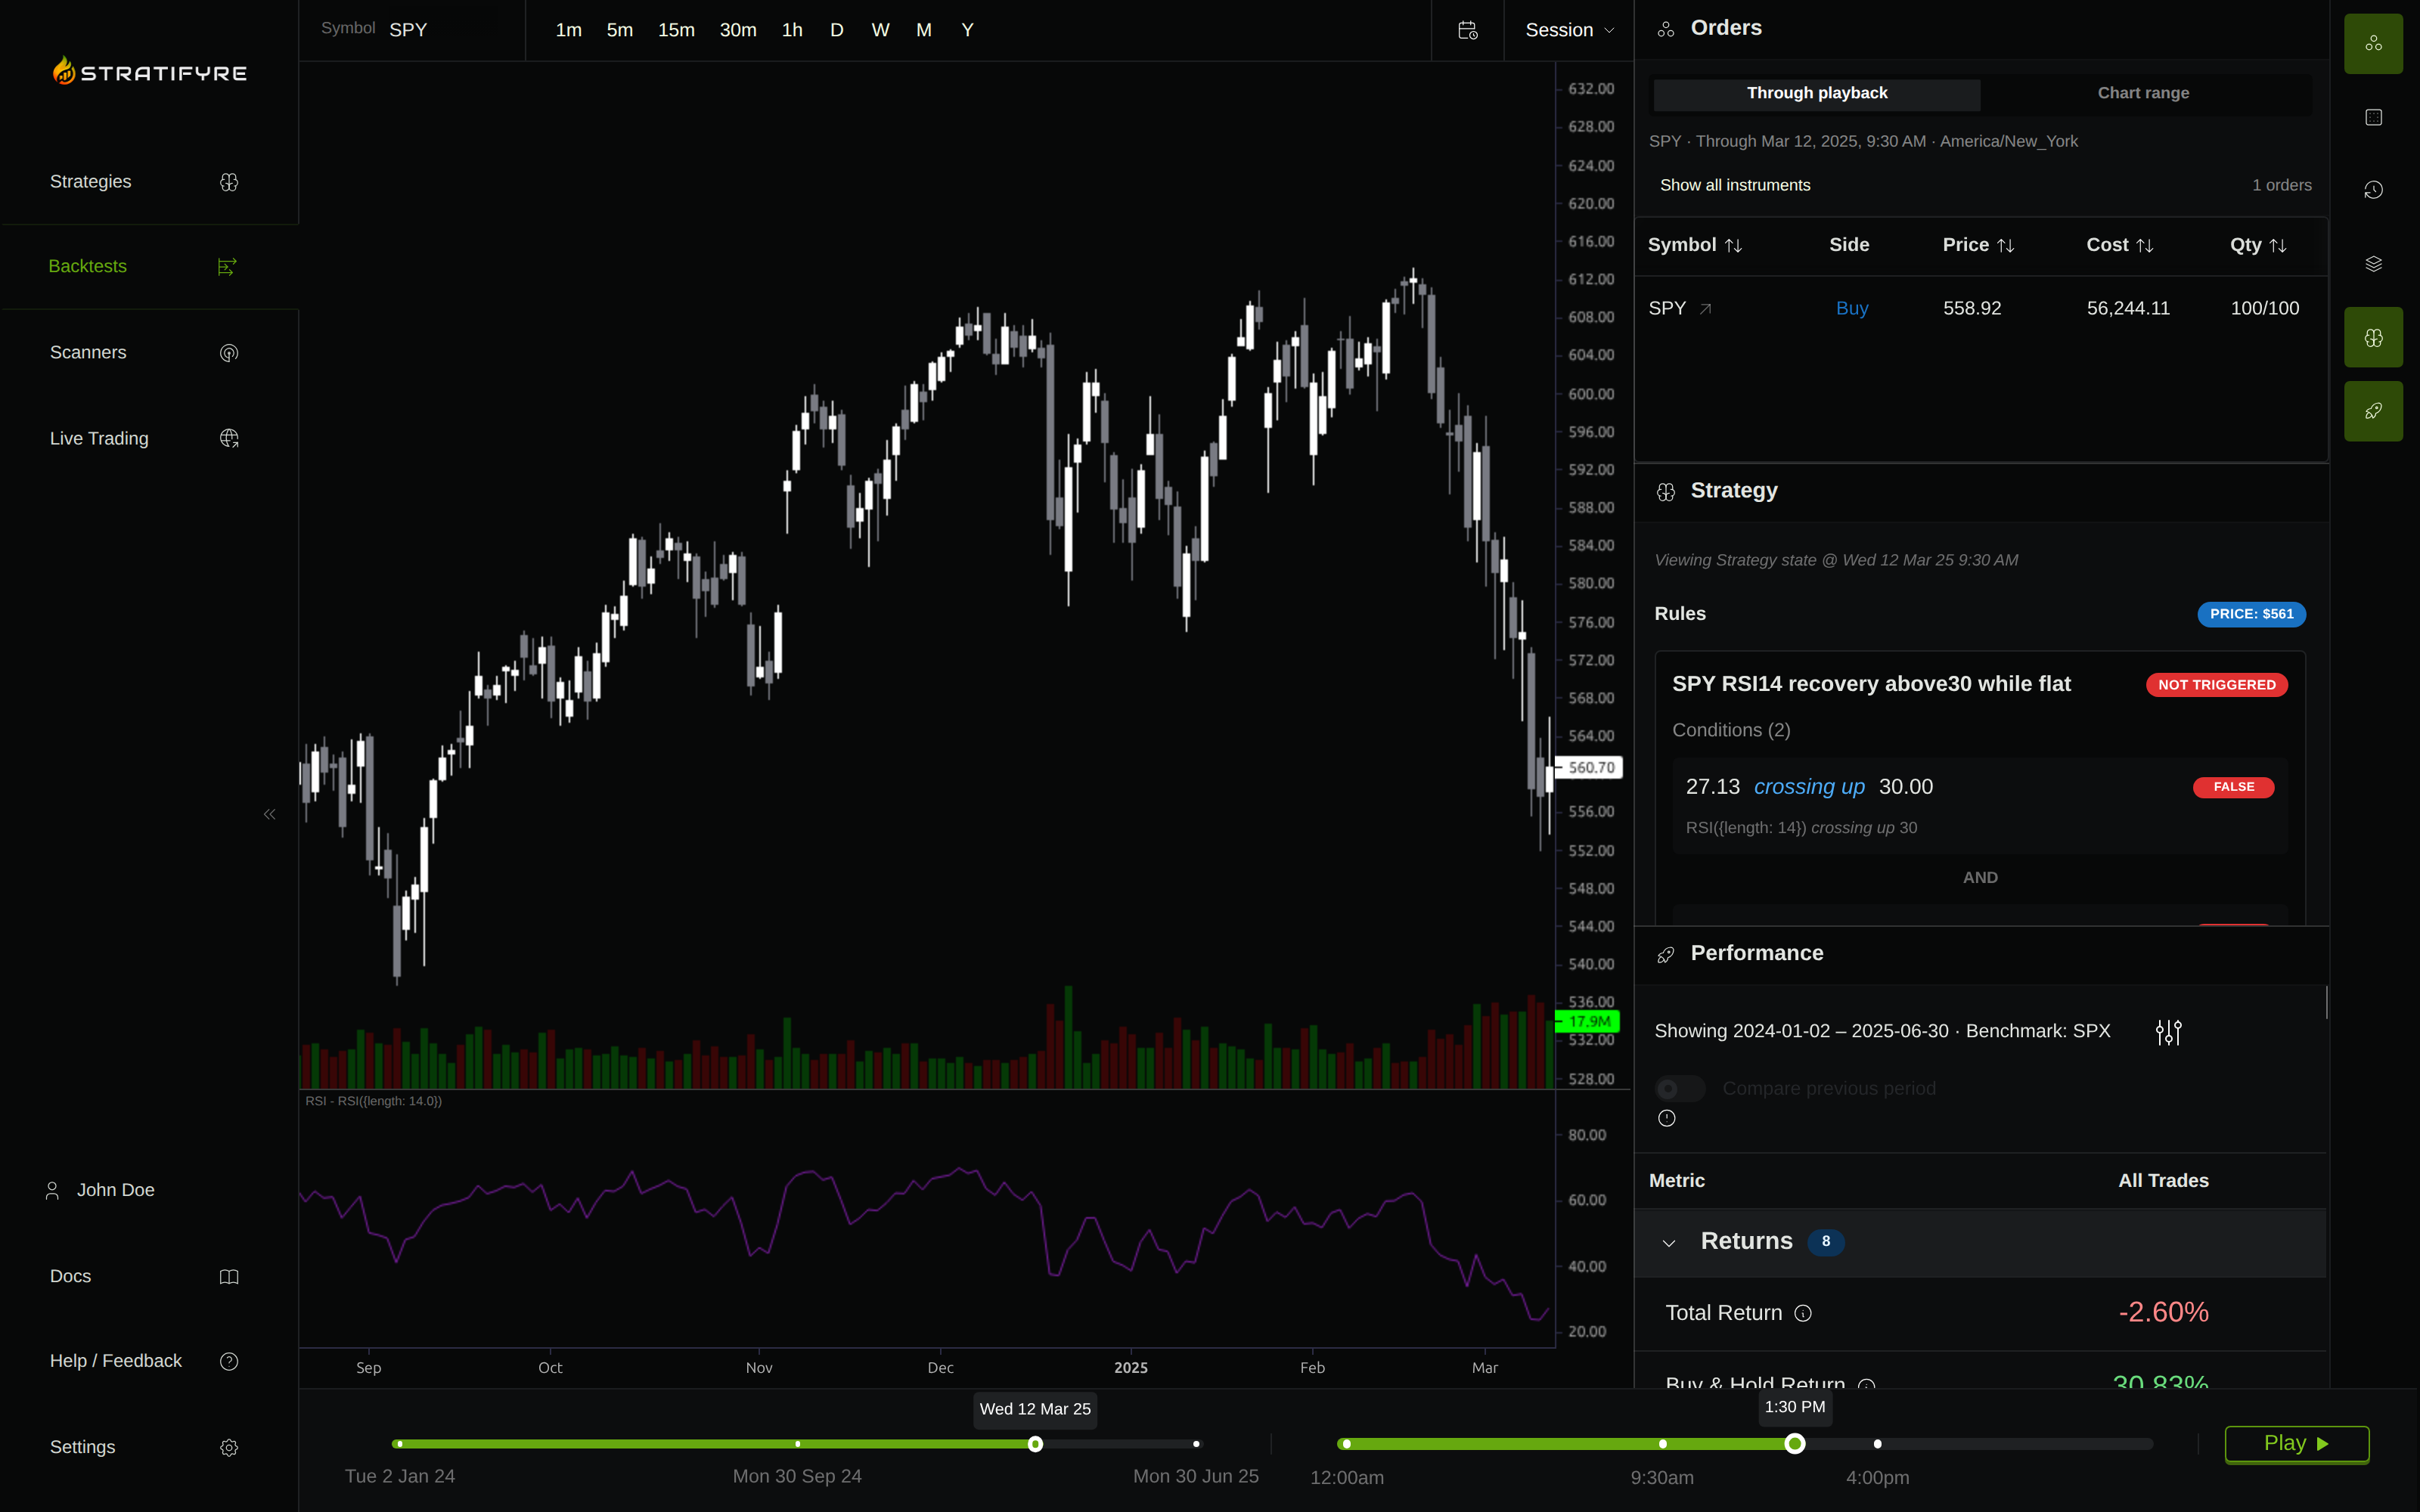
Match the replay’s session view to the run. The regular-session view below displays daily candles and RSI; at the recorded buy timestamp, the displayed current RSI is 27.13 and the crossing condition is false. That snapshot does not establish the earlier completed-bar decision that produced the order; reconcile that decision and the later fill before treating the execution sequence as verified.
For the first baseline, buy 100 SPY shares at the evaluation window’s first regular-session open and hold them through its final close. Begin with the same $100,000, charge the same entry commission and slippage, and leave unused cash idle. Value the holding at the final close rather than silently assuming a liquidation.
Use identical dates, price conventions, dividend treatment, and currency for all three runs. The baseline is invested from the start; the RSI strategies wait for their signals and may spend much of the window in cash. Their different exposure is something to measure, not conceal.
Inspect these questions together:
- Ending equity: Did the rule improve the whole account’s outcome after its additional trading costs?
- Drawdown: How far did marked account equity fall from a prior peak, including losses on open positions?
- Time invested: Was a smaller drawdown mostly a consequence of holding less market exposure?
- Holding duration: Did the exit leave capital tied up through an extended decline?
- Trade count: Does the result rest on only a few entries?
A higher win rate can coexist with a worse account outcome if a few losses are large. A smaller drawdown with more idle cash can be useful, but it does not by itself show superior entry timing. Compare whole-account results with whole-account results, and show open positions separately from completed trades.
Inspect the trade that challenges the idea
After a completed run, find an entry followed by continued price weakness, if one exists. Check the signal day’s RSI, the previous day’s RSI, the next-session fill, the subsequent price path, and the eventual exit or final open-position valuation.
For a condition entry, ask how long RSI remained below 30 after the order. For a recovery entry, ask whether the crossing was followed by another decline. Check a losing trade before choosing a more attractive example for your notes.
If there are no trades, first check coverage, warmup, the flat-position guard, and the exact crossing definition. If the configuration is correct, zero trades is the result for that window. Changing thresholds until trades appear answers a new question.
Keep the first experiment small: two entry rules and one baseline, with everything else fixed. Further tests can change the exit, add a holding limit, or introduce dividend accounting one at a time. Each change needs its own specification and comparison.
Build the rule set in Stratifyre, then inspect one trade that entered before the decline finished. The useful outcome is an entry and exit you can explain, including what happens when “oversold” fails to mean “about to bounce.”
Put your strategy rules to the test
Build your strategy, inspect historical trades, and review the assumptions behind your results.
Build and test your strategy