Build a stock breakout scanner with an explicit relative-volume rule
Define the breakout, volume baseline, session, and alert timing so your stock scanner answers one precise question.
A stock breakout scanner should answer a concrete question: did this stock close above its recent range while trading more volume than the comparison window? “Price breaking out with high RVOL” leaves too much undecided. Which price? Which range? Relative to the previous bars, the same time yesterday, or an average of several sessions?
Start with a short watchlist, one bar interval, and two conditions joined by AND. The recipe below uses completed five-minute bars and a trailing-volume comparison. Its numbers are hypothetical arithmetic examples, not observed scanner alerts or evidence of profitable trades.
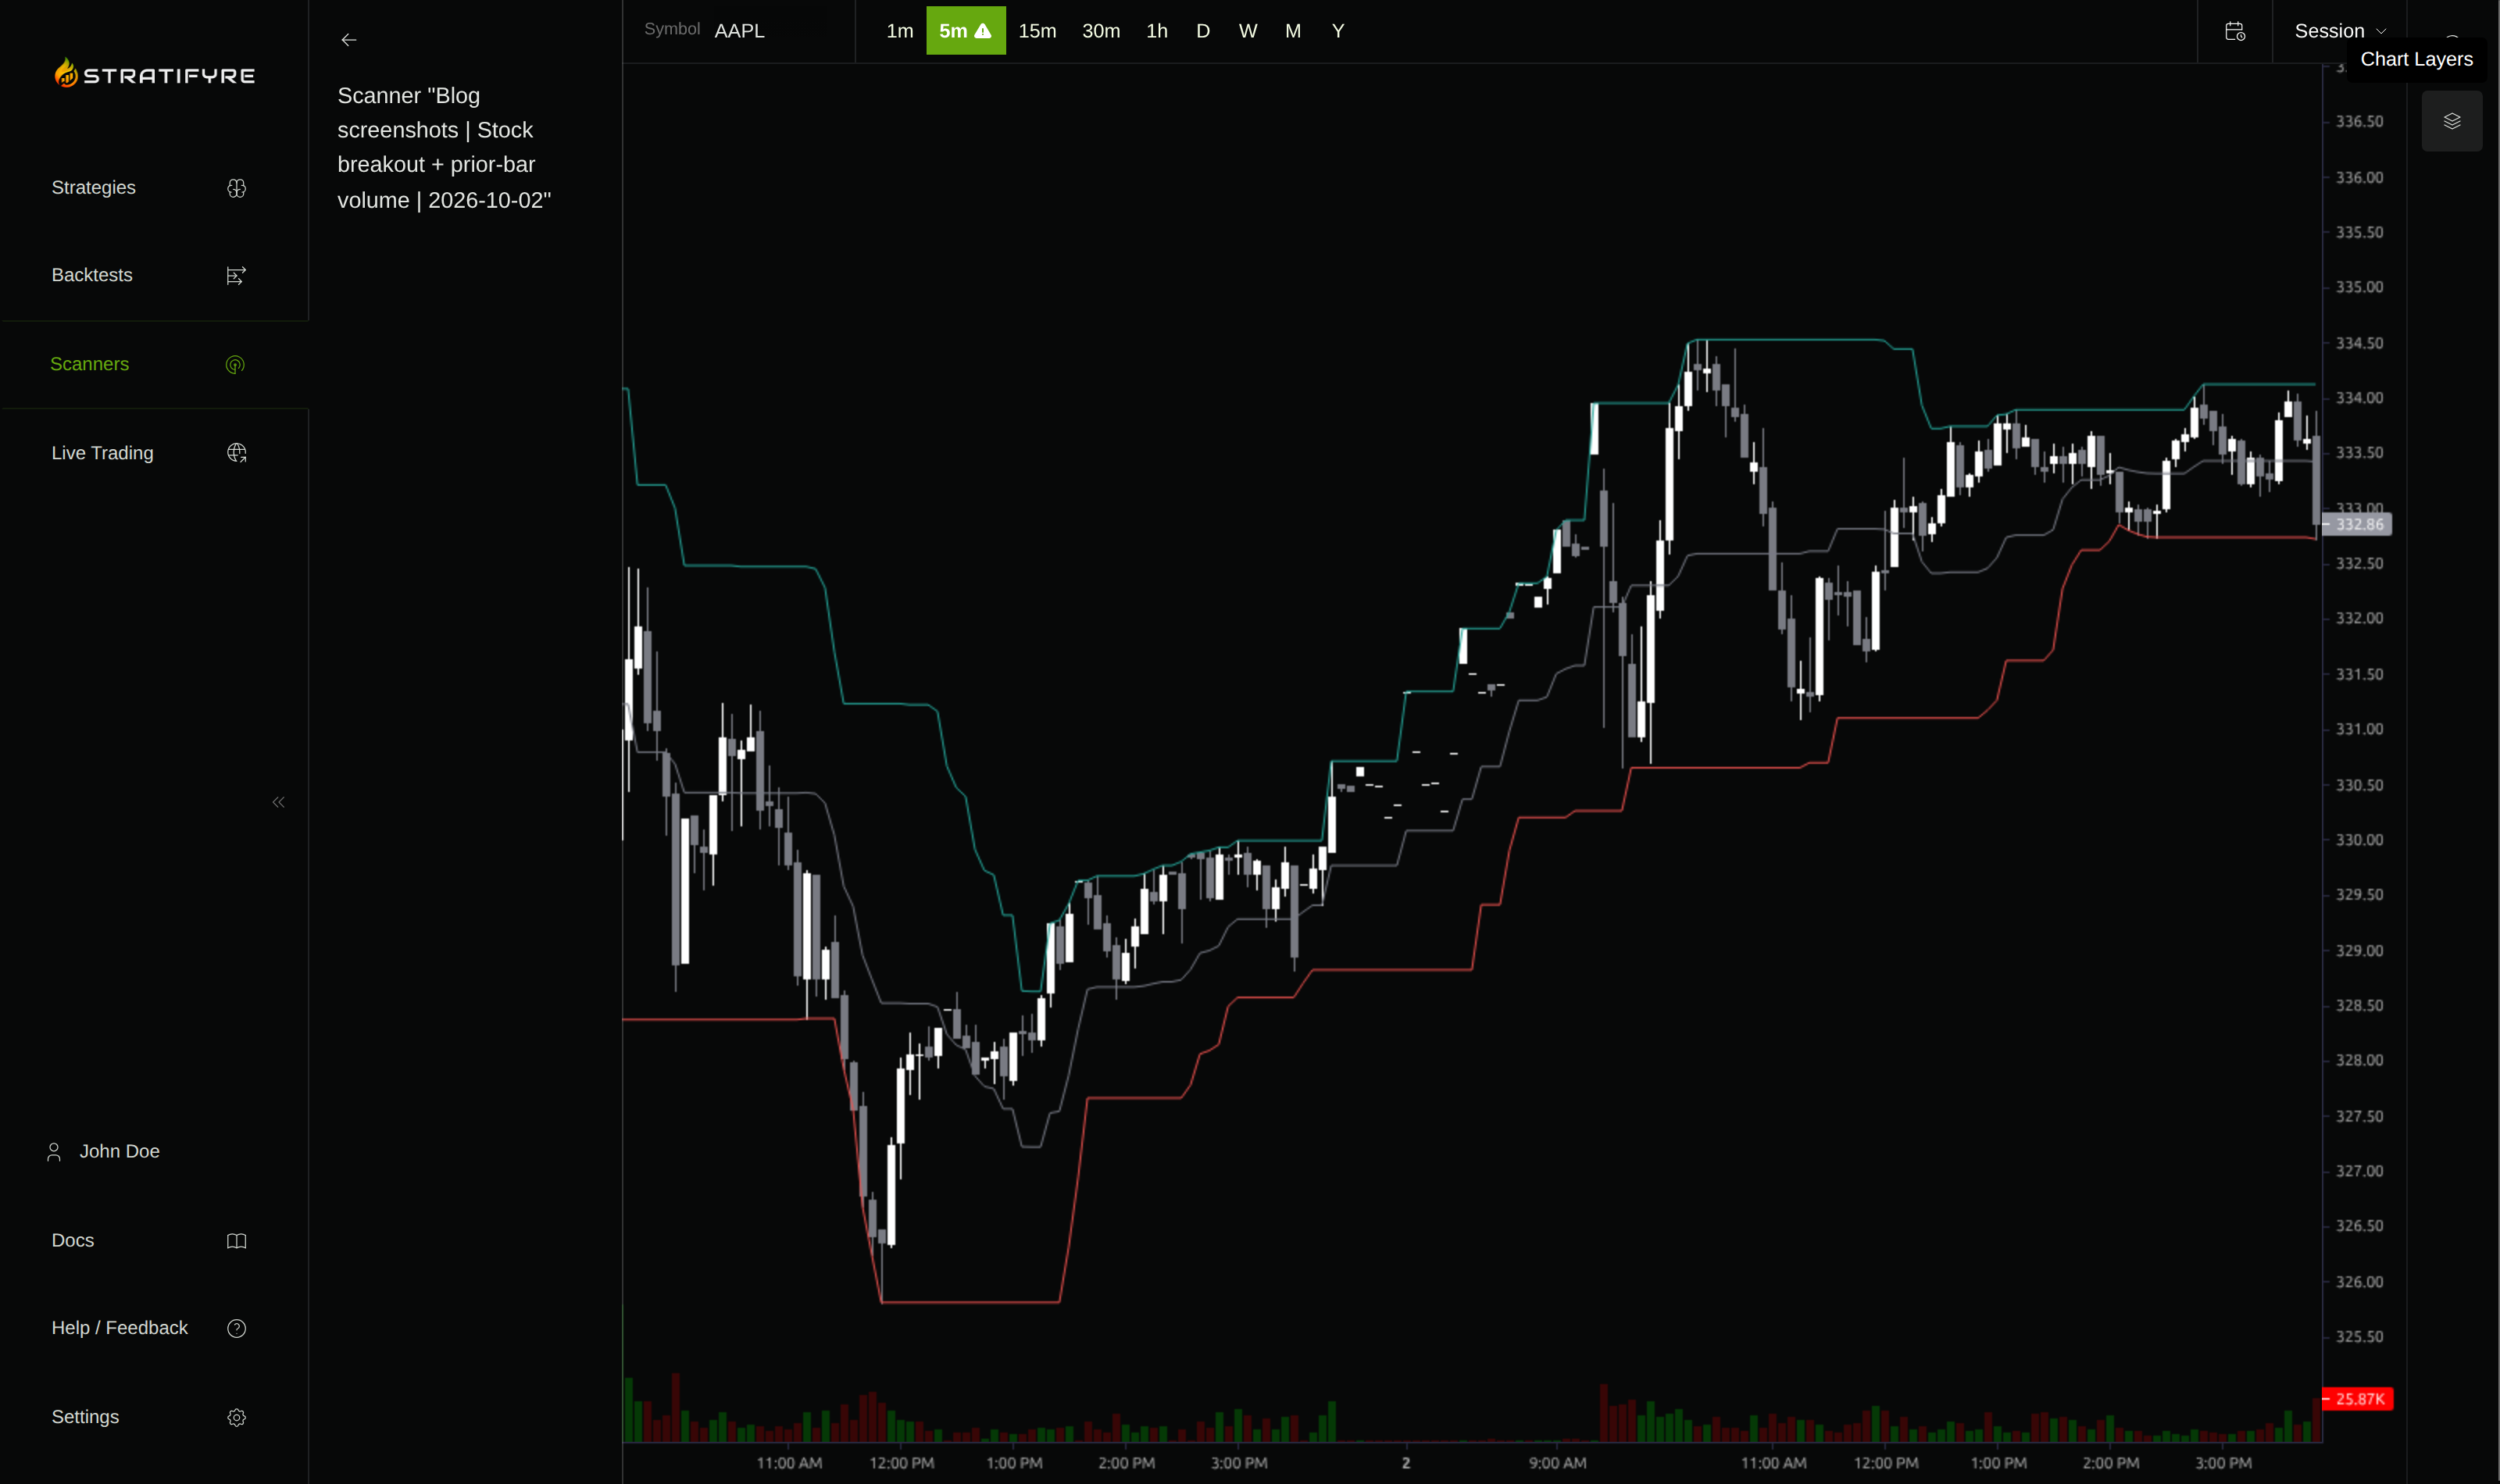
The product screenshots show a saved demo-account scanner for AAPL, MSFT, and NVDA. Its bounded activation occurred outside the regular session, when the product changed it to Idle; no trigger was recorded. The scanner was stopped afterward, so these captures establish the saved setup and empty history rather than a successful stock match.
Decide what relative volume means
Relative volume is a ratio. Its usefulness depends on what sits beneath the division sign.
| Comparison | Denominator | Question it answers |
|---|---|---|
| Trailing-bar relative volume | Mean volume of the previous N equal-length bars | Is this bar busier than recent bars? |
| Same-time-of-day relative volume | Mean volume of the matching bar in prior sessions | Is this time slot busier than that slot usually is? |
| Cumulative relative volume at time | Mean volume from session open to the same elapsed time in prior sessions | Has the session traded unusually much volume so far? |
An at-time calculation also needs an explicit anchor and a choice between single-bar and accumulated volume. TradingView’s indicator reference distinguishes those two modes; the table above uses a session-open anchor for its cumulative comparison. TradingView at-time indicator reference.
TradingView’s published screener definition illustrates the first two: its ordinary relative-volume calculation compares current volume with the previous ten bars, excluding the current bar; its at-time calculation compares matching five-minute bars across prior days. Those are definitions of that provider’s calculations, not universal RVOL defaults. TradingView calculation reference.
For this recipe, choose current completed five-minute volume divided by the mean of the previous twenty completed five-minute volumes. Both numerator and denominator belong to the same stock and feed. Twenty bars is a teaching choice, not a recommended optimum.
A trailing mean does not normalize the time of day. An opening bar compared with yesterday afternoon answers a different question from an opening bar compared with previous openings. If your aim is “unusual for 9:35,” choose an actual at-time calculation with a documented session anchor; changing a trailing average’s length will not create one.
Volume oscillators are different again. Fidelity’s volume oscillator measures the percentage difference between two volume moving averages. That can describe changing activity, but it is not the single-bar ratio used here. Fidelity volume-oscillator guide.
Bound the watchlist and the session
Choose three to five stocks you already monitor. Record the exact instrument identity and data source for each; a ticker alone does not establish which feed supplies its bars. Confirm that the feed has the required five-minute history and current volume before treating a quiet scanner as evidence that nothing happened.

Use regular-session data for this example. NYSE lists the core equity session as 9:30 a.m.–4:00 p.m. Eastern Time, with holidays and specified early closes. Use America/New_York when defining the session so daylight-saving changes do not turn a local-market rule into a fixed UTC schedule. Check the calendar for the trading date. NYSE trading hours and calendar.
The intended window is strict: twenty immediately preceding, completed five-minute bars from the current regular session, followed by the bar being evaluated. Exclude premarket and after-hours bars. Do not carry yesterday’s bars into this denominator. Treat missing bars as missing data; do not silently substitute zero volume or a shorter average.
This choice means the first eligible signal bar on a normal session spans 11:10–11:15 a.m. Eastern: twenty earlier bars have completed since 9:30. It deliberately misses early breakouts. A scanner aimed at the opening minutes needs a different baseline, such as verified same-time-of-day history; it should not pretend to have twenty current-session observations.
Loading historical data to warm an indicator and enforcing a current-session-only window are separate requirements. A regular-hours scheduling setting also does not, by itself, prove that an indicator resets at the open. Inspect the timestamps included in the calculation. Keep the handling of auction prints consistent across the compared bars.


Write the two conditions before configuring them
Use the same twenty previous bars for the price range and volume baseline. Exclude the signal bar from both reference windows.
Prior window:  20 completed 5-minute bars  in the current session  excluding the signal bar
Reference high:  max high of prior barsReference volume:  mean volume of prior bars
Match at signal-bar close:  close > reference high  AND volume >=    1.5 * reference volume
Require all twenty bars and a positive volume reference. A zero denominator produces no valid ratio. The 1.5 threshold is an illustrative rule parameter, not a claim that it distinguishes successful trades.
Using the close makes this a completed-bar breakout. A high that pokes above the reference and closes back underneath does not pass. Evaluating a developing candle would change both the price and volume inputs, so verify which bar is being evaluated rather than inferring signal timing from how often the scanner updates.
Stratifyre’s scanner workflow supports custom conditions combined with AND and an Alert action. The rule should express this exact comparison, including the excluded signal bar and the session window. Do not assume a volume moving average automatically has those properties. A generic moving average defaults to a price source unless volume is selected; a current-bar mean also has a different denominator from the prior-bar mean defined above.
If the available rule cannot express the intended history and session boundaries, choose a supported, explicitly named alternative before activating it. Save the revised definition alongside the scanner so a future alert remains interpretable.

close[1] must exceed upper[2].
volume[1] ≥ 1.5 × SMA(volume, 20)[2]. The saved rule joins it to the price condition and additional positive-reference, timestamp-span, current-session, completion, and freshness checks with AND; no observed match has yet reconciled those inputs.Check cases that should stay silent
Suppose the previous twenty eligible bars have a combined volume of 2,000,000 shares and a highest high of $100.00. Their average volume is 100,000 shares. The following rows are independent hypothetical cases using that reference window.
| Case | Close | Bar volume | Ratio | Expected match |
|---|---|---|---|---|
| Price only | $100.20 | 90,000 | 0.90 | No: volume fails |
| Volume only | $99.80 | 180,000 | 1.80 | No: price fails |
| Both conditions | $100.20 | 160,000 | 1.60 | Yes: both pass |
Check the boundaries too. A close of exactly $100.00 fails the strict price comparison. Volume of exactly 150,000 passes the >= 1.5 volume comparison, provided the price condition also passes.
Current-bar inclusion can change that answer. If nineteen previous bars each traded 100,000 shares and the signal bar traded 150,000, a twenty-bar average including the signal bar is 102,500. The resulting ratio is about 1.46, below the threshold. Using twenty previous bars of 100,000 gives exactly 1.50. Both calculations are valid arithmetic; they implement different rules.
When checking a real match, retain the signal bar’s timestamp, close, volume, reference high, reference average, and bar count. A chart that merely looks busy cannot establish that the correct denominator was used.
Make the alert useful, then inspect its meaning
Attach one Alert action to the combined rule. Choose a rule trigger limit deliberately: a condition can remain true across several evaluations, while a crossing condition describes a transition. They should not be treated as interchangeable ways to reduce repeated alerts.
Notification delivery and rule matching are separate checks. Confirm the enabled delivery preferences before activating a scanner, then reconcile a genuine recorded match with its underlying bars. Record whether the evidence is live, historical, or replayed. A hypothetical case in a table cannot establish delivery behavior.
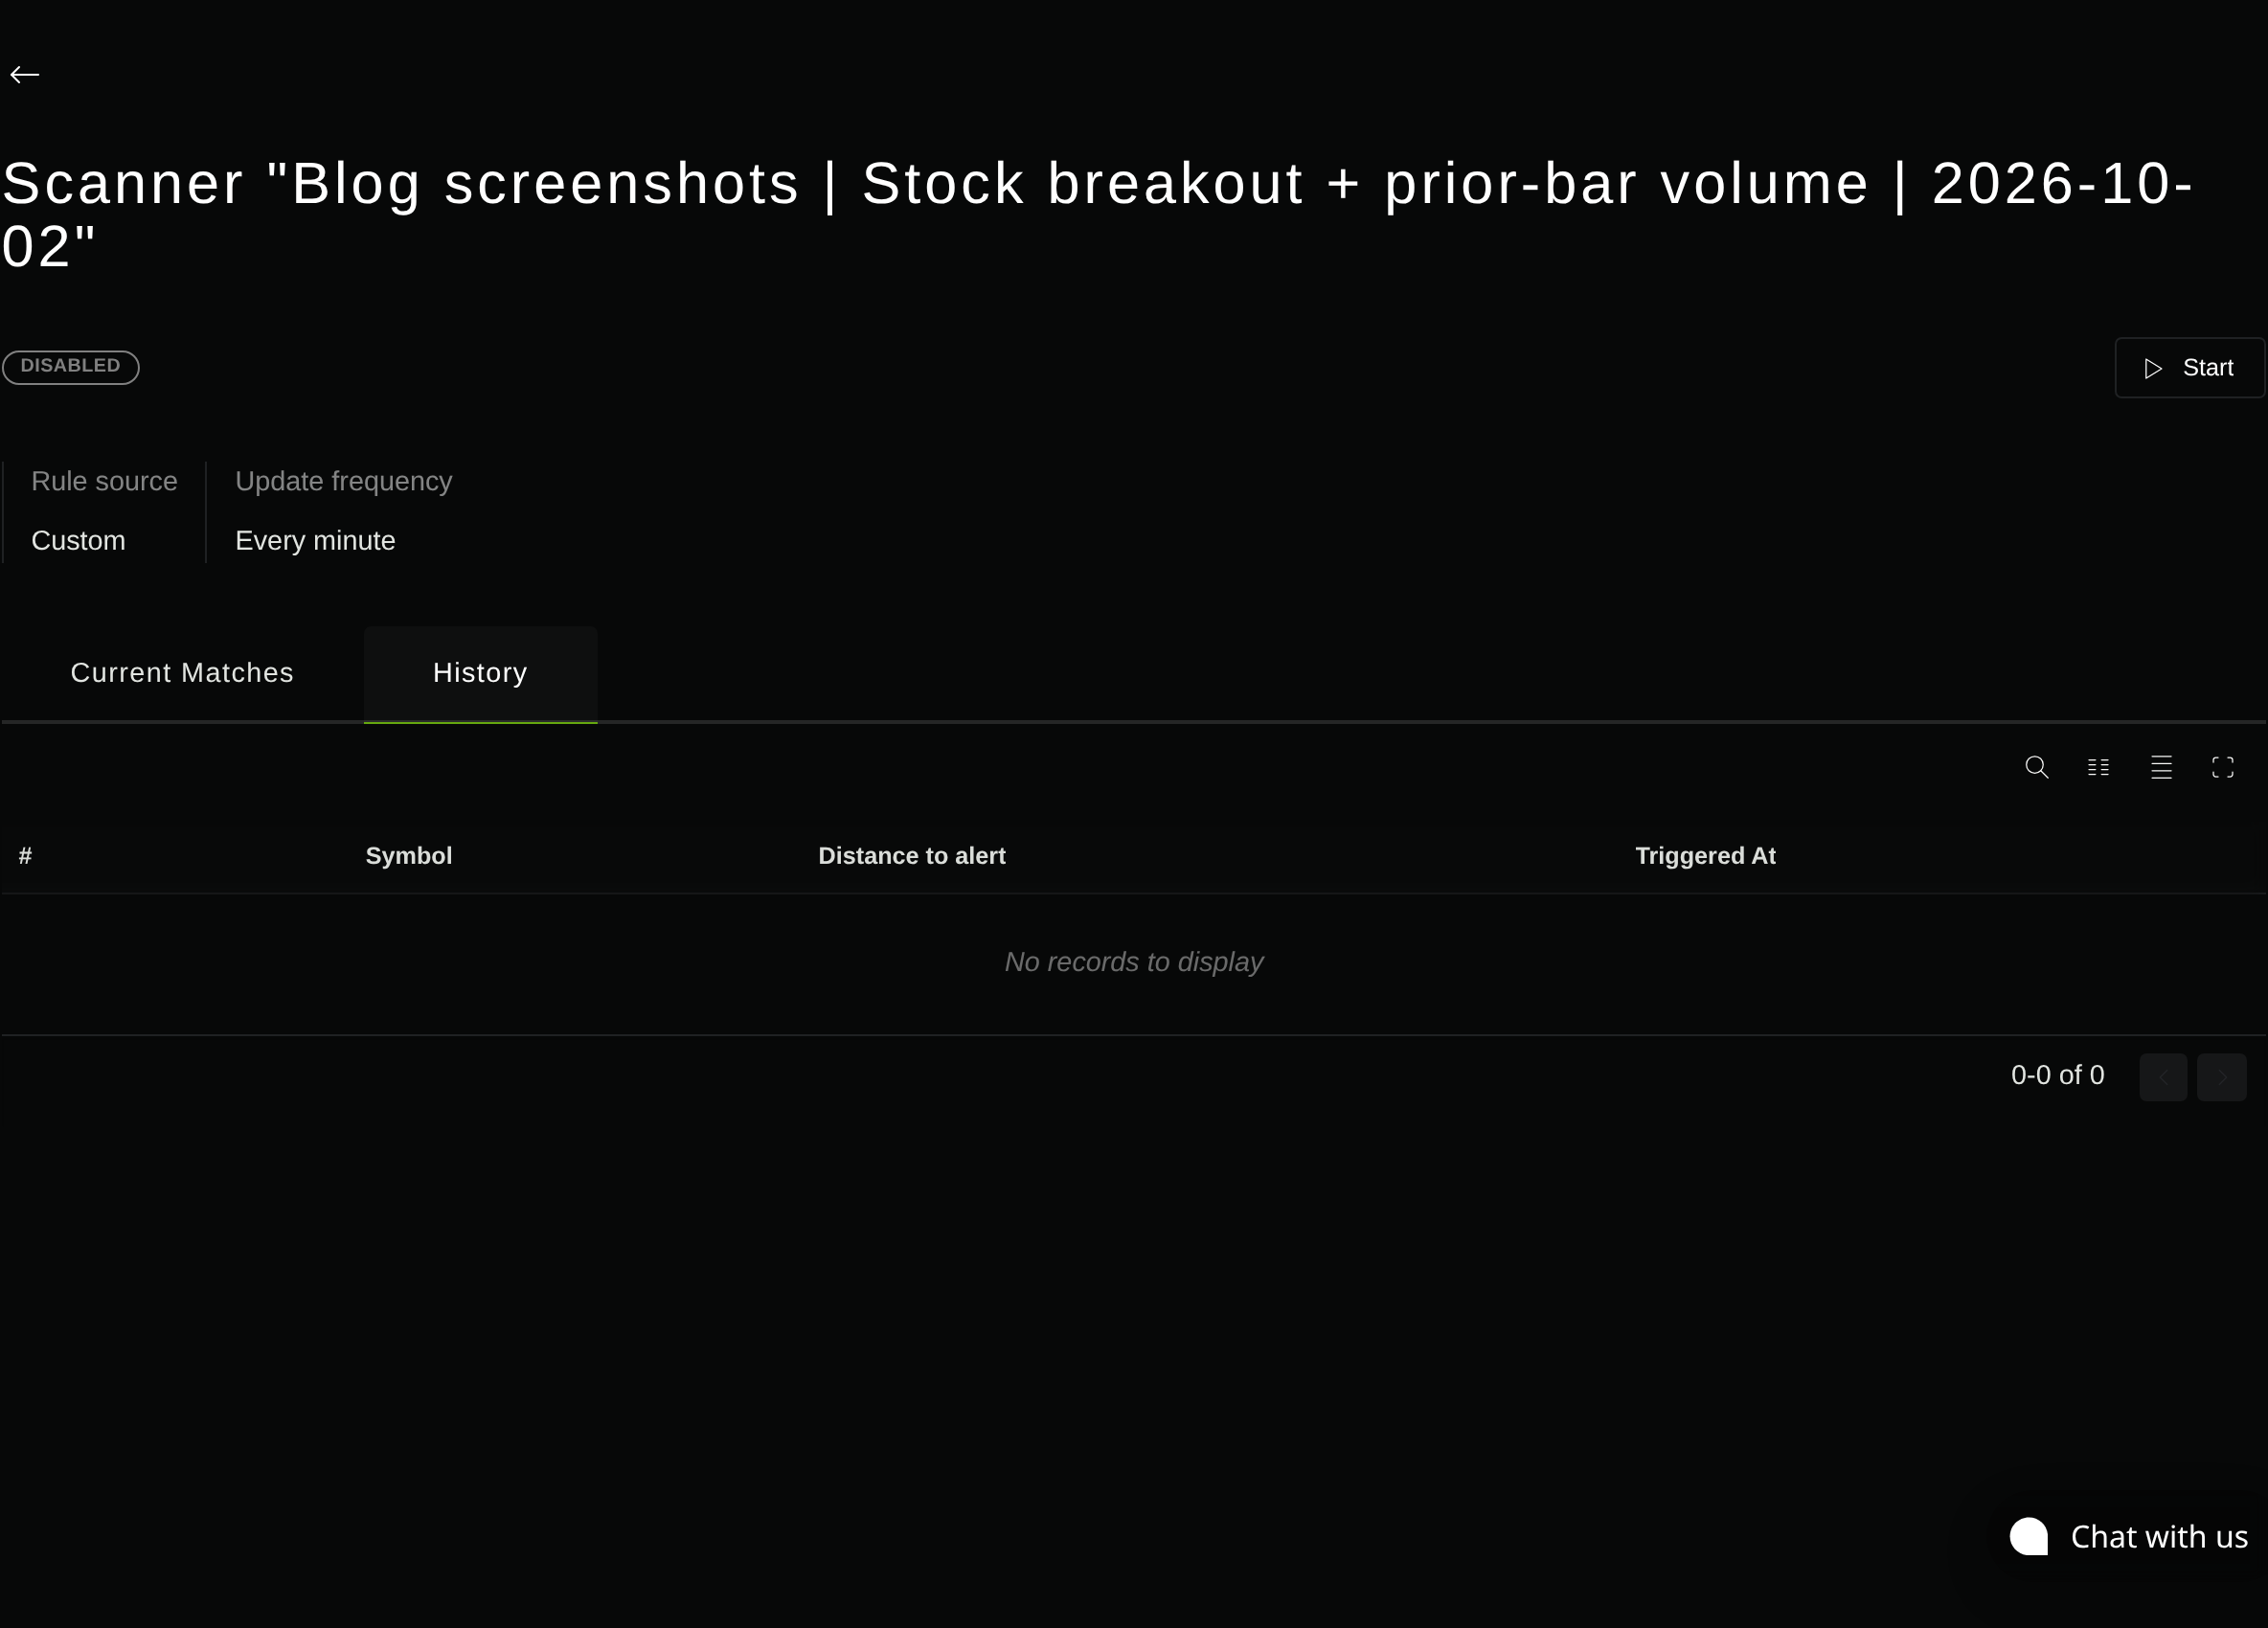
Review price-only and volume-only observations as carefully as matches. They help reveal an accidental OR condition, an incorrect price field, or an unexpected history window. Also check the first eligible bar after the open and a date with a different session length.
A breakout-plus-volume alert identifies a stock for further inspection. It does not specify an entry fill, position size, stop, exit, spread, or trading cost, and it does not establish a positive trading outcome.
Use the scanner creation guide to configure one bounded watchlist scanner, then check that its saved rule matches your written price, volume, session, and alert definition.
Put your strategy rules to the test
Build your strategy, inspect historical trades, and review the assumptions behind your results.
Build and test your strategy