Regular vs. extended hours: why stock backtests disagree
Separate indicator history, entry windows, order fills, and overnight exposure before comparing stock backtests.
Two stock backtests can use the same ticker, moving-average length, and date range yet produce different trades. One may calculate its indicators from regular-session bars. The other may include premarket prices, even though both place new orders only after 9:30 a.m.
Before changing the strategy, write down four separate choices: which bars build the signal, when entries are permitted, when orders can fill, and whether positions remain open overnight. A single “regular hours” label rarely answers all four.
Start with the venue’s session timeline
Regular trading hours for U.S. listed stocks are generally 9:30 a.m. to 4:00 p.m. Eastern Time. Extended trading is venue-specific: an exchange’s early trading session, a broker’s order-entry window, and an overnight trading service can have different boundaries. FINRA’s extended-hours overview.
For a concrete reference, NYSE Arca lists this ordinary-day schedule:
| Session | Eastern Time | Backtest question |
|---|---|---|
| Early | 04:00–09:30 | Do these bars enter indicator history? |
| Core | 09:30–16:00 | Are entries and exits restricted to this window? |
| Late | 16:00–20:00 | Can pending orders or protective exits execute here? |
Source: NYSE trading hours. These times describe Arca, not every venue trading a U.S. stock. On the same page, NYSE Tape A has a pre-opening order queue ahead of its opening auction; accepting an order is different from executing it.
Use the schedule that applied to the historical dates being tested. NYSE’s separate extended-hours page describes an expansion with conditional launch language. An announced schedule does not establish that older data includes overnight trading, or that your broker and data provider cover it. NYSE extended-hours information.
Separate signal history from entry permission
“Buy only during regular hours” says when an entry is allowed. It does not say which observations a moving average uses.
Consider an illustrative three-bar simple moving average, with invented prices and no historical result:
- A regular-session series ends with closes of $100, $100, and $100. Its average is $100.
- A series including early-session bars ends with $100, $102, and $104. Its average is $102.
At a hypothetical $101 price, “price above its three-bar average” is true with the first history and false with the second. The entry window can be identical. The difference comes from the input sequence.
The effect extends beyond moving averages. A breakout’s previous high might include an early-session spike. ATR might incorporate a gap differently. A volume baseline might mix quiet premarket bars with busy core-session bars. The same indicator name and period do not establish the same calculation.
Also specify how history crosses session boundaries. Does the indicator carry state from yesterday, reset each morning, or wait for enough bars after the open? Does a missing minute remain absent, or become a carried-forward price? “Twenty bars” means twenty observations under the selected convention, not automatically twenty elapsed minutes.
Write two comparable specifications
To diagnose an indicator-history mismatch, change history first while keeping the trading window fixed. The table below is a comparison specification, not a report of executed backtests.
| Choice | A: core-session history | B: extended-session history |
|---|---|---|
| Signal input | Core-session one-minute bars | Early, core, and late one-minute bars |
| Entry window | 09:30–15:55 Eastern | Same |
| Order-fill window | Core session only | Same |
| Overnight holdings | Permitted | Same |
| Indicator state | Carry across dates; no daily reset | Same |
| Rule and sizing | One unchanged rule and position size | Same |
The entry window includes 09:30 and excludes 15:55; the applicable day’s core-session boundaries govern fill eligibility.
Use one symbol and one short, preselected date range. Keep the data provider, price-adjustment basis, capital, fees, slippage, warmup requirement, and signal/fill timing unchanged. Both variants need enough eligible history before scoring begins; equal bar counts can require different lookback dates.
Verify that your tool can implement these choices independently. A setting that changes entry evaluation may leave extended-hours bars in indicator history. If the available controls couple history and trading hours, record every consequence; the result answers a broader question than this comparison.
After each completed run, find the first differing signal. Compare its input bars and indicator values before examining total return. If those agree, move forward to order creation and fill timing. That sequence identifies the cause of the mismatch more directly than comparing two equity curves.
To study extended-hours execution afterward, hold history fixed and change the execution window in a separate comparison. Changing both at once makes it difficult to attribute a difference to signals or fills.
Follow an order across the closing boundary
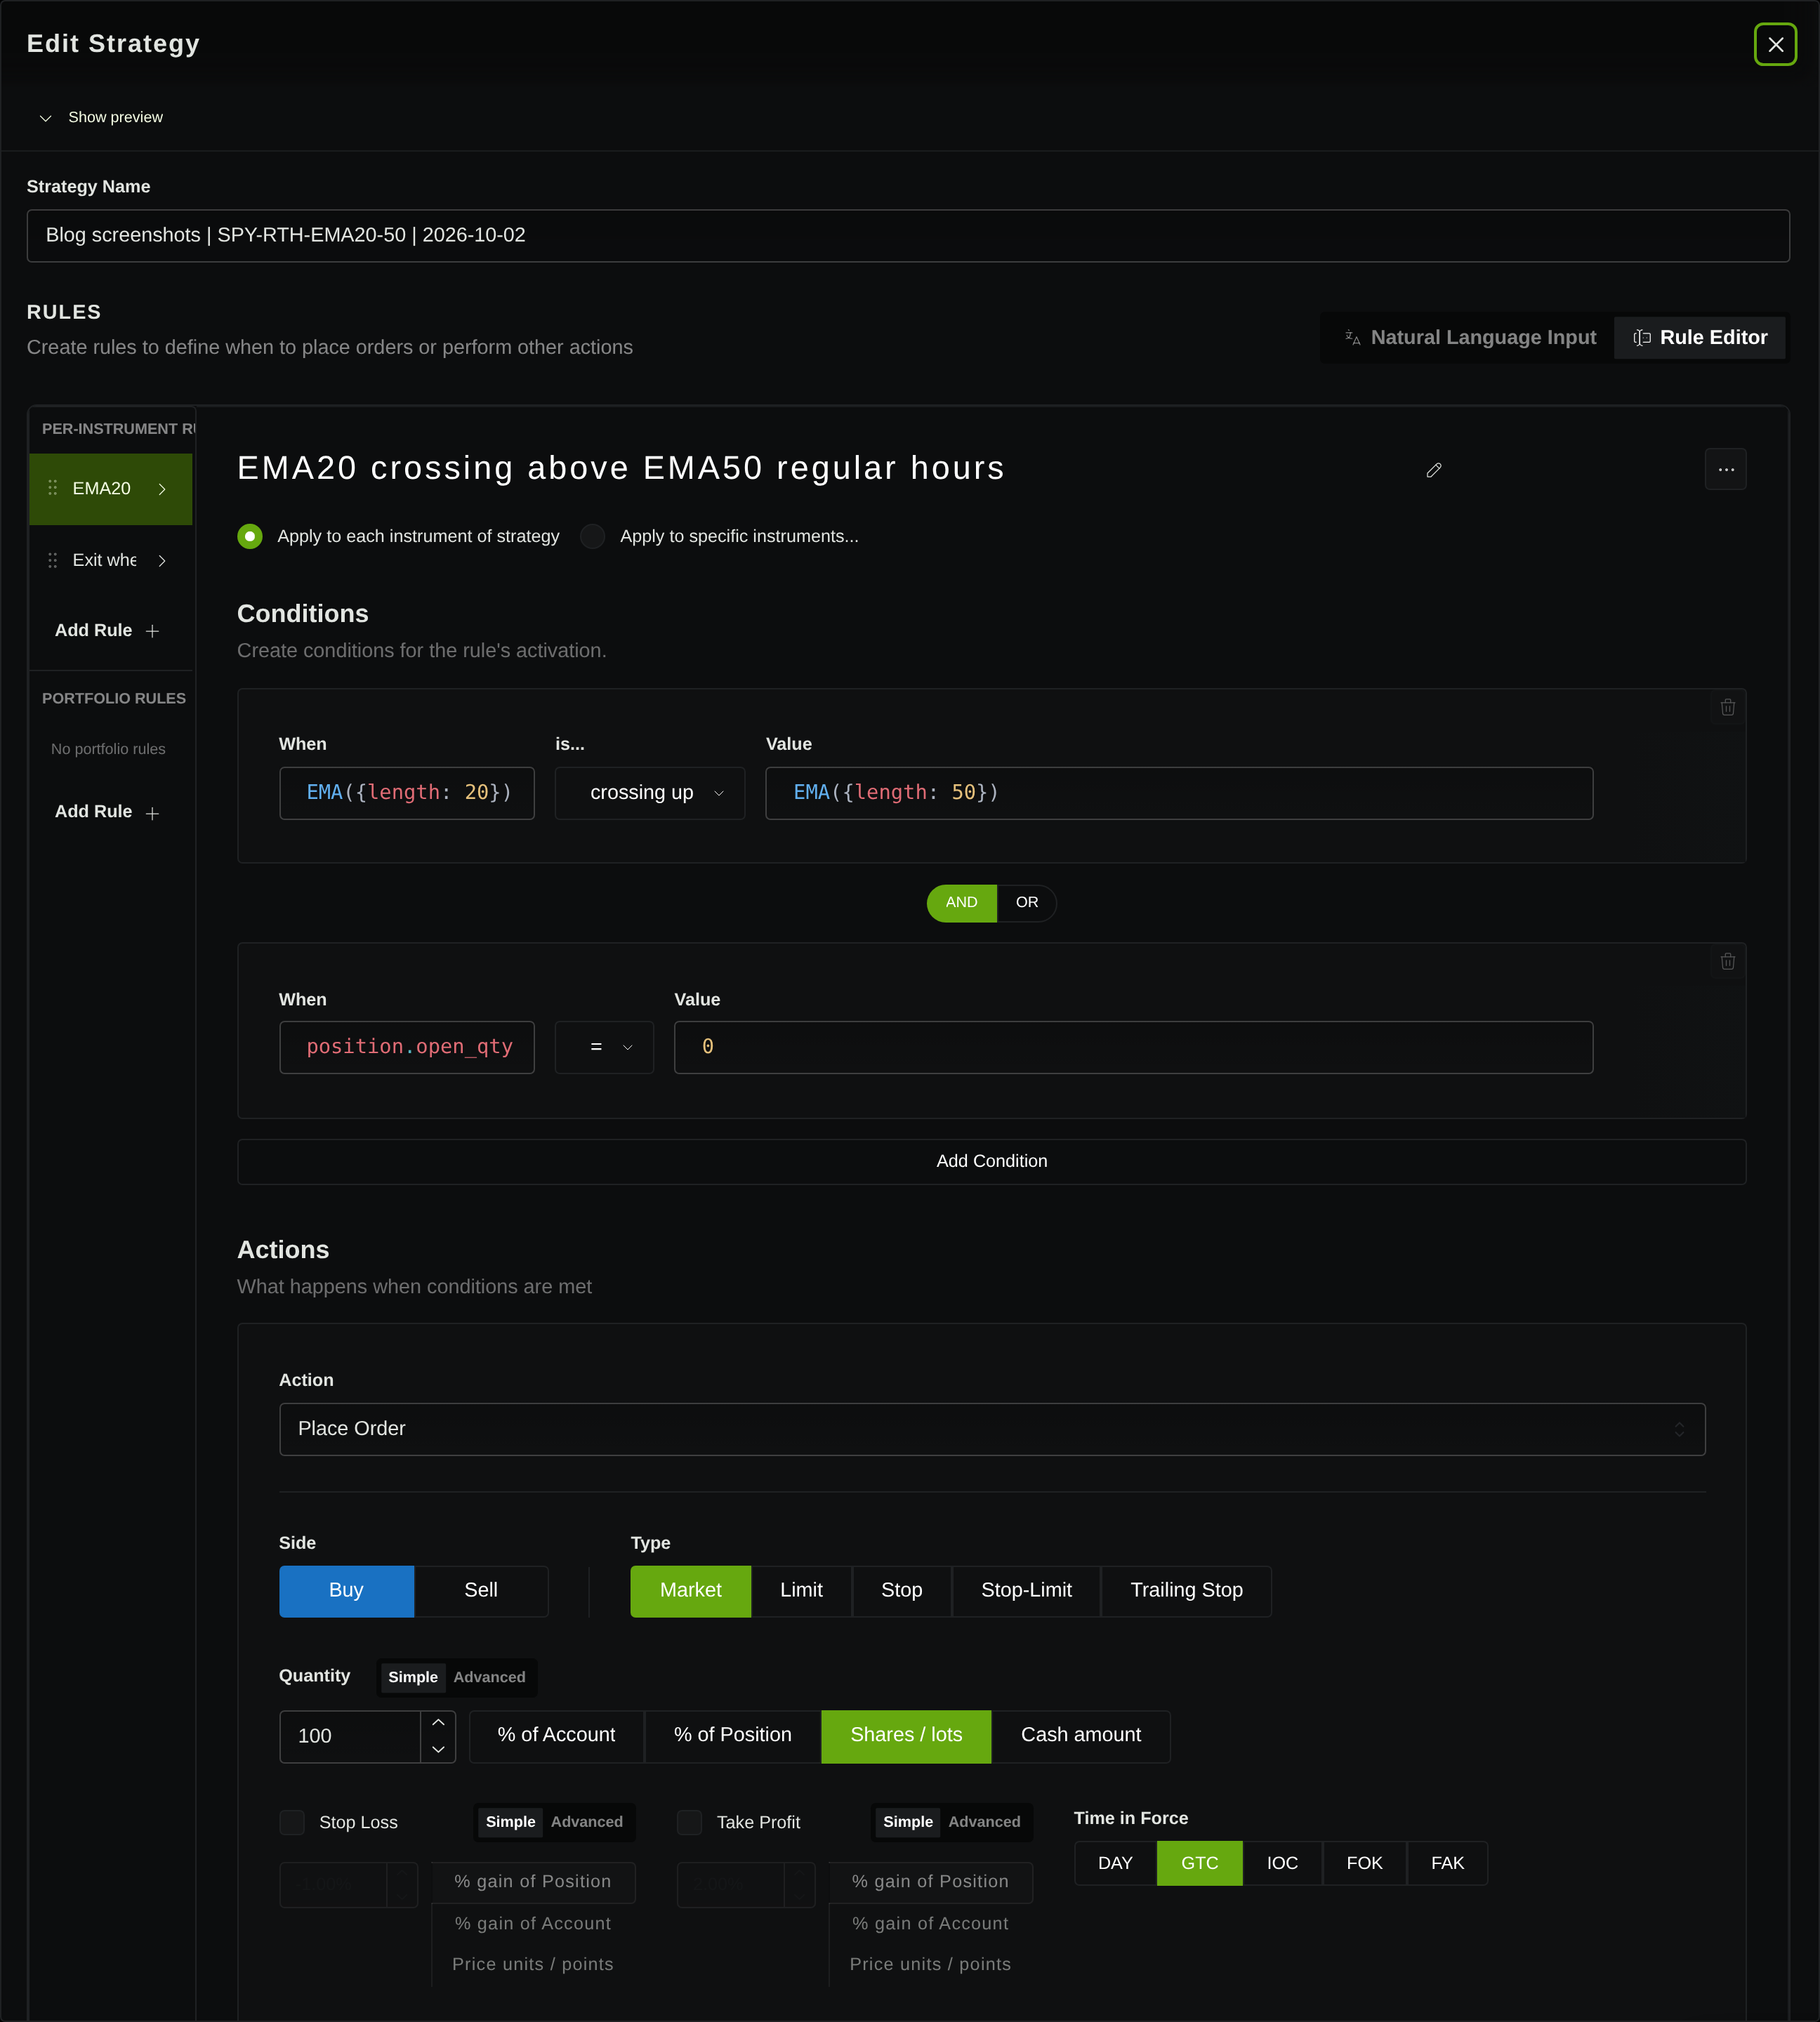
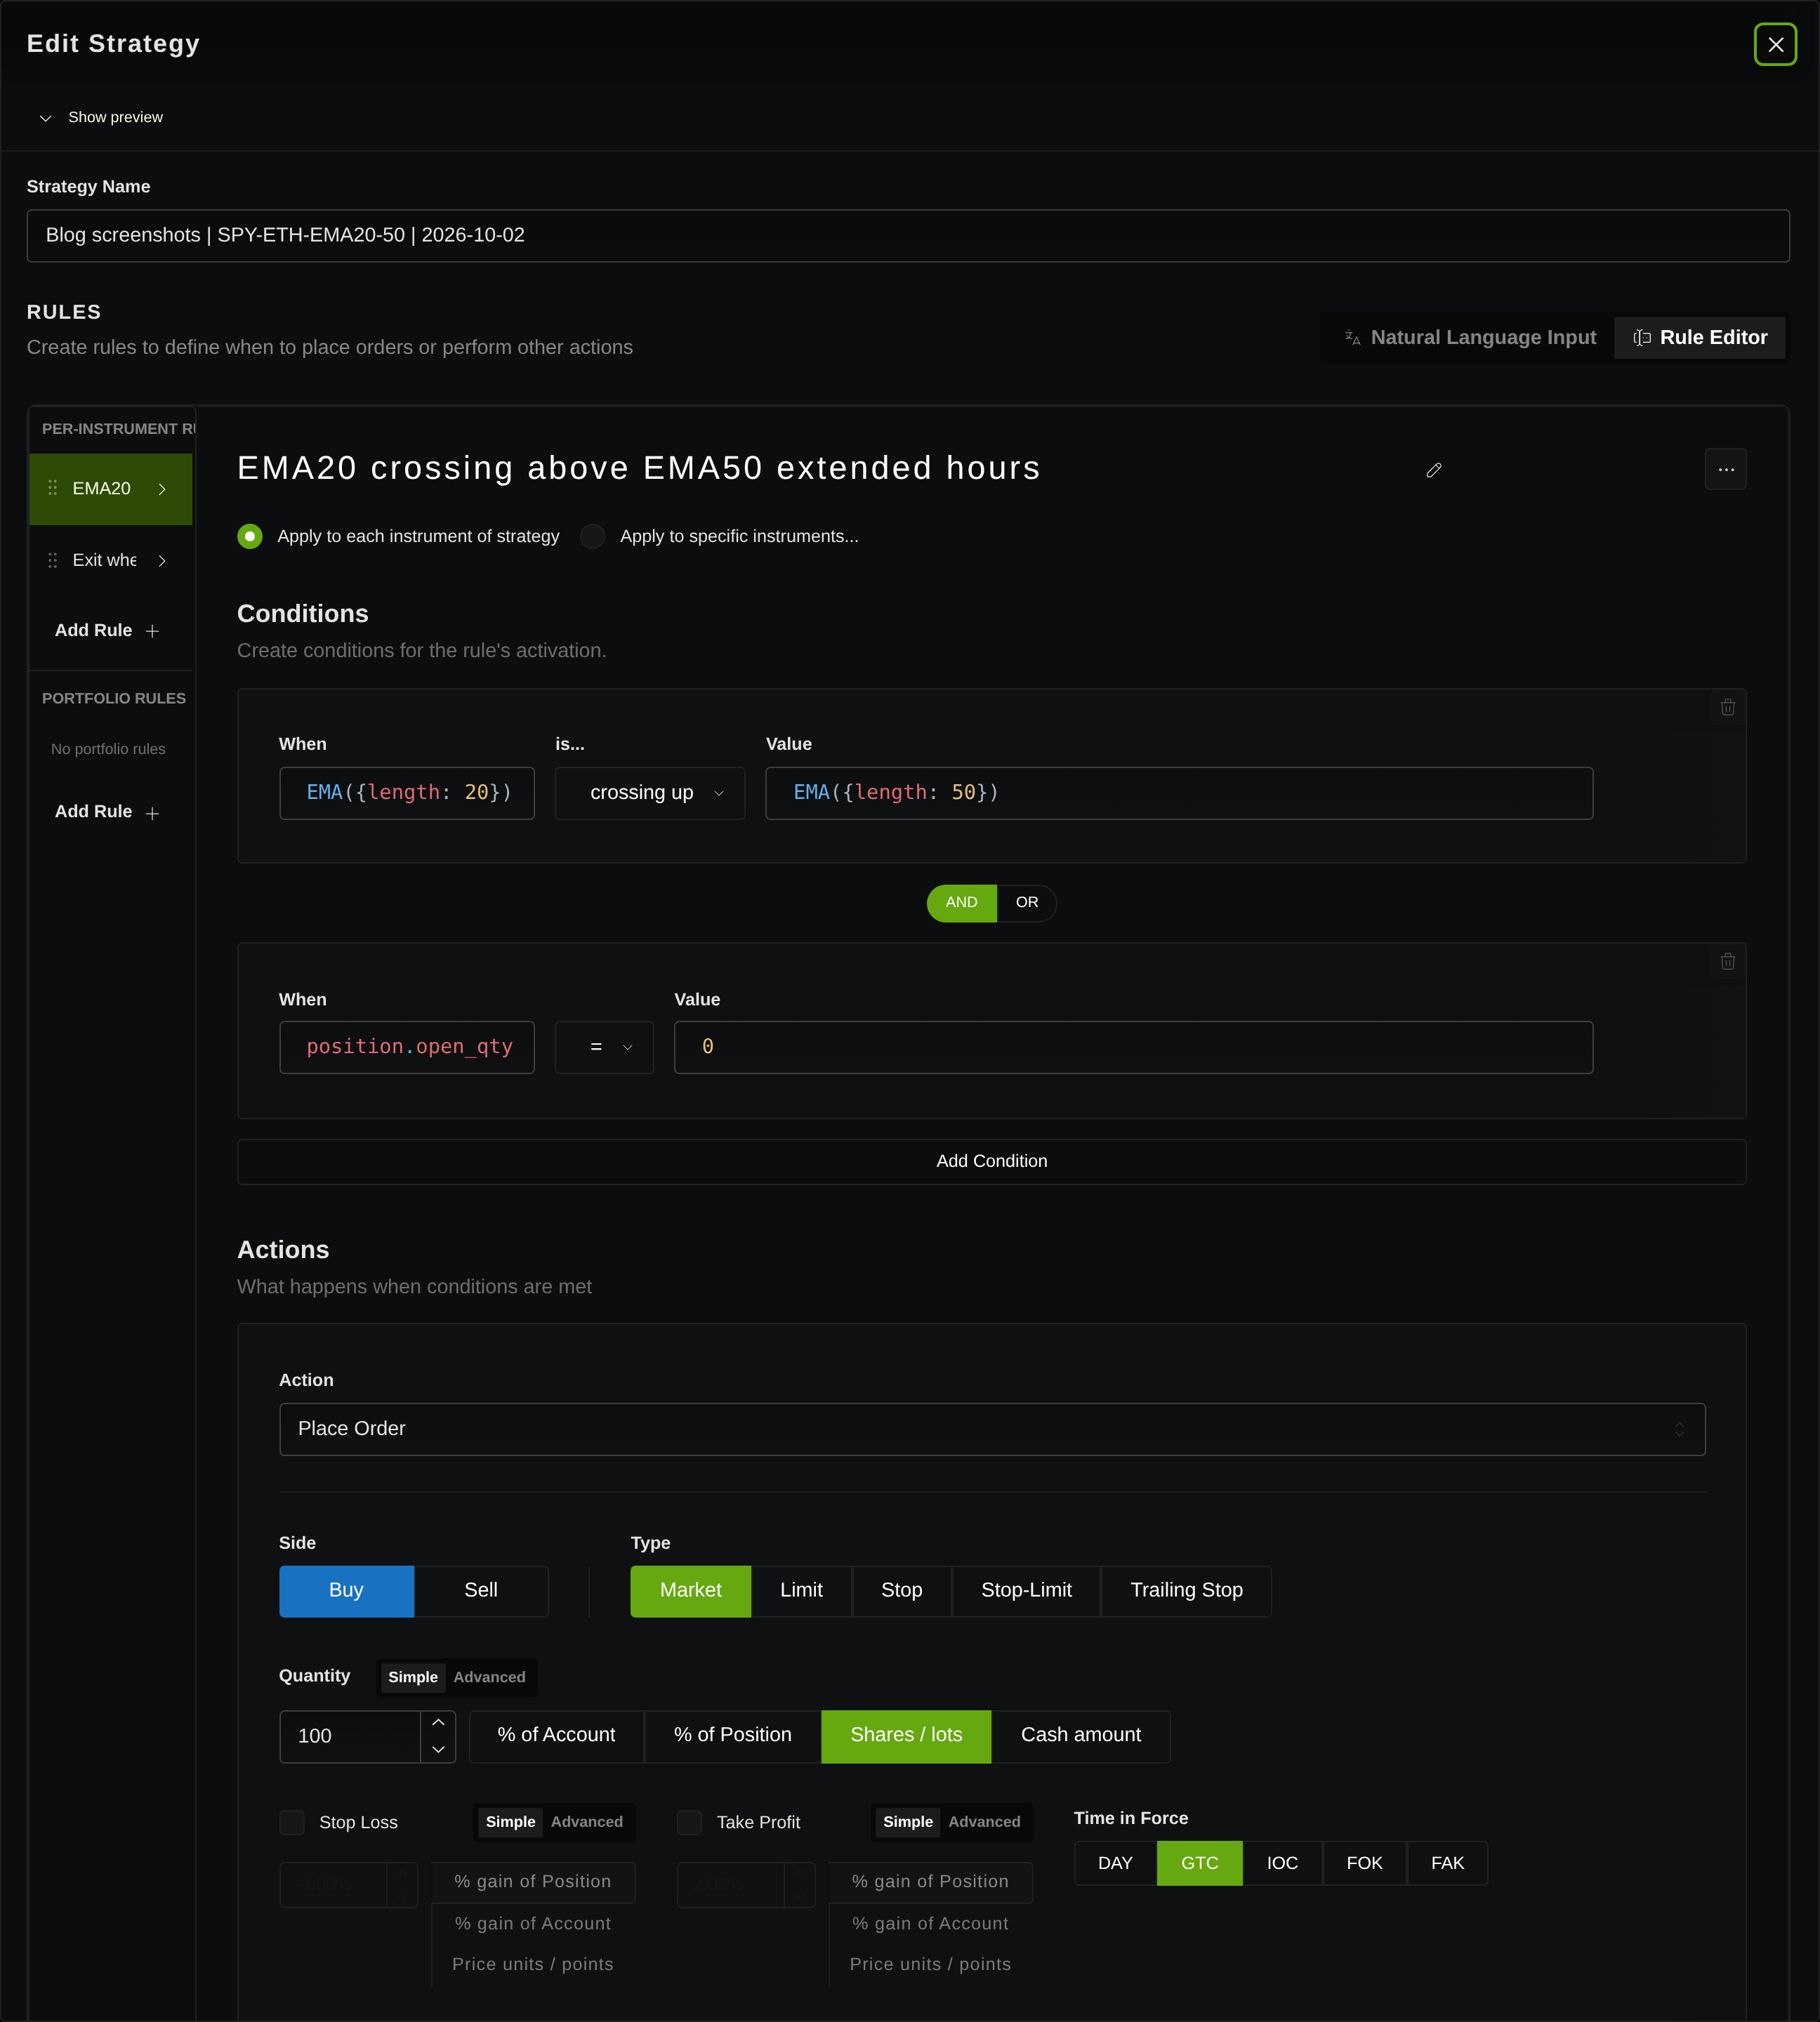
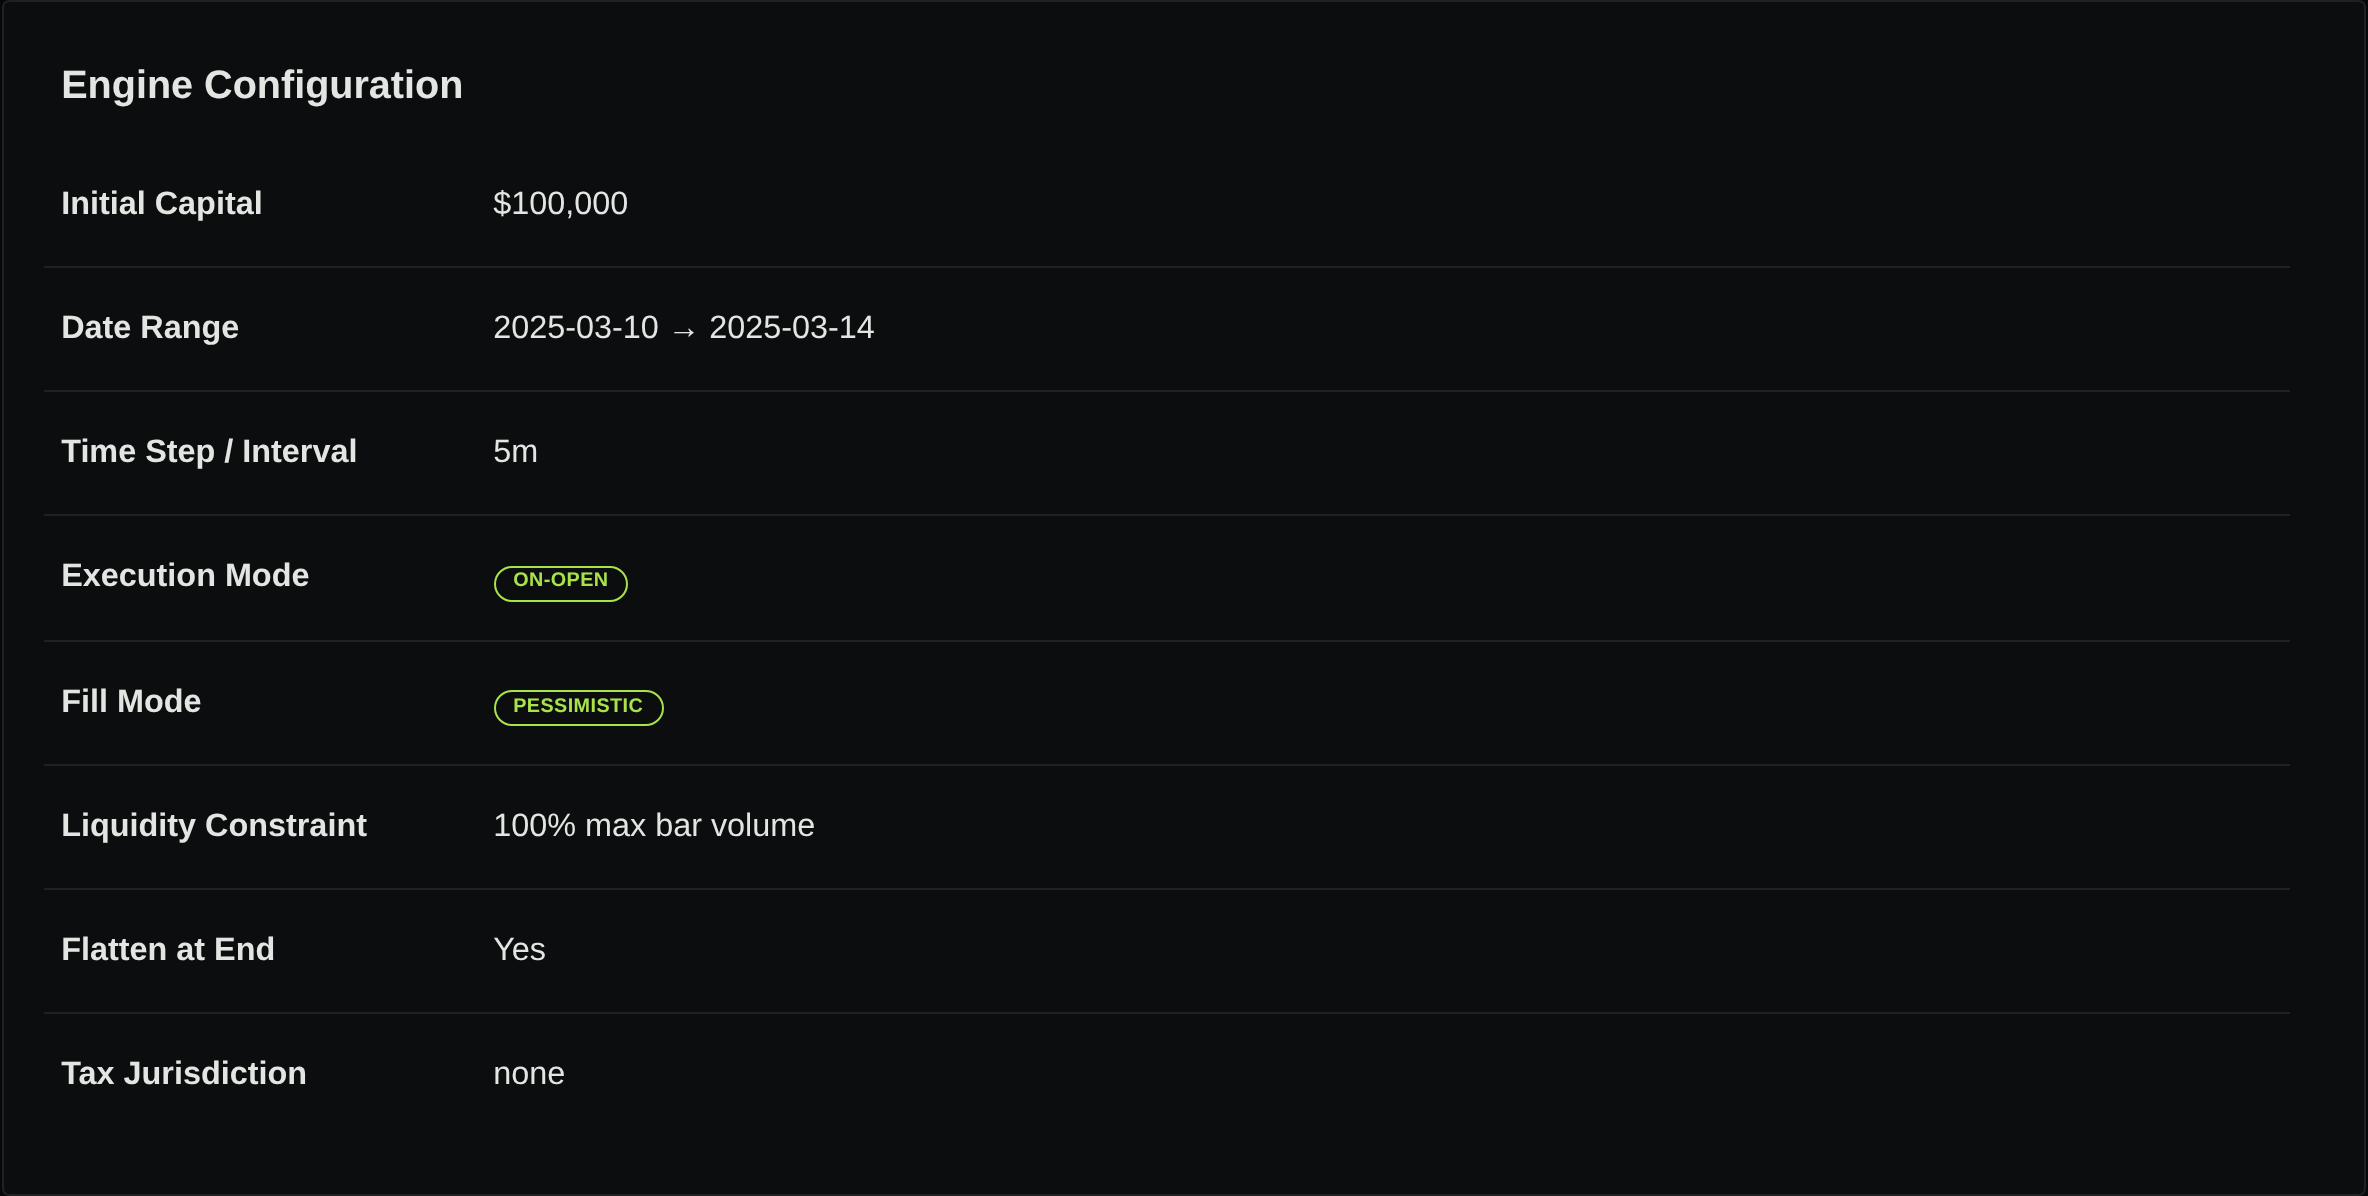
The actual product demonstration below keeps one SPY EMA(20)/EMA(50) crossover strategy, 100-share sizing, $100,000 capital, and March 10–14, 2025 dates fixed. Both runs use five-minute bars and On-Open execution; their saved condition session flags differ. This is the product’s broader regular-versus-extended treatment, not proof that indicator history, entry permission, and fill windows can be varied independently as in the one-minute specification above.
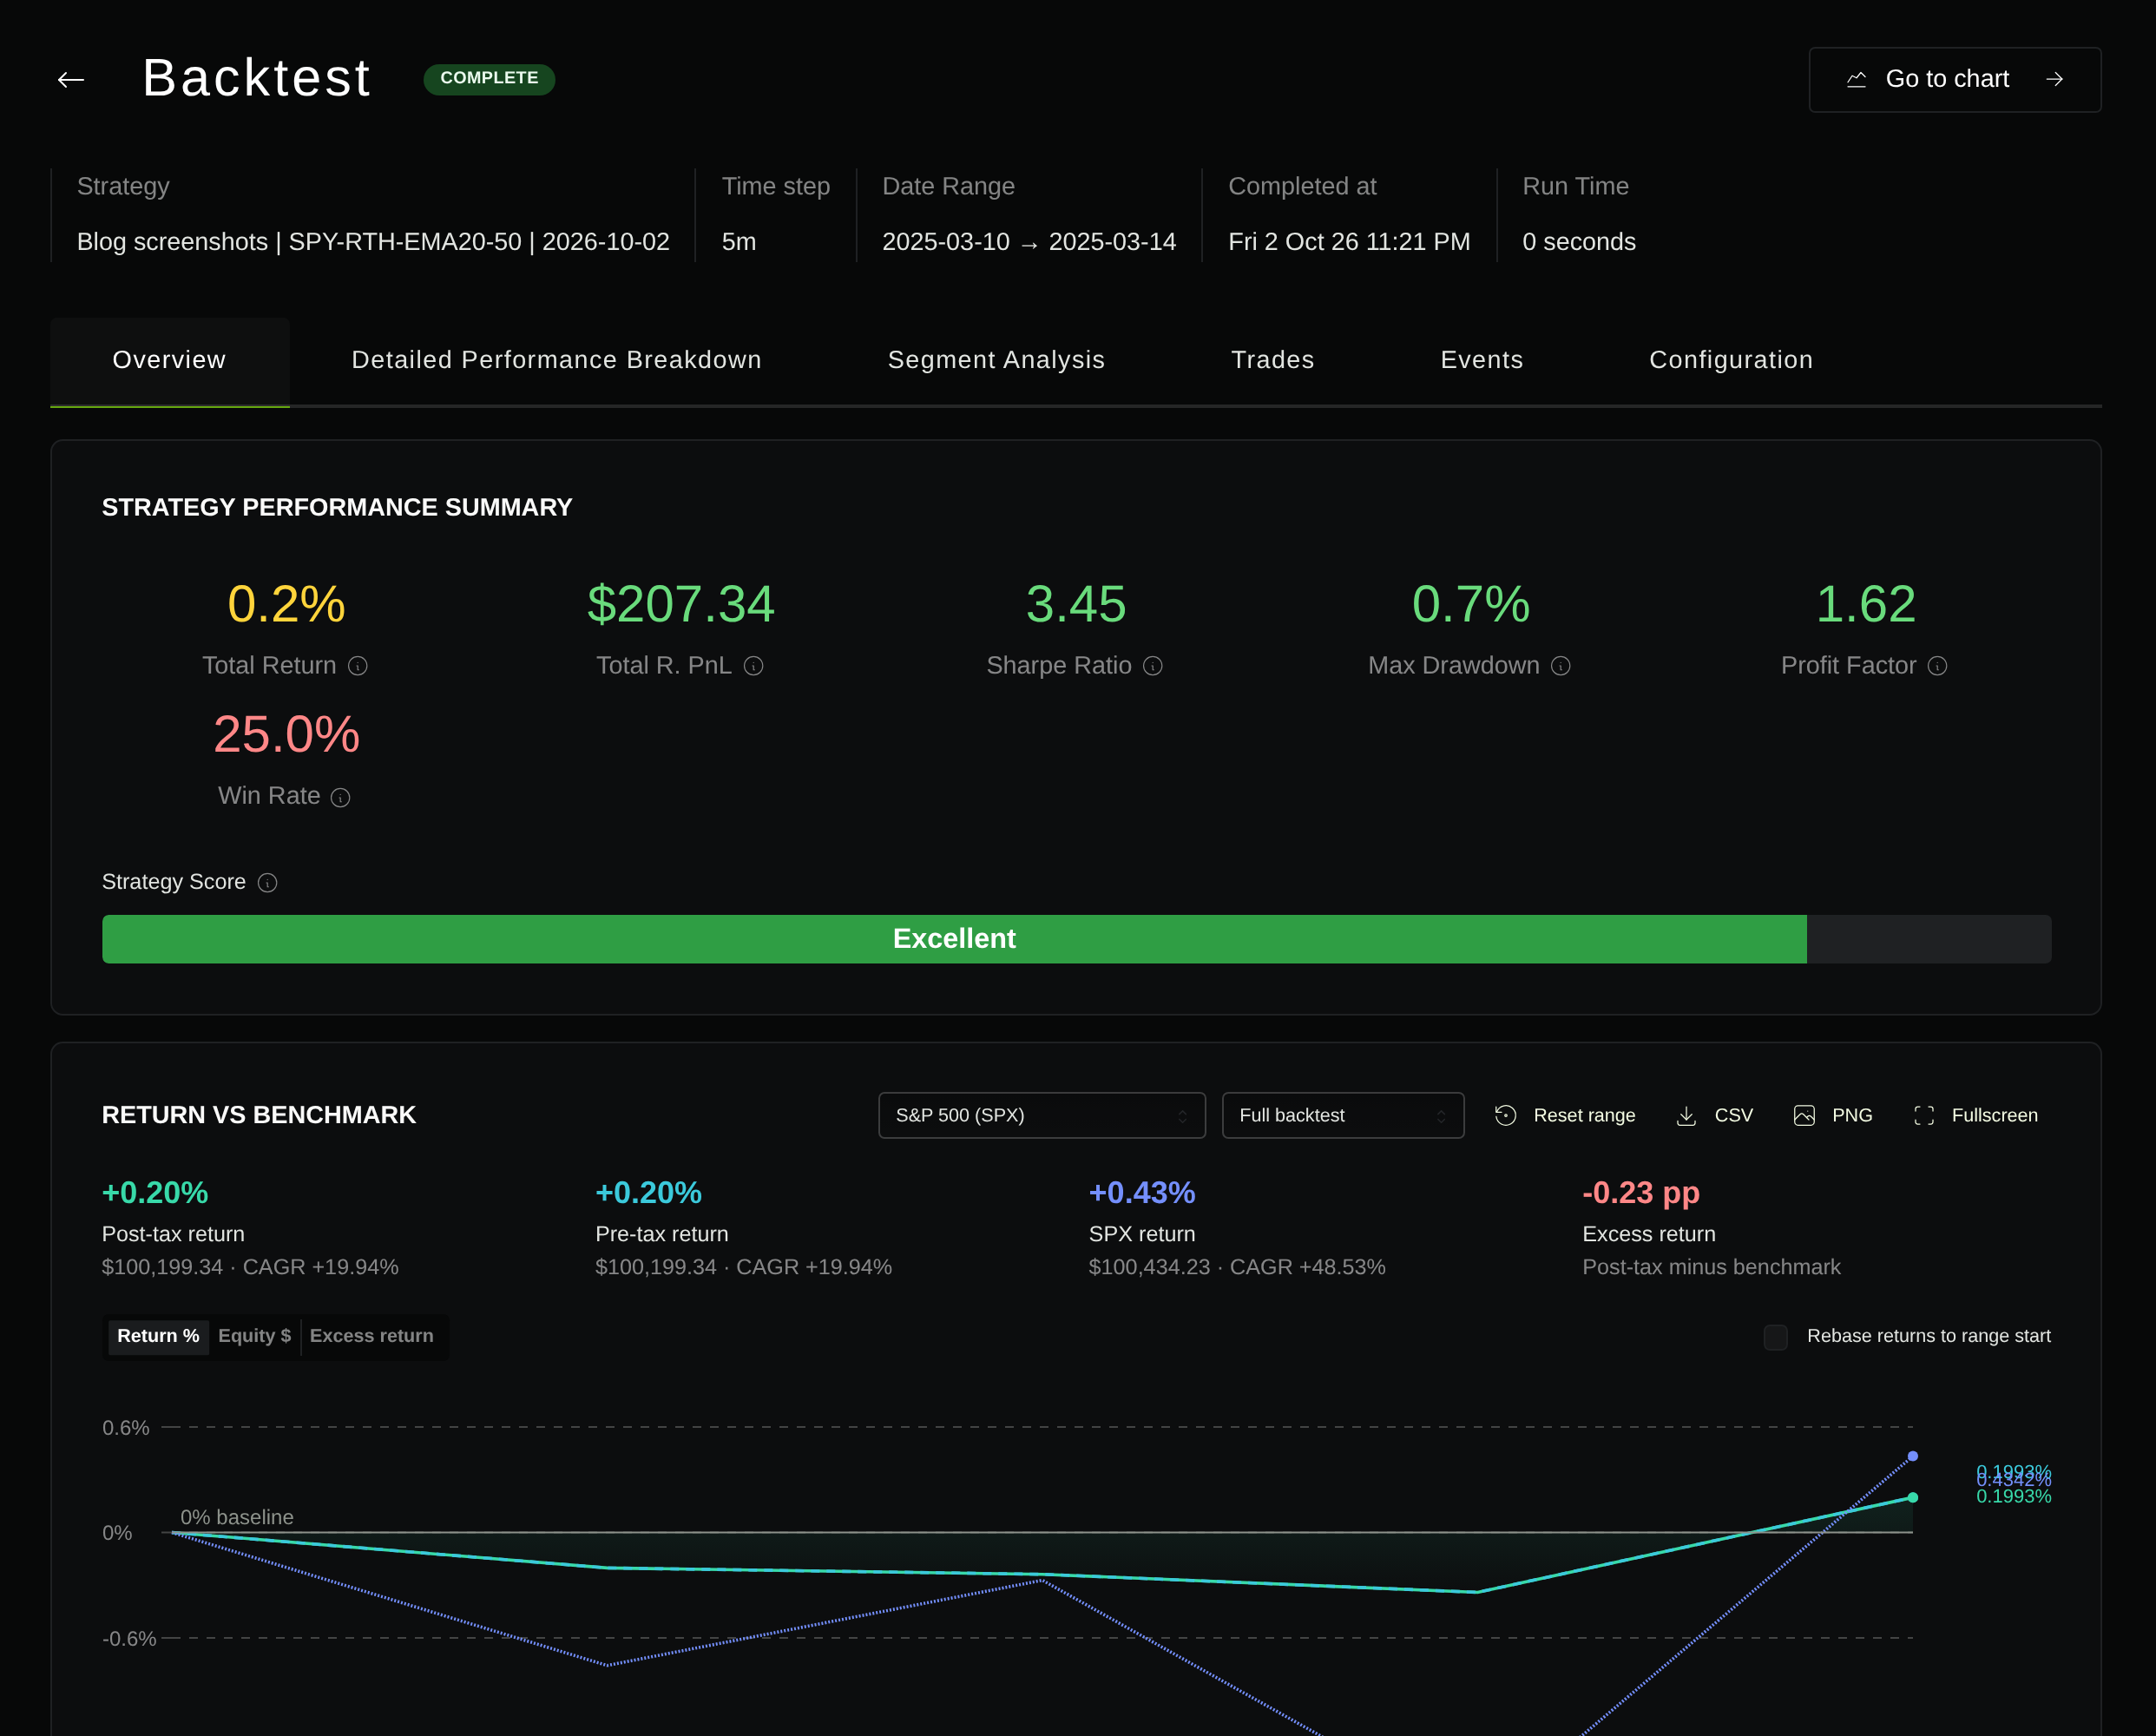
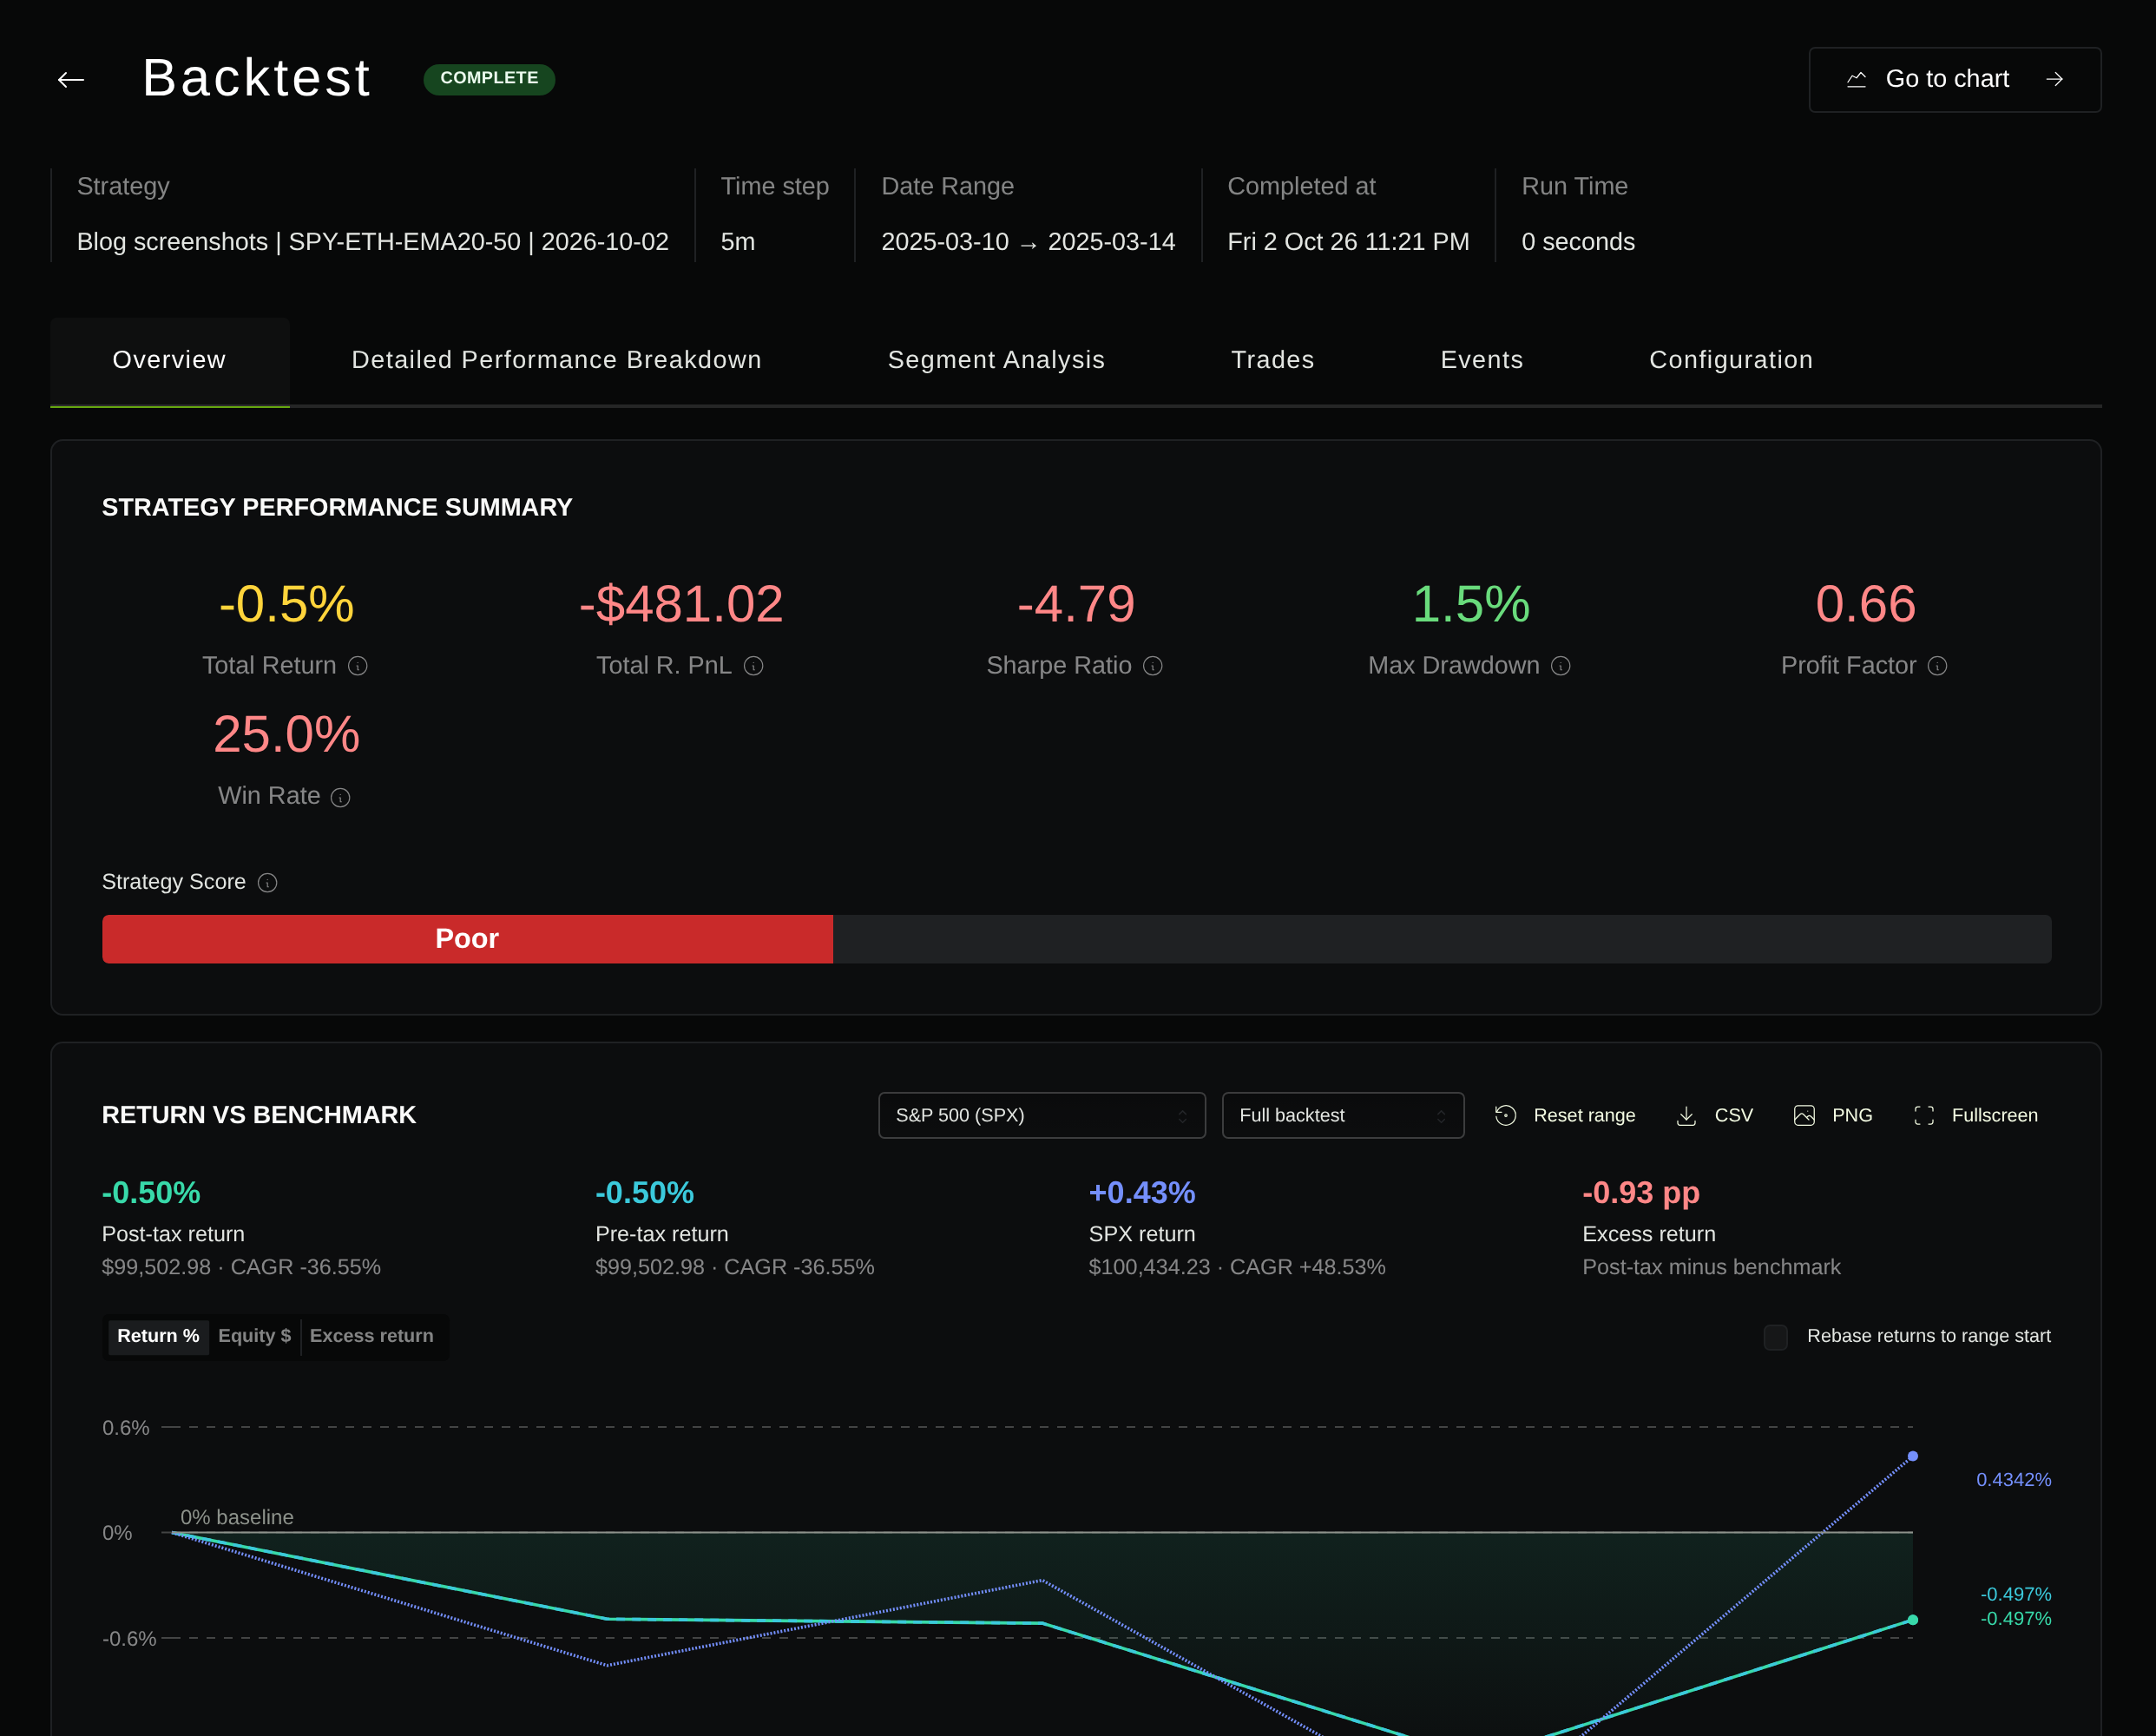


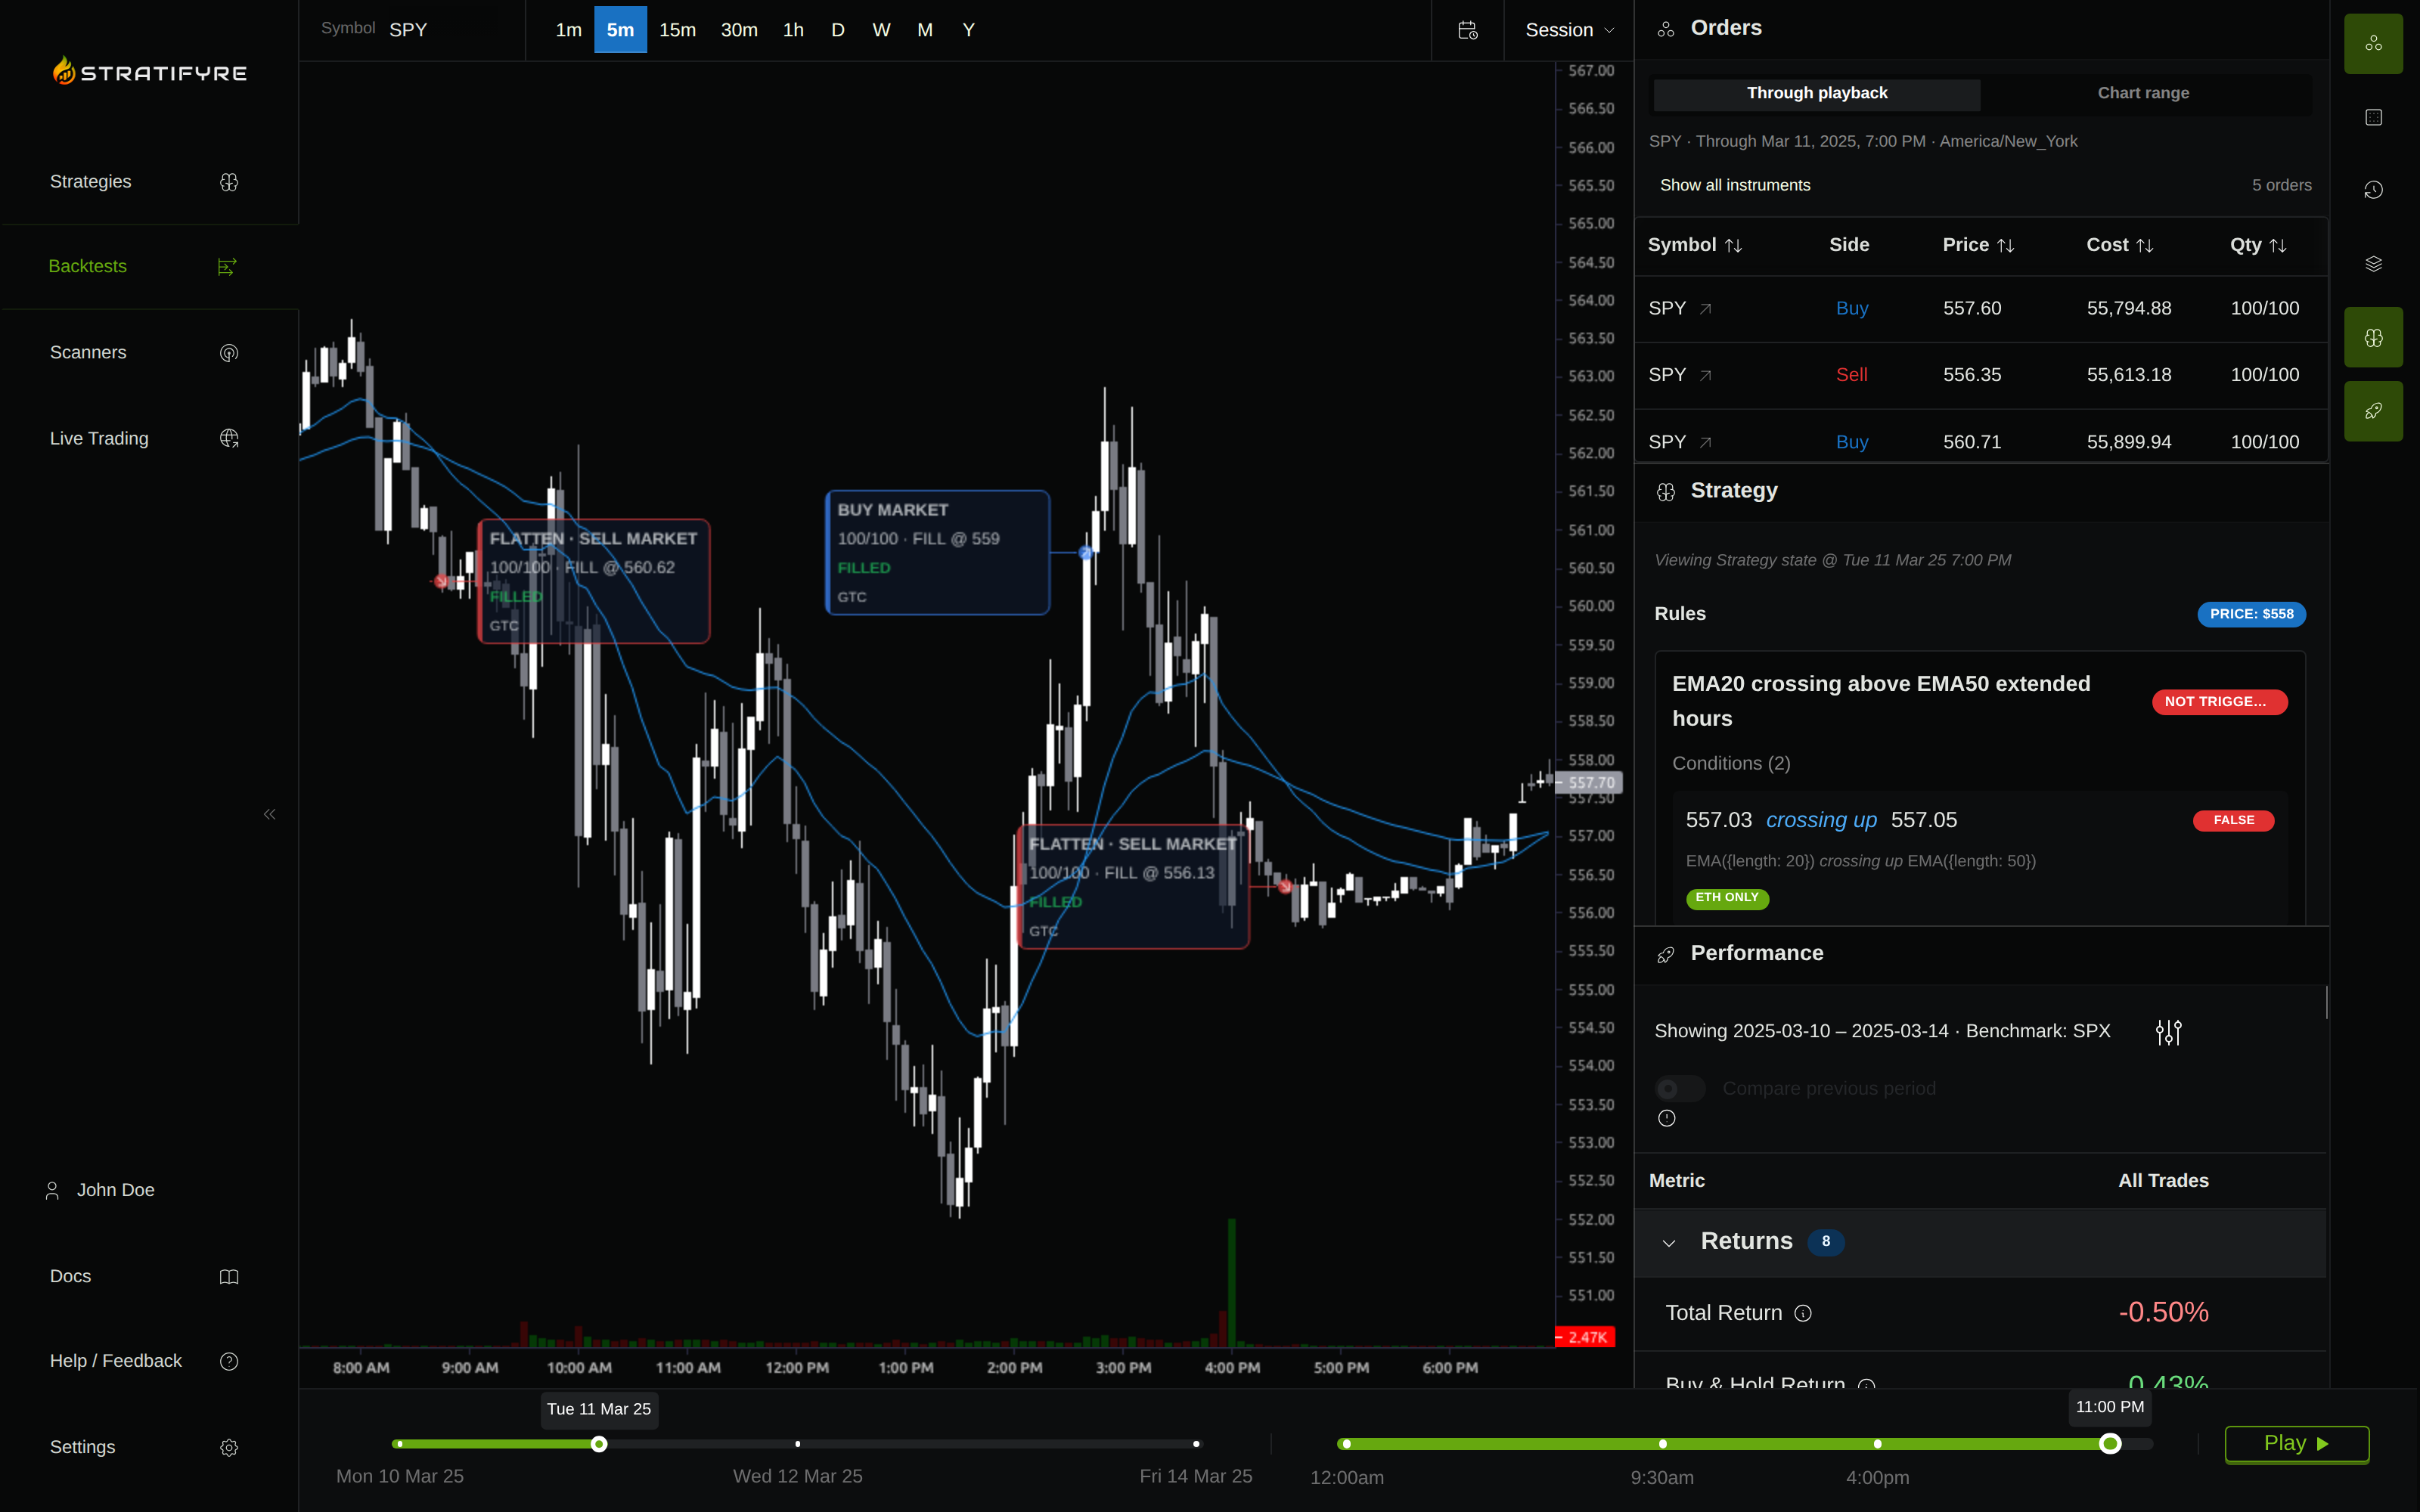
An entry rule can stop creating orders at the close while a previously submitted order remains active. Exits may also have a different schedule from entries. Record the session eligibility and expiration of entry, stop, limit, and exit orders separately.
For example, imagine a completed-bar signal just before 4:00 p.m. with execution deferred to a later data step. The next eligible fill could fall in the late session or at the following core open, depending on the order’s permissions and lifetime. It could also expire without filling. A bar timestamp alone does not resolve that behavior.
Specify whether timestamps mark bar starts or ends. A bar stamped 16:00 might represent the minute ending at the close or the minute starting afterward. The closing auction is a separate execution event; do not infer participation merely from a timestamp or a generic next-bar fill model.
Check boundary trades individually: the first core-session signal, the last permitted entry, an outstanding order at the close, and an exit after the entry window ends. “No new entries after 15:55” does not imply “no position after 16:00.”
Keep overnight exposure visible
Restricting entries to the core session does not eliminate overnight risk. A held position can change value before its next eligible exit, even if those prices are absent from the displayed chart.
Decide whether the strategy holds through the close or submits a scheduled flattening order. If it flattens, verify the actual fill and remaining quantity. An exit instruction does not prove the account was flat, particularly when fills are partial or a session ends early.
For strategies that hold overnight, inspect the next opening gap and how the simulator handles stops crossed while execution was unavailable. A stop level is a trigger condition, not evidence that the next available fill occurred at that exact price.
Treat extended-hours fills as a separate assumption
FINRA identifies lower liquidity, wider spreads, and partial or absent executions among extended-hours risks. Historical trades inside a candle do not prove that your intended quantity could execute at its closing price. FINRA Rule 2265 risk disclosure.
Keep commissions separate from spread and slippage. Record order size, available volume, order type, and the broker’s permitted sessions. If your simulation uses one fixed cost across every session, test more adverse execution assumptions and describe that limitation. A larger buffer is a sensitivity check, not a reconstruction of historical quotes or order-book depth.
When comparing results, inspect missed orders, partial fills, holding time, and drawdown alongside net return. Extra trading opportunities can also introduce extra costs and exposure; a larger trade count alone says little about whether the extended window helps.
Audit daylight saving, holidays, and early closes
Use a named timezone such as America/New_York for an Eastern session. A fixed UTC offset moves the effective trading window when daylight saving time changes. NIST lists the 2026 transition dates as March 8 and November 1. NIST daylight-saving rules.
Check these cases before extending the backtest:
- A date on each side of a daylight-saving change: the core open remains 09:30 Eastern while its UTC time changes.
- A full holiday: check both loaded data and trading eligibility; weekday logic alone is insufficient.
- An early close: confirm entries, order expiration, exits, and any flattening rule use that day’s boundary.
- A session crossing midnight: define the trading-date assignment and the overnight venue instead of extending a same-day window by assumption.
For example, Nasdaq’s 2026 calendar marks November 27 and December 24 as 1:00 p.m. closes. Special-day hours must be checked for the actual venue and session; they are not established by an ordinary-day template. Nasdaq trading calendar.
Save the four session choices beside the strategy, then reconcile one differing trade before rerunning a longer window. Use Stratifyre’s backtest configuration guide to document the remaining run settings and compare the saved configurations.
Put your strategy rules to the test
Build your strategy, inspect historical trades, and review the assumptions behind your results.
Build and test your strategy