VWAP reclaim backtest: define the trigger and audit the fills
Define a VWAP reclaim with explicit session, exit, and sizing rules, then inspect a real SPY backtest's losing trade and unresolved fill timing.
“Buy when price reclaims VWAP” leaves several decisions open: which price crosses, which bars enter the average, when the order fills, and what closes the position. A useful VWAP strategy backtest fixes those decisions before looking at returns.
This article follows two actual SPY demo-account runs over June 2–6, 2025. Both lost money. Their saved rules and returned trades make the entry difference inspectable, while a selected trade exposes a fill-timing issue that must be resolved before treating the results as evidence of a tradable edge.
Define the reclaim as an event
For this test, a reclaim means the previous one-minute close was at or below its contemporaneous VWAP, and the current close is above the current VWAP. Compare each close with the average available at that point; today’s later VWAP is not the threshold for an earlier candle.
That event differs from the state close above VWAP. The state can remain true for many candles. A crossing requires a transition, and a flat-position guard prevents adding another position while already holding shares.
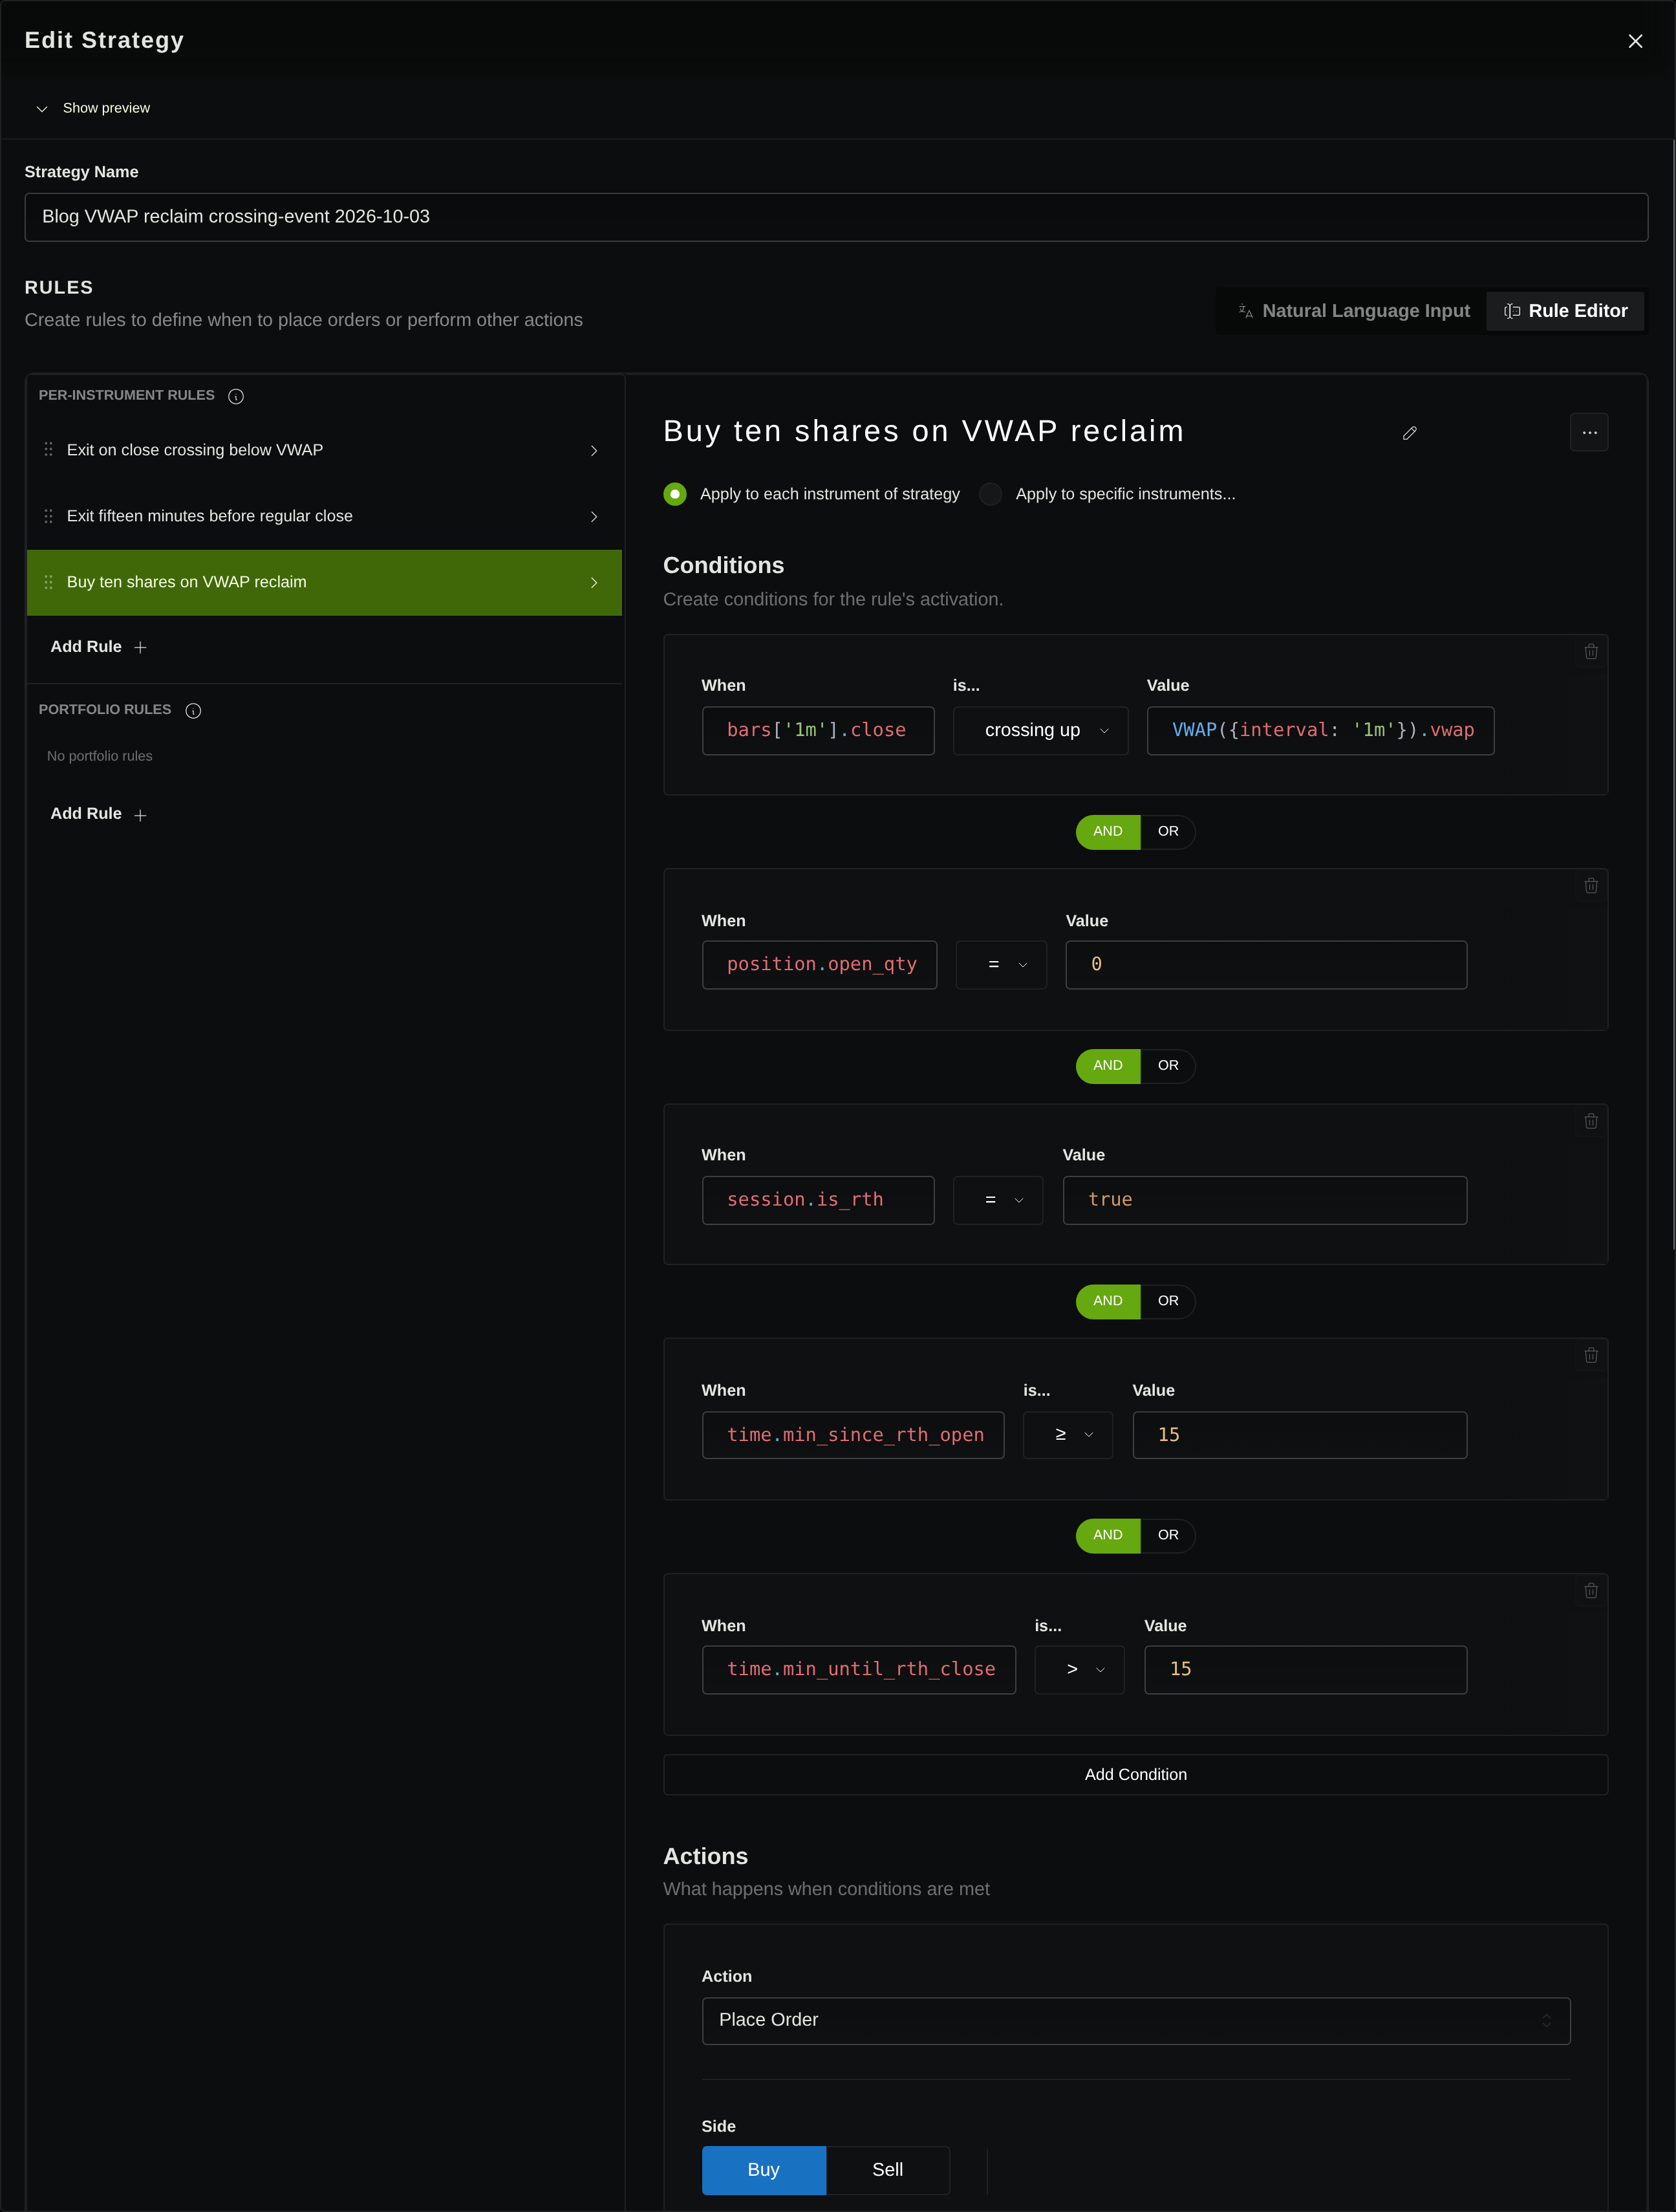
The saved entry uses:
bars['1m'].close crossing up VWAP({interval: '1m'}).vwapAND position.open_qty = 0AND session.is_rth = trueAND time.min_since_rth_open >= 15AND time.min_until_rth_close > 15→ Buy 10 shares, market orderThe control changes only crossing up to >. It asks whether entering whenever flat and above VWAP produces a different trade sequence. Neither version requires a pullback depth, a second confirmation candle, or above-average volume; adding any of those would define another experiment.
Check which session the VWAP actually measures
A bar-based VWAP weights each bar’s typical price, (high + low + close) / 3, by its volume, then divides accumulated price-times-volume by accumulated volume. Its reset point and included bars are part of the definition. TradingView’s VWAP reference documents this calculation and the role of the reset period.
For a regular-session SPY test, the usual core session is 9:30 a.m.–4:00 p.m. Eastern; exchange holidays and early closes need separate handling. NYSE’s hours and calendar distinguishes that session from extended trading.
The demonstrated calculation includes supplied premarket bars. Local runtime inspection found a reset when the Eastern calendar date changes, without another reset at 9:30. The sampled replay agrees with a day-reset calculation over extended bars, rather than an average starting at the regular open.
On June 3, author calculations from the returned minute bars produced:
| Completed bar, Eastern | Extended-bar day VWAP | VWAP starting at 9:30 |
|---|---|---|
| 4:00 a.m. | $589.85333 | No regular-session bars yet |
| 9:30 a.m. | $592.03282 | $592.88333 |
| 10:00 a.m. | $592.48466 | $592.74101 |
These are author calculations, not an additional native report. The native replay displayed approximately $589.85, $592.03, and $592.48 at the corresponding completed-bar views. In particular, the 9:30 value retains premarket history instead of restarting with that candle.
Restricting entries to regular hours does not remove premarket bars from the indicator. If your intended setup requires a 9:30-reset VWAP, verify that accumulation separately before copying these rules. This experiment establishes the sampled day-reset behavior; it does not demonstrate a custom anchored VWAP.
Save exits, size, and execution assumptions together
SPY is the State Street SPDR S&P 500 ETF Trust, listed on NYSE Arca; the experiment trades its shares, identified in the product as ETF:ARCA:SPY. State Street’s fund page identifies the fund and listing.
| Input | Saved demonstration |
|---|---|
| Dates and resolution | June 2–6, 2025; one-minute bars |
| Starting capital | $100,000 |
| Position size | Ten whole shares, long only |
| Entry window | From 9:45 a.m.; before the final fifteen minutes of regular trading |
| Price exit | While long, close crossing below the same VWAP; Flatten |
| Time exit | While long, fifteen minutes or less until regular close; Flatten |
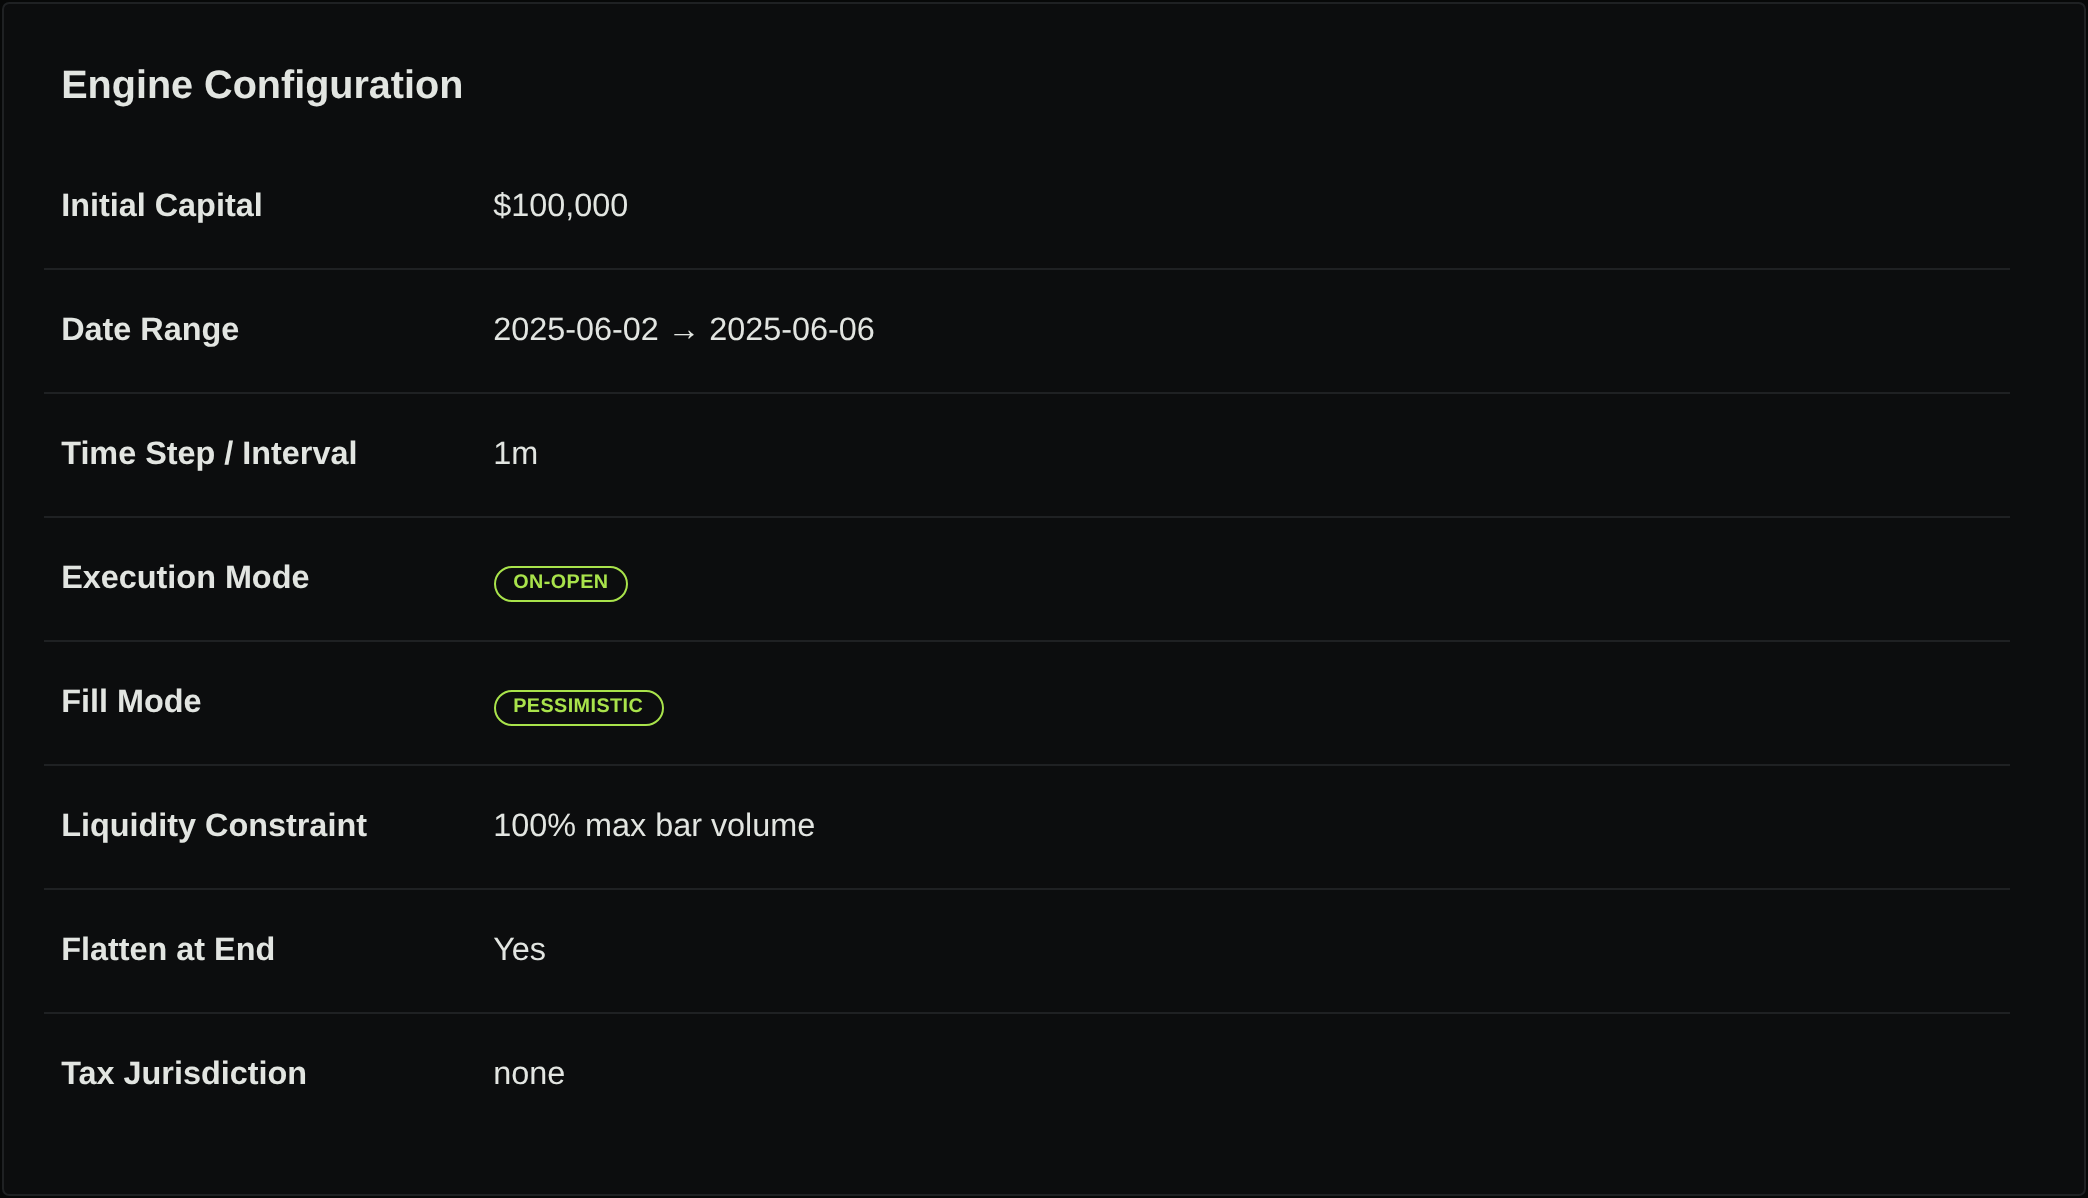
| Execution settings | On-Open; pessimistic fill mode |
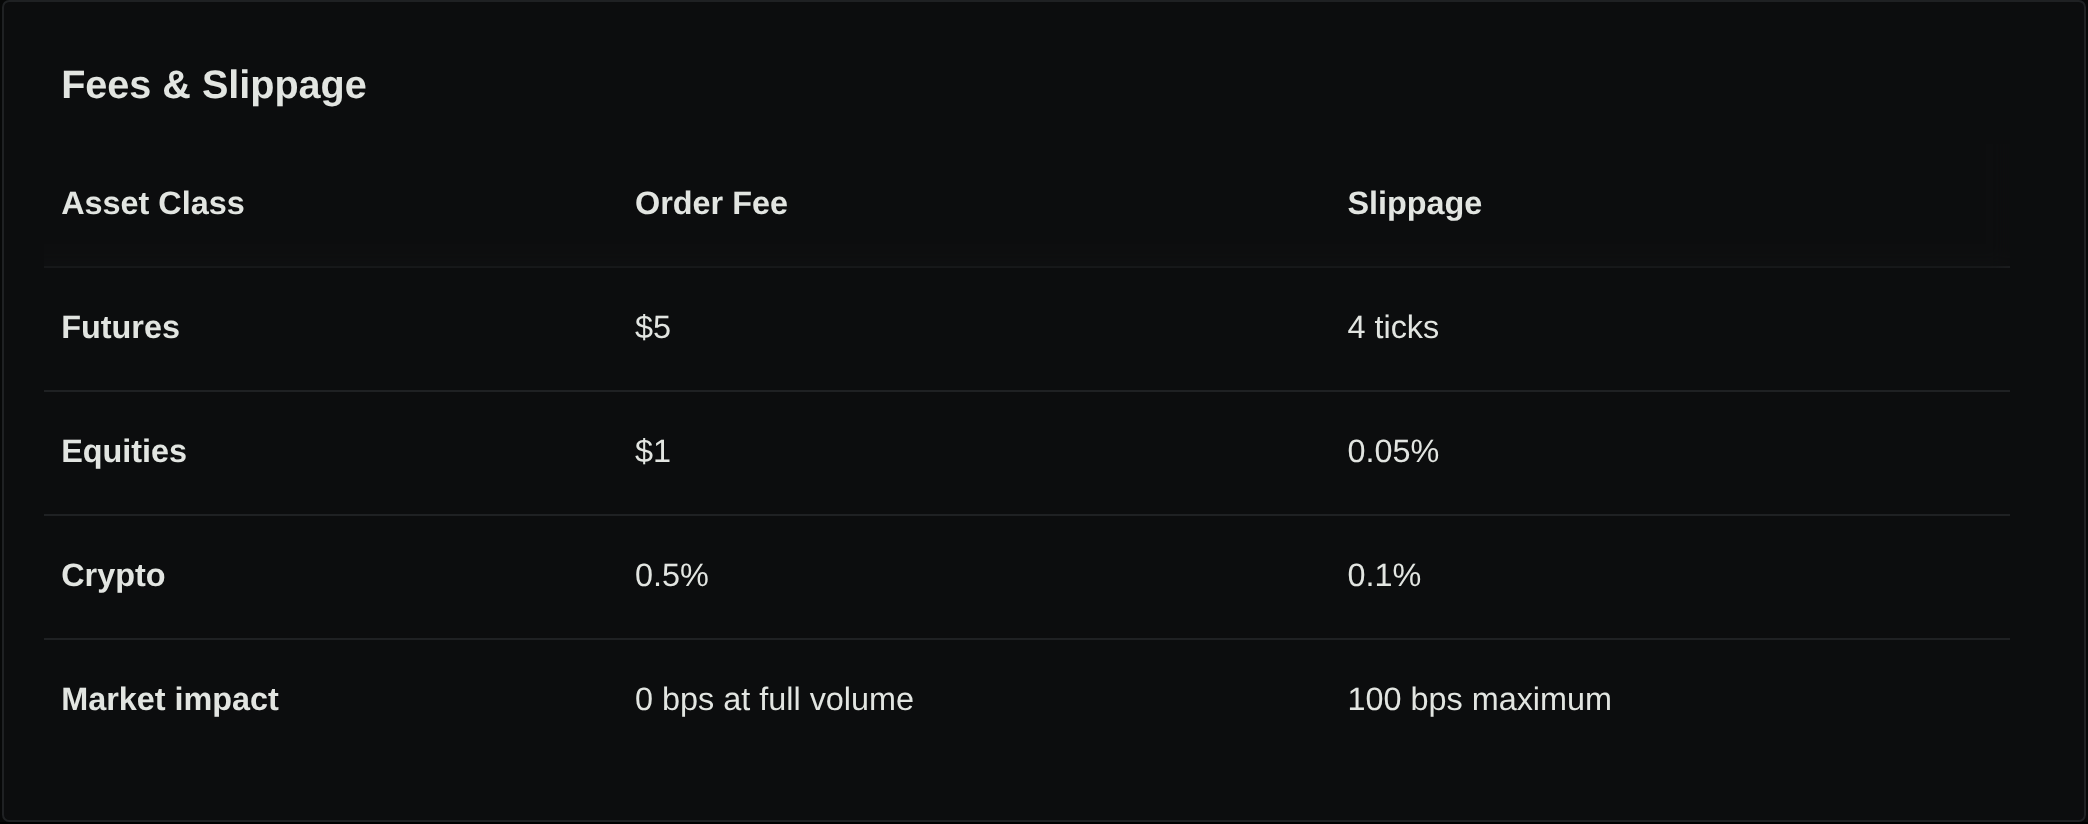
| Cost inputs | $1 per equity order; 0.05% adverse slippage |
| Other settings | No market impact or tax; volume cap enabled; flatten at simulation end |
The two runs have identical settings apart from the entry operator. There is no protective stop or profit target: a position stays open until a crossing exit or the time exit. That is an explicit experimental choice, not a live risk recommendation. Ten shares is position size, not a claim that a fixed percentage of the account is at risk.
Direct coverage checks returned 4,663 extended minute bars, including all 390 regular-session minute bars on each of the five sampled days. The coverage check did not assume every extended-session minute was present. VWAP needs one supplied bar to initialize, then accumulates the day’s subsequent bars.
Read the account result alongside the trade total
Both jobs completed, returning ten-share trades on all five sampled days:
| Returned outcome | Reclaim event | Above-VWAP state |
|---|---|---|
| Closed trades | 36 | 40 |
| Trade-price P&L, including modeled slippage | −$52.12 | −$97.31 |
| Entry and exit commissions | $72.00 | $80.00 |
| Account net P&L | −$124.12 | −$177.31 |
| Ending equity | $99,875.88 | $99,822.69 |
The reclaim run’s exact reconciliation is −52.12305 − 72 = −124.12305. The state control is −97.31345 − 80 = −177.31345. Each closed trade has two $1 orders; summing the returned trade fee field alone gives only $36 or $40, respectively, and misses half those commissions.
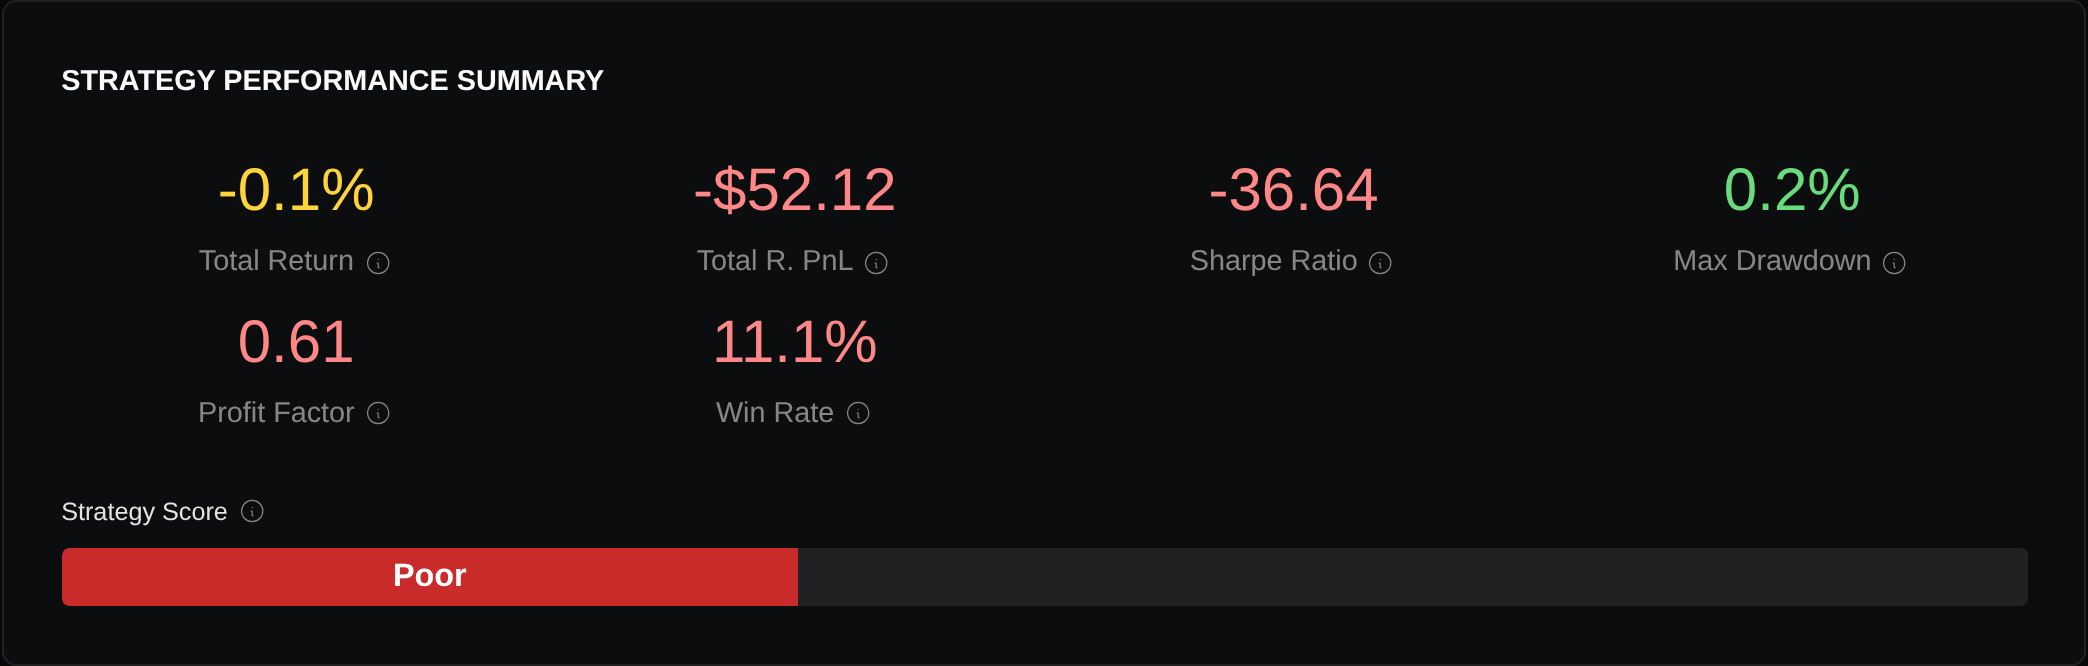
Fewer trades did not turn this sample into a profitable strategy. The five-day result is too narrow to establish robustness, and the timing discrepancy below limits any performance interpretation. The performance response also labels its end boundary as June 6 at 00:00 UTC, although returned trades continue through that day’s regular session; use the actual trade timestamps when auditing the period.
Audit a losing reclaim before trusting its fills
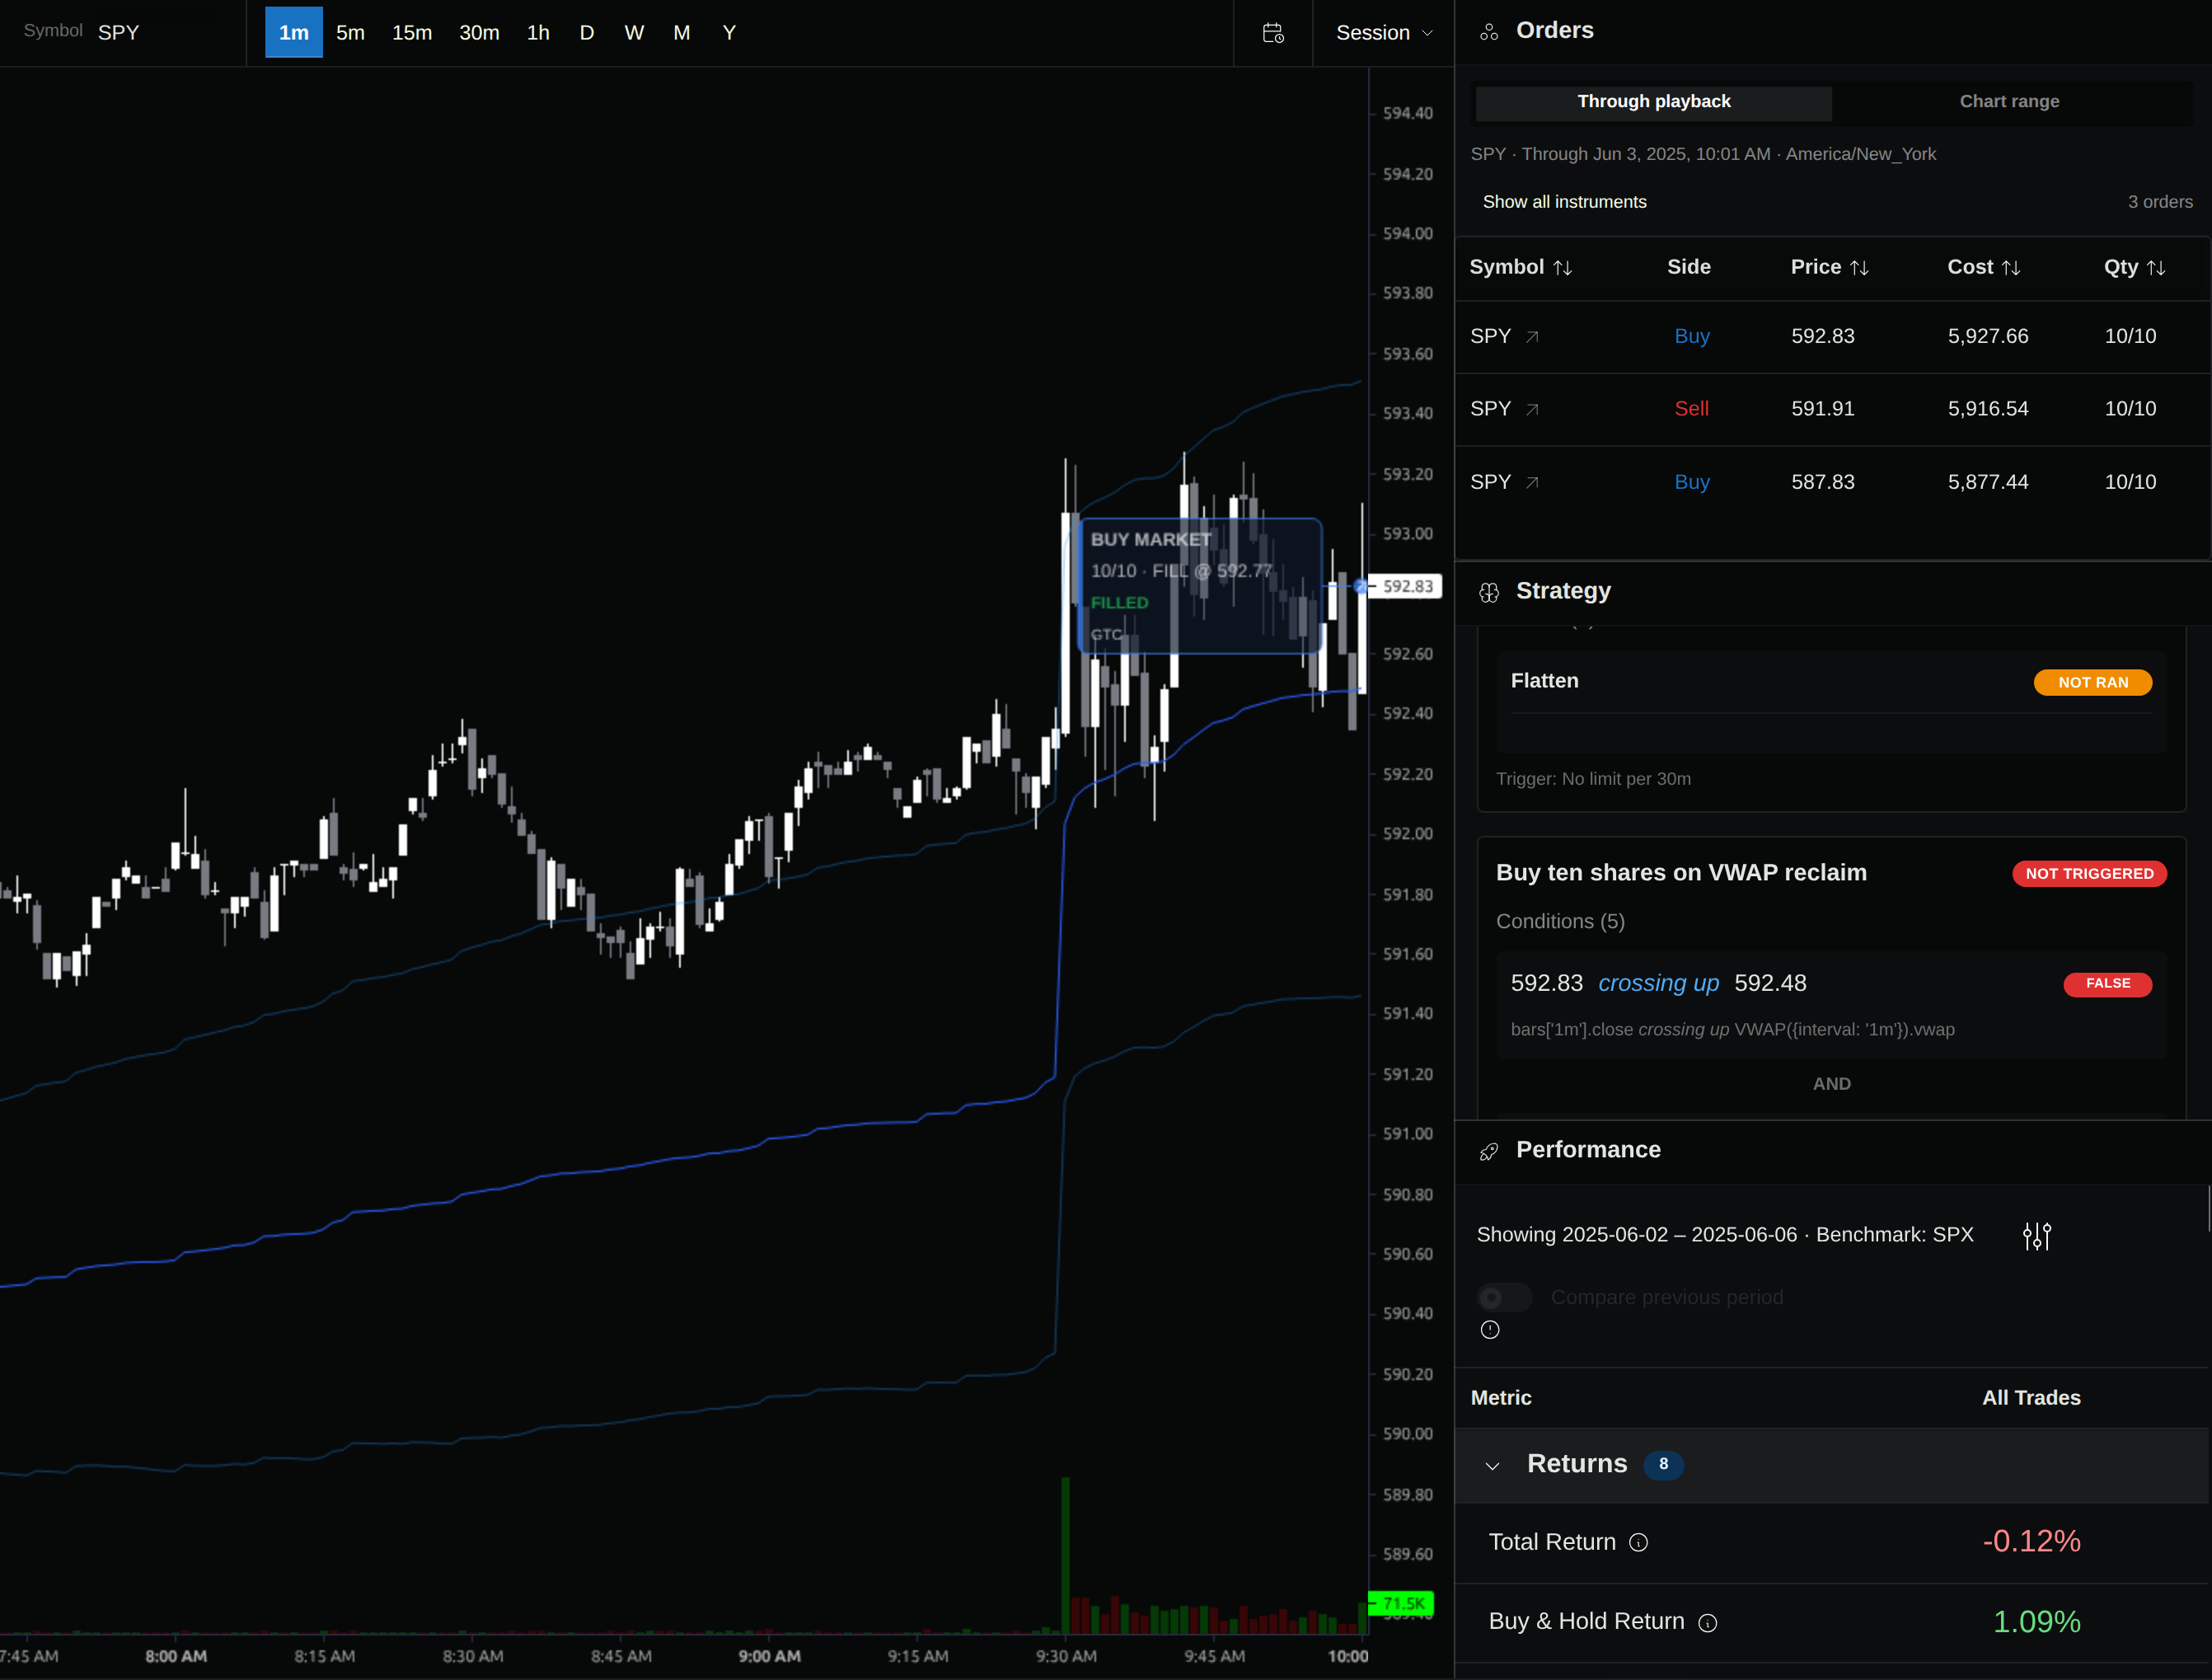
The first losing reclaim trade entered June 3 at a recorded 10:00 a.m. Eastern and exited at 10:07. Its ten shares entered at $592.766235 and exited at $592.713495: about $0.53 lost on prices, or $2.53 after two $1 commissions.
The returned bars support the intended crossing arithmetic: the 9:59 close of $592.35 is below its day VWAP of $592.47435; the 10:00 close of $592.83 is above $592.48466. The price moved back below the average within minutes. A reclaim is not confirmation that the subsequent move will persist.

However, the native events record submission and fill at 10:00, with an order placed price of $592.83, that minute’s close. The entry fill equals that same minute’s open, $592.47 × 1.0005 = $592.766235; the exit likewise equals its recorded minute’s open after adverse slippage.
A close-based signal becomes knowable after its candle completes. These records therefore do not verify the requested sequence of completed close followed by the next bar’s open. The discrepancy needs resolution before using this run to estimate executable returns.
Make the next test answer one unresolved question
Keep this rule set and its losing outcomes. Before extending the window or adding filters, establish which completed candle produced the decision and which later candle supplied the fill. Confirm the VWAP reset and included session bars at the same time; otherwise a parameter comparison can mix different signal definitions.
For adjacent checks, the SPY RSI pullback walkthrough separates a condition from a recovery trigger, and the backtest slippage stress test explains why a small price advantage can disappear under costs.
Create an explicit strategy rule set, then inspect one entry’s previous/current VWAP values, submission time, fill candle, and two-sided costs. The useful first result is a sequence you can account for, including the assumption that still needs fixing.
Put your strategy rules to the test
Build your strategy, inspect historical trades, and review the assumptions behind your results.
Build and test your strategy