Adjusted vs. unadjusted stock backtests: splits, dividends, and double counting
Diagnose artificial stock-price gaps, keep signals and fills on consistent scales, and count dividend cash once.
A stock split can look like a crash in a raw price series. A dividend can look like a trading loss even when the holder receives an offsetting cash entitlement. Adjusting the chart helps explain those changes, but it does not automatically fix a backtest’s positions, orders, or cash ledger.
The useful question is: Which prices drive the signals, which prices drive the fills, and where does the corporate action enter the accounting? Those three parts must agree.
The opening numbers below are synthetic teaching examples, with no fees, taxes, slippage, or market movement beyond the stated action. A separately labeled actual Apple audit follows; its recorded result exposes an unresolved adjustment problem.
A four-for-one split is not a 75% loss
Suppose you own 10 shares at $400 immediately before a four-for-one split. In the simplified example, each share becomes four shares, and the corresponding price becomes $100.
| Item | Before split | After split |
|---|---|---|
| Share quantity | 10 | 40 |
| Price per share | $400 | $100 |
| Position value | $4,000 | $4,000 |
| Equivalent stop price | $380 | $95 |
The position value stays constant: 10 × $400 = 40 × $100. Comparing the two raw prices alone produces (100 / 400) − 1 = −75%. That measures the change in the share unit, not this holder’s economic loss.
Real prices can move around a split. The table isolates the mechanical change so you can spot an accounting error before interpreting market performance.
Position quantity is only one check. A pending sell order for all 10 old shares must be reviewed against the 40-share holding after the event. A $380 stop must also be interpreted on the new scale. Leaving that stop unchanged could make a $100 price appear to have crossed it despite the unchanged value in this example.
Adjust the signal history consistently
Imagine a rule that exits when the closing price is below its five-bar simple moving average. Its last five closes are:
- Raw closes: $400, $400, $400, $400, $100.
- Split-normalized closes: $100, $100, $100, $100, $100.
The raw average is $340, so the final $100 close triggers the rule. The normalized average is $100, so a strict “below” condition does not trigger. Nothing about the company’s value changed in this example; the inconsistent units manufactured a signal.
The same audit applies to breakouts, ATR, and rules that compare today’s price with an earlier price. Check every input used by the rule. An adjusted close combined with raw highs and lows can still create a mismatched calculation.
Adjustment labels also have specific meanings. For example, Alpaca’s historical stock-bar API distinguishes raw bars, split adjustment of prices and volume, and dividend adjustment of prices; its current all option also includes spin-offs. That is a provider’s data contract, not evidence that a backtesting application exposes the same settings. Alpaca historical bars reference.
Keep signals and execution on compatible scales
An adjusted series can make historical comparisons meaningful. A raw execution series records prices in the share units traded at the time. A simulation can use these separately, but it needs an explicit mapping between them.
For the split above, a historical $400 quote becomes $100 when expressed in post-split units. That does not mean a trader before the split could buy 10 original shares for $1,000. Using the normalized price with the original share quantity understates the position cost by a factor of four.
Two accounting designs can be coherent:
- Raw execution with explicit events: use contemporaneous fill prices and quantities; apply splits to holdings and pending orders at the event boundary.
- Consistently normalized simulation: express prices, quantities, order levels, and capital calculations in the same normalized units throughout.
Mixing the designs is the problem. An adjusted chart, an unadjusted position quantity, and a second split applied to that position can each be reasonable in isolation while producing an unreasonable portfolio together.
Absolute rules deserve extra care. “Buy below $50” describes a price in a particular share unit. Restating old prices changes the meaning of that threshold unless the rule is restated too. A smoother chart alone does not establish that the strategy represents the intended historical decision.
A dividend belongs in the return calculation once
Now consider a separate synthetic example: 10 shares worth $100 each, followed by a $1 cash dividend per share. Assume the ex-dividend price becomes exactly $99 and nothing else changes.
| Component | Before | After |
|---|---|---|
| Share value | $1,000 | $990 |
| Dividend due | $0 | $10 |
| Gross value | $1,000 | $1,000 |
The raw price return is −1%. The gross economic return, including the dividend entitlement, is zero: (99 + 1) / 100 − 1 = 0%. Actual prices need not fall by exactly the dividend amount.
Entitlement and payment are different dates. For ordinary cash dividends, buying on or after the ex-dividend date generally does not earn that distribution; special distributions can follow different rules. Verify the actual event dates rather than inferring them from a chart. Investor.gov explanation of ex-dividend dates.
A receivable is also different from spendable cash. If the simulation credits cash before the actual payment date, later buying power may differ from an account that waits for payment. Record the simulator’s timing convention.
For this illustration only, restating the previous $100 price to $99 removes the assumed dividend gap. The adjusted price ratio is then 99 / 99 − 1 = 0%. Adding another 1% dividend yield to that already adjusted return invents a positive result.
This is the double-counting trap. An adjusted series used only for signals can coexist with explicit dividend cash accounting on raw positions. The error arises when the same distribution is embedded in the portfolio return and added again as cash or yield. Check the provider’s adjustment formula and the simulator’s ledger; “adjusted” alone does not specify either.
Audit one known event before trusting a long backtest
Apple’s issuer announcement provides a concrete split boundary: four-for-one, with split-adjusted trading beginning August 31, 2020. The shareholder record date was August 24. That confirms the event and dates; it does not establish how any particular dataset or backtest processed them. Apple’s July 30, 2020 announcement.
Use a short window around that boundary to check your own data and run:
- Identify the instrument and event. Record the split ratio, effective trading date, data source, session, and timezone. Keep the record date separate.
- Inspect the bars. Compare the last pre-event and first post-event bars. Identify the adjustment basis for open, high, low, close, and volume, including the indicator warmup history.
- Inspect an open holding. Reconcile quantities and entry prices across the boundary. Separate the mechanical split effect from actual price movement.
- Inspect pending orders and signals. Check order quantity, stop/limit levels, and the rule inputs. Correct position accounting alone does not prove the indicator history uses compatible units.
- Reconcile the ledger. For a dividend test, verify eligible shares, per-share amount, event timing, cash or receivable treatment, and whether reported returns already incorporate the distribution.
A run with no position or order across the event cannot prove those adjustments worked. Likewise, an event listed in a data catalog does not prove that every economic consequence was simulated.
What the actual Apple audit returned
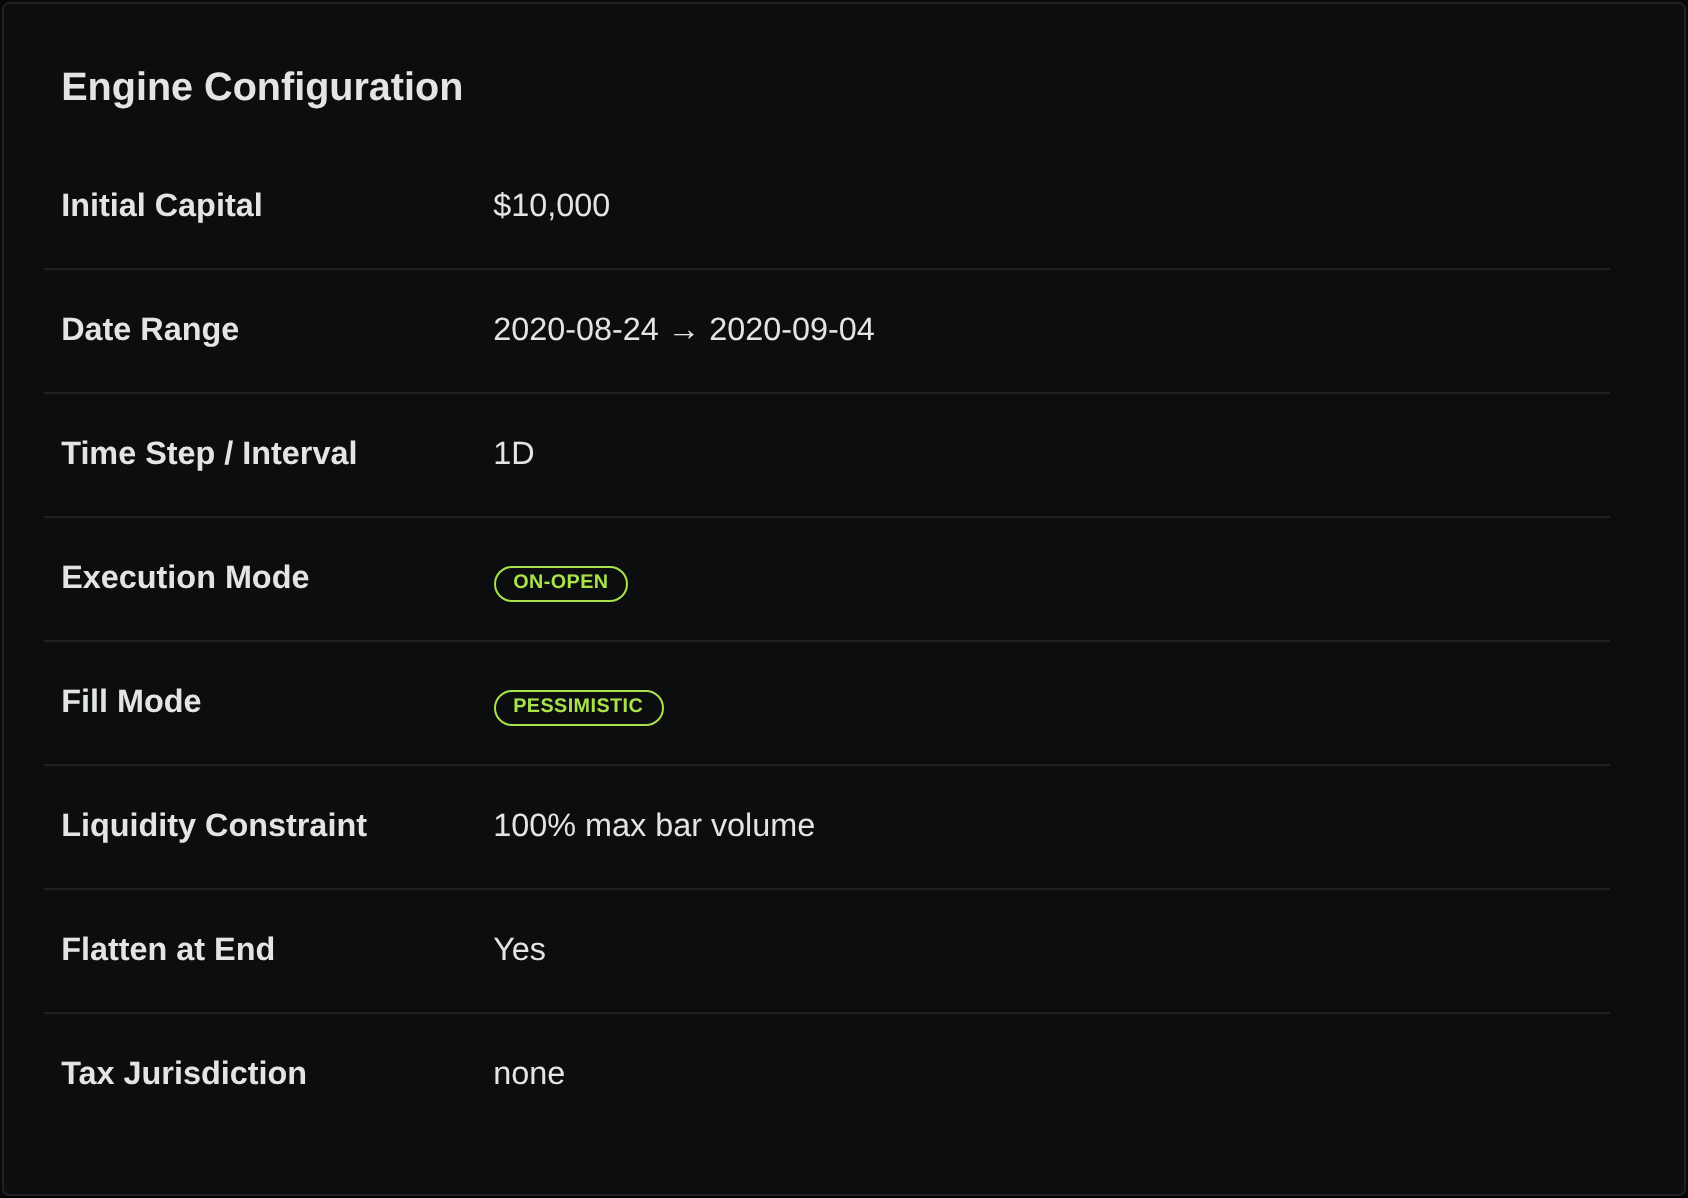
We saved a demo strategy that buys ten AAPL shares while flat and holds them until the end of an August 24–September 4, 2020 run. It used the exact EQ:NASDAQ:AAPL instrument, daily bars, $10,000 capital, on-open execution, and zero configured equity fees and slippage. This holding crosses Apple’s August 31 split boundary.
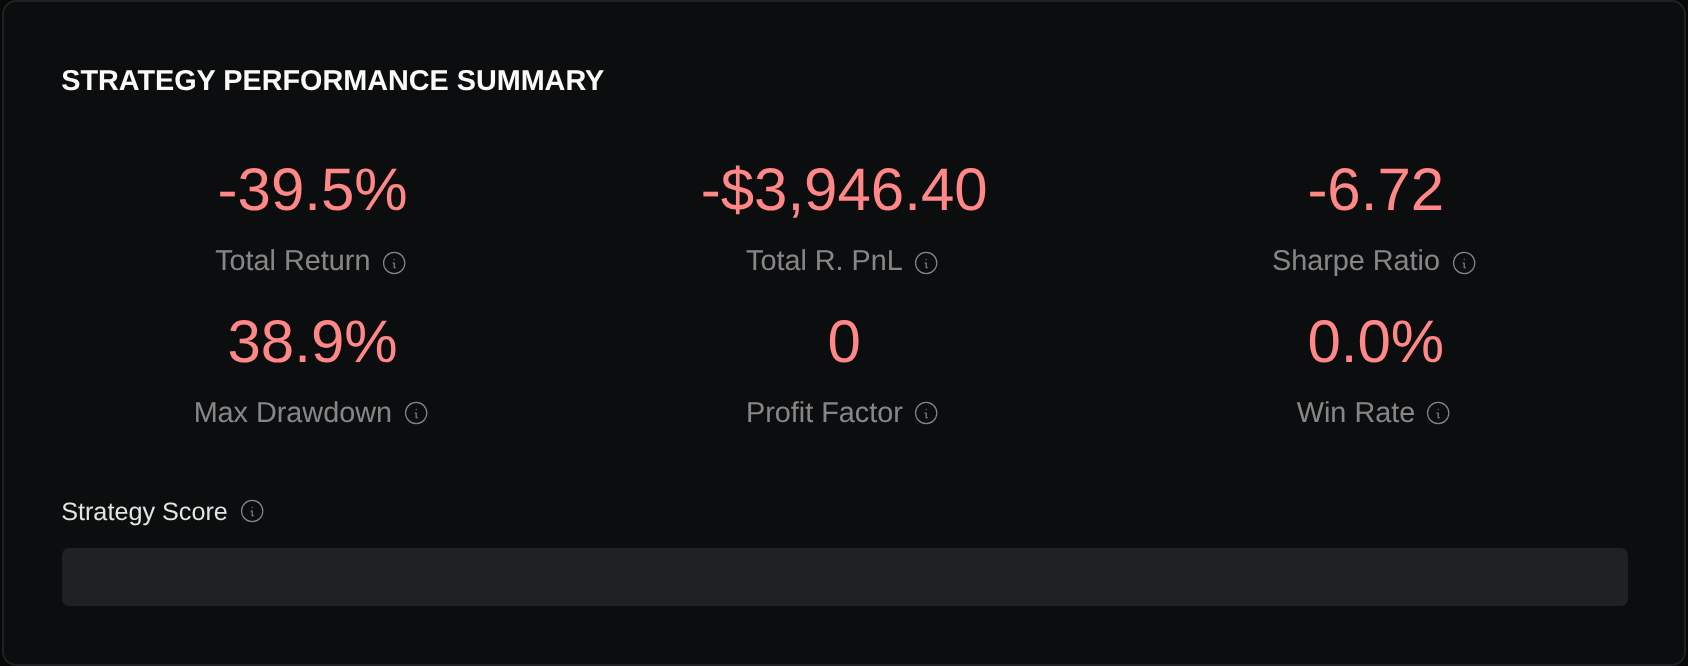
The completed report returned one trade: ten shares entered at $514.78 and exited at $120.14, reporting −$3,946.40. The job’s corporate-action response was empty, and its trade quantity remained ten. That is consistent with an uncorrected share-unit change; it is not a validated economic loss for a holding carried through a four-for-one split. We cannot certify split or dividend accounting from this result.

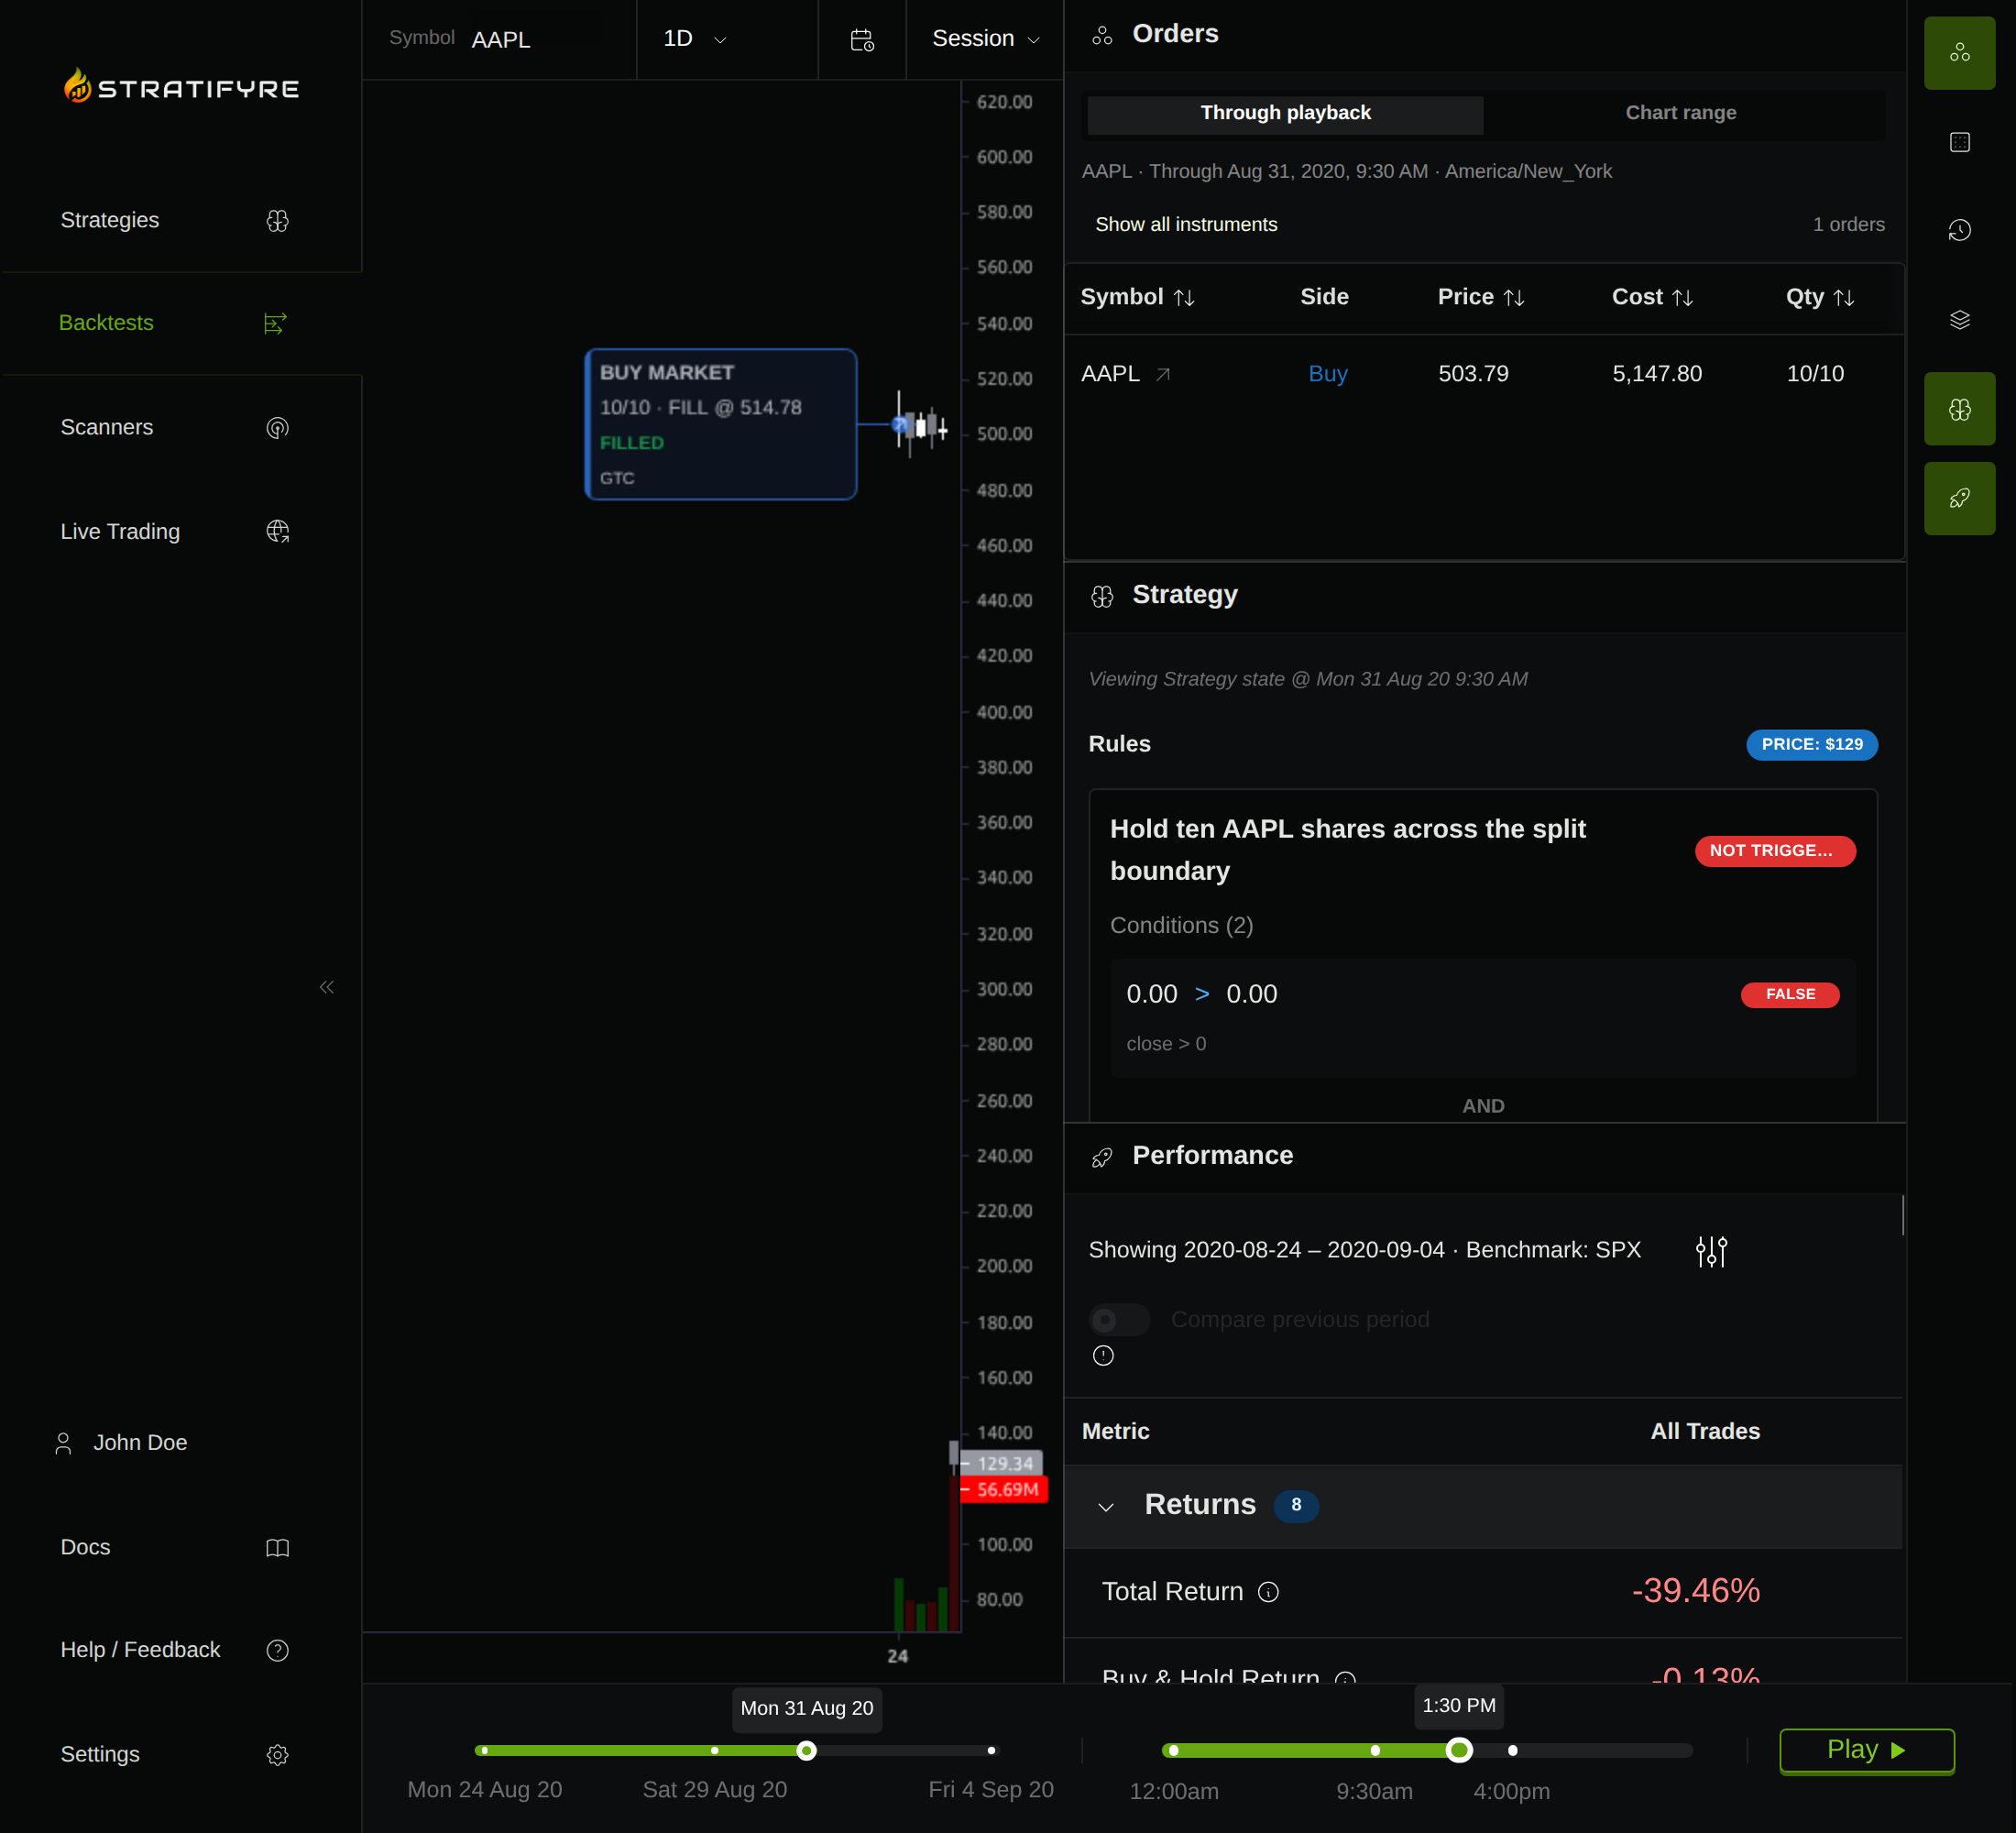
Stratifyre’s corporate-action documentation separates catalog announcements from simulated actions and describes split handling for open positions and pending orders. Apply that distinction to dividends too: require an event and matching cash movement before treating a result as dividend-inclusive. Do not assume an “adjusted/unadjusted” switch or complete coverage of every corporate action. Start with one event and reconcile its prices, quantities, and cash against the corporate-action documentation.
Put your strategy rules to the test
Build your strategy, inspect historical trades, and review the assumptions behind your results.
Build and test your strategy