Backtest an Order-Block Retest With Rules You Can Inspect
Define an order block’s formation, bounds, and invalidation, then inspect a real hourly Bitcoin retest, its confirmation timing, and a failed trade.
An order-block backtest starts with a definition that another trader could reproduce. Which candle creates the area? Do its wicks or body set the boundaries? When does the area become available, and what makes it fail?
This example saves one bullish definition, runs it on hourly Binance BTC/USDT data, and follows both a winning retest and a losing trade. The purpose is to inspect the rules. A price pattern does not reveal institutional orders, and this short, zero-cost simulation does not establish a trading edge.
Define the area before defining the entry
For this test, a bullish order block means a bearish origin candle followed by a bullish confirmation candle whose close clears the origin’s high. The saved definition requires all three conditions:
bar.close[1] < bar.open[1]bar.close > bar.openbar.close > bar.high[1] + (bar.high[1] - bar.low[1]) * 0.015Here [1] means the preceding candle. The extra clearance is 1.5% of the origin candle’s high-to-low range, not 1.5% of Bitcoin’s price. The zone uses that candle’s entire range:
| Decision | Saved choice |
|---|---|
| Upper boundary | Origin candle high: bar.high[1] |
| Lower boundary | Origin candle low: bar.low[1] |
| Invalidation | A later close strictly below the lower boundary: price < zone.lower |
| Detection interval | Explicitly 1h |
| History and retention | 168-bar lookback; maximum 20 retained active zones |
A wick below the lower boundary does not satisfy this close-based invalidation. An attached trading stop can still trigger on that wick. The area’s lifecycle and the position’s exit are separate decisions.
To reproduce the definition, start from Bullish Order Block Zones in the strategy editor’s Add Zone Definition menu, then set the hourly interval, lookback, and ID shown below. Check the expressions after saving; the preset’s daily default would describe a different test.
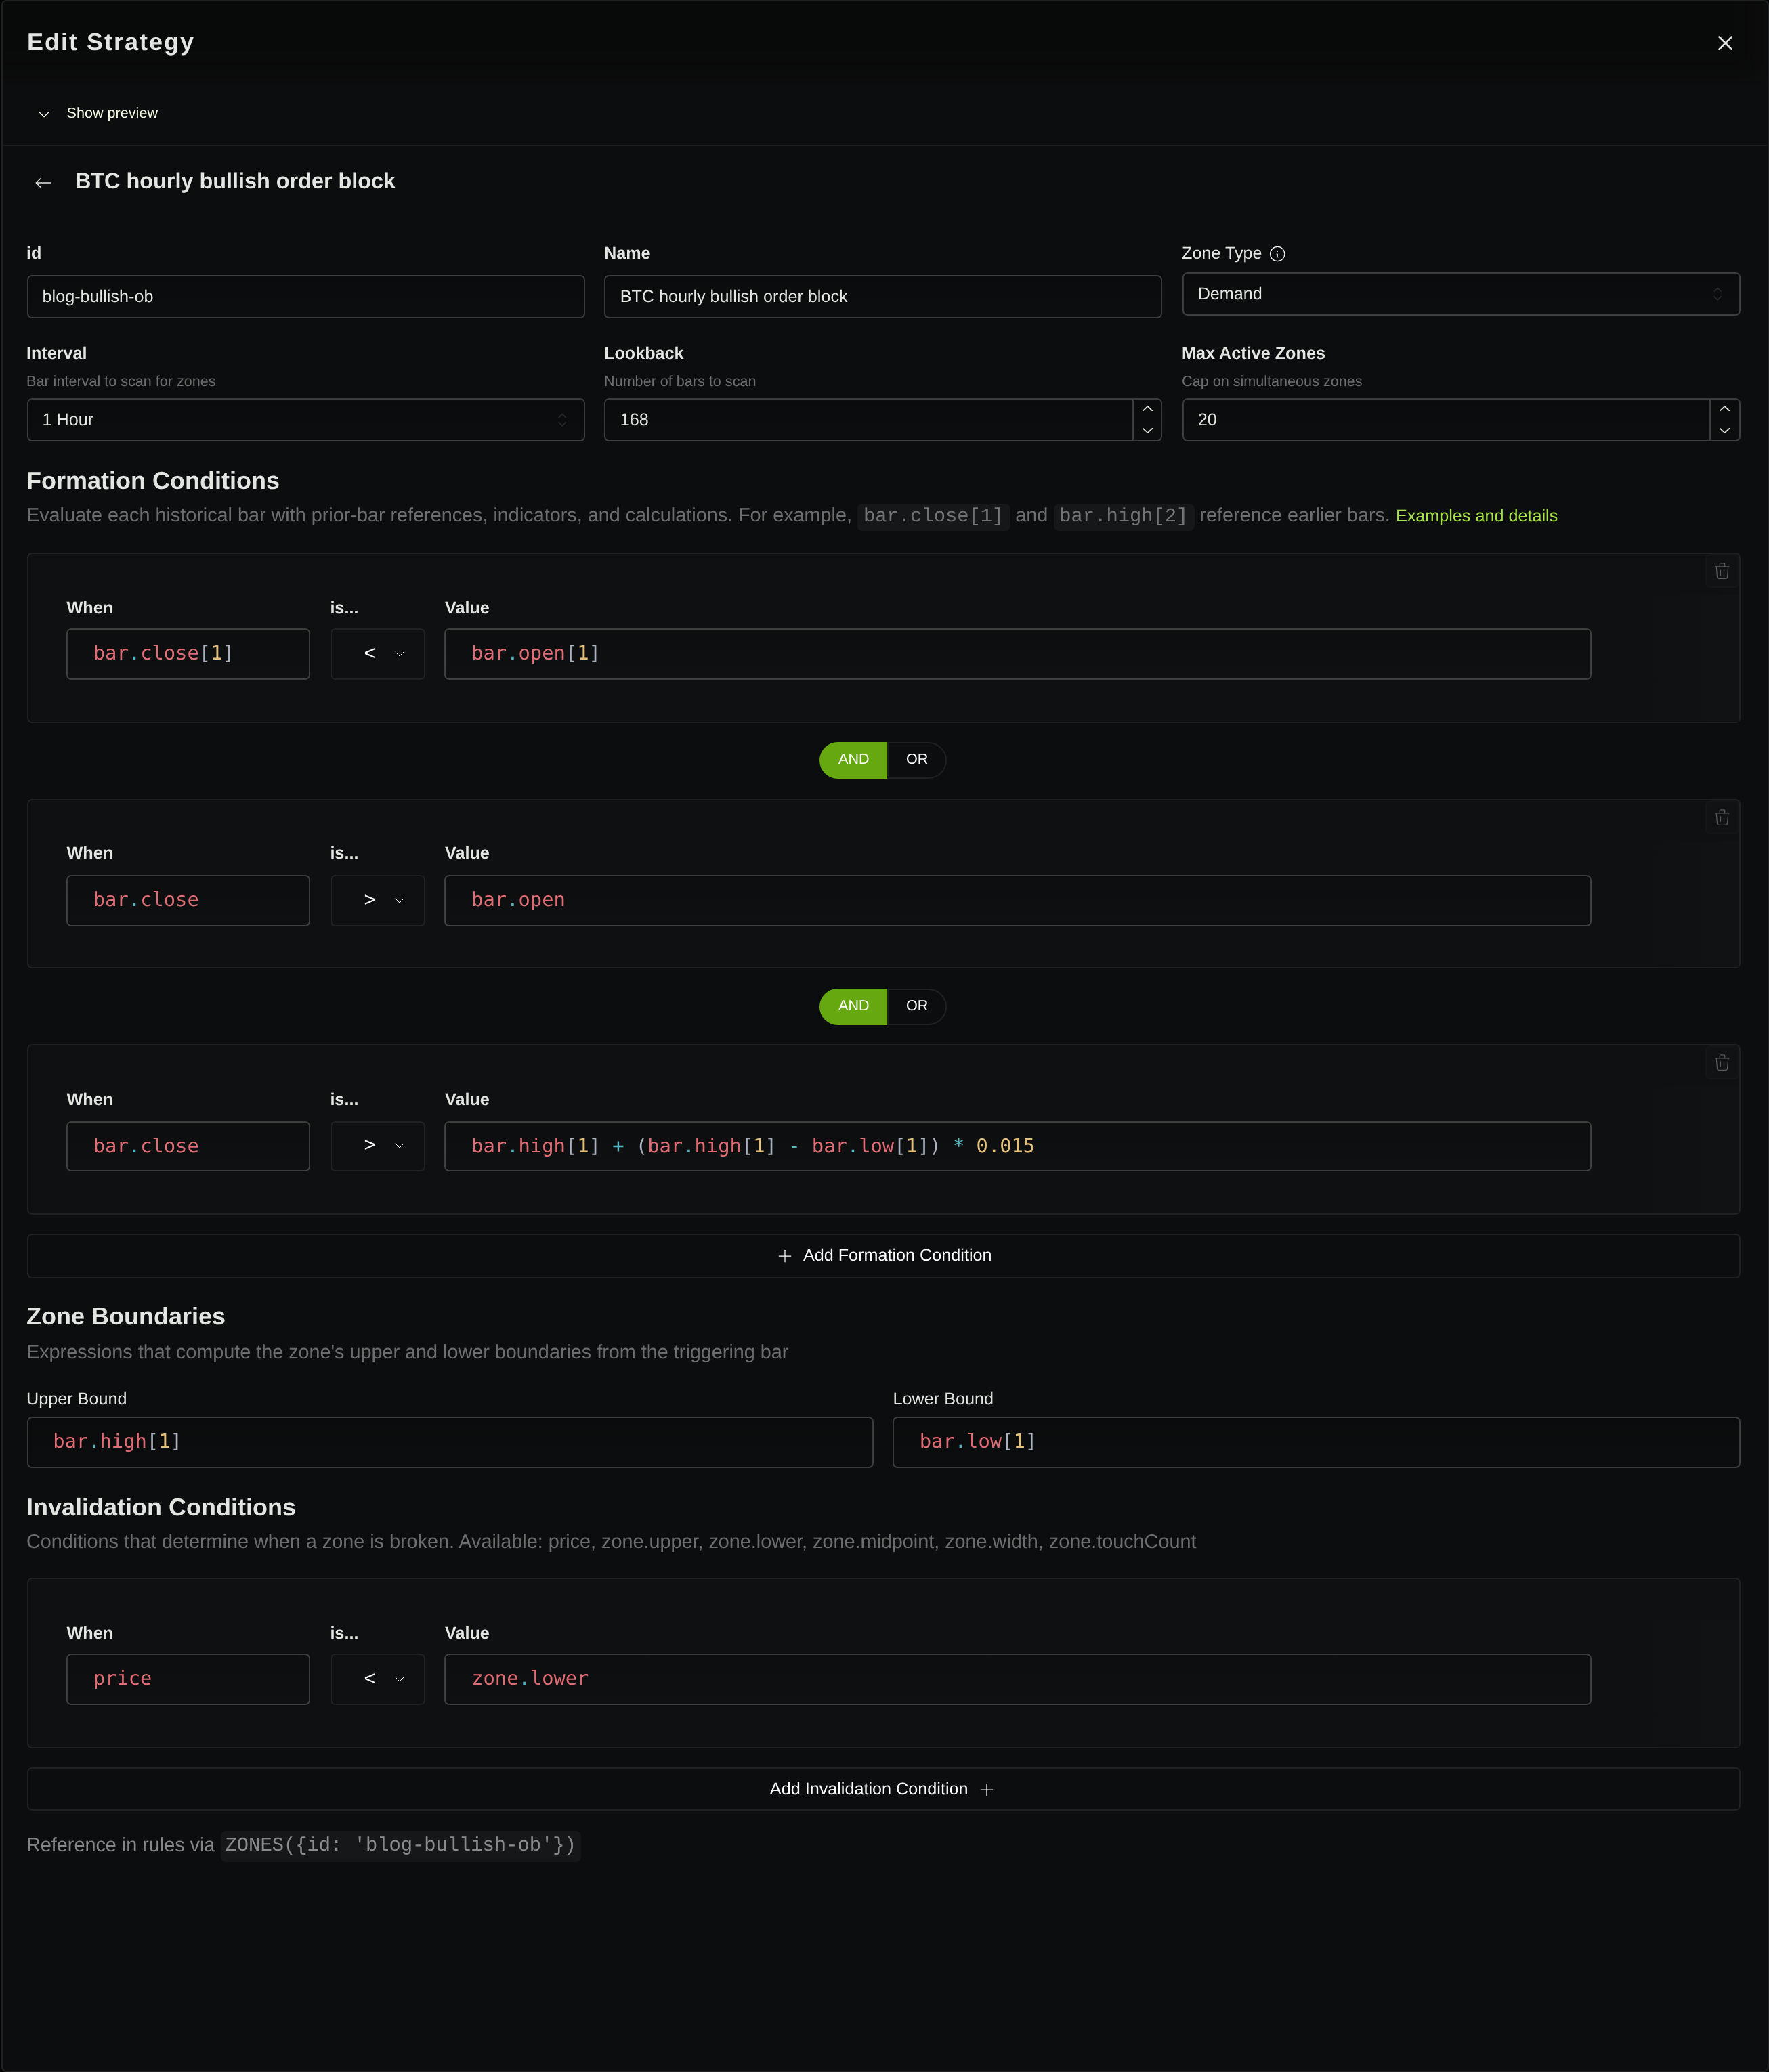
Stratifyre’s zone-definition documentation describes these separate formation, boundary, and invalidation controls. A “Demand” label classifies the area; it does not supply those conditions.
Turn the retest into an entry
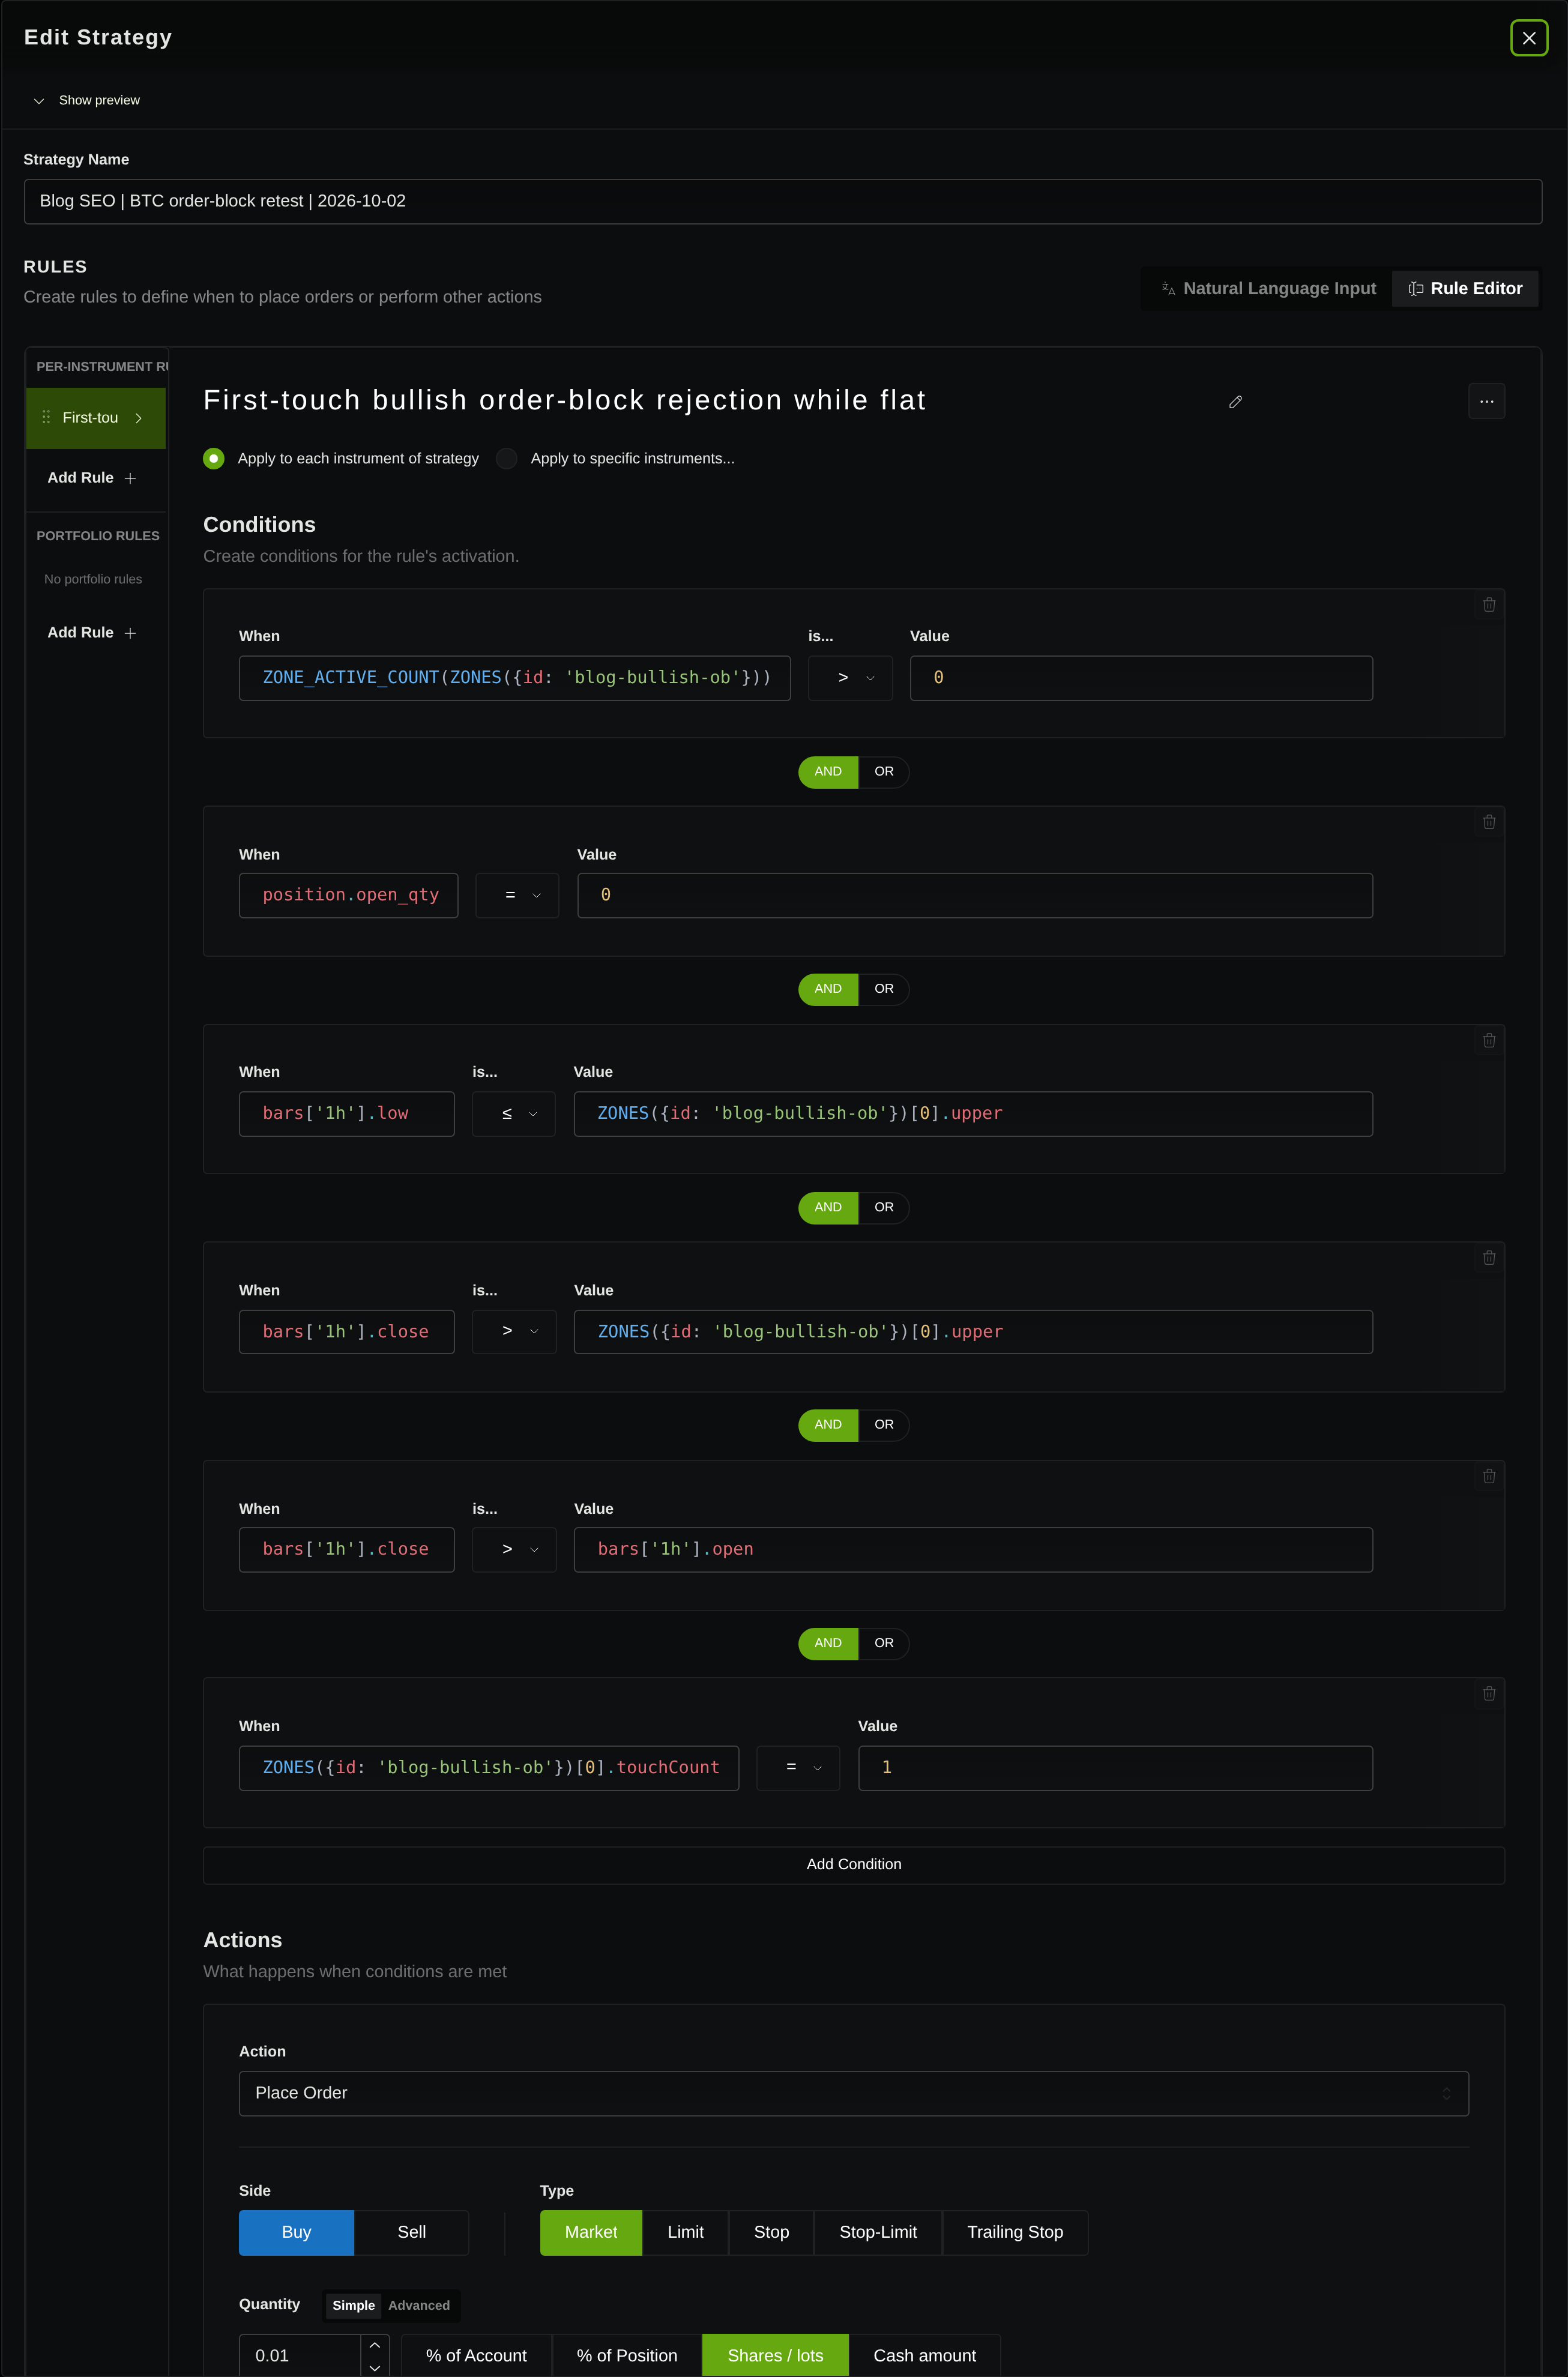
The entry references the definition’s ID, blog-bullish-ob. It requires an available zone and a flat position before testing the newest retained area:
ZONE_ACTIVE_COUNT(ZONES({id: 'blog-bullish-ob'})) > 0position.open_qty = 0bars['1h'].low <= ZONES({id: 'blog-bullish-ob'})[0].upperbars['1h'].close > ZONES({id: 'blog-bullish-ob'})[0].upperbars['1h'].close > bars['1h'].openZONES({id: 'blog-bullish-ob'})[0].touchCount = 1All conditions connect with AND. The candle must trade into the area and finish bullish above its upper edge. Touch counting uses range overlap: consecutive overlapping candles belong to one touch episode, so the rejection can occur after the first overlapping candle.
The action buys 0.01 BTC, places a stop at the selected zone’s low, and sets a target two times the signal-close-to-stop distance above the signal close. A Once per 1D limit restricts repeated entries; it is a time restriction rather than “one trade per zone.”
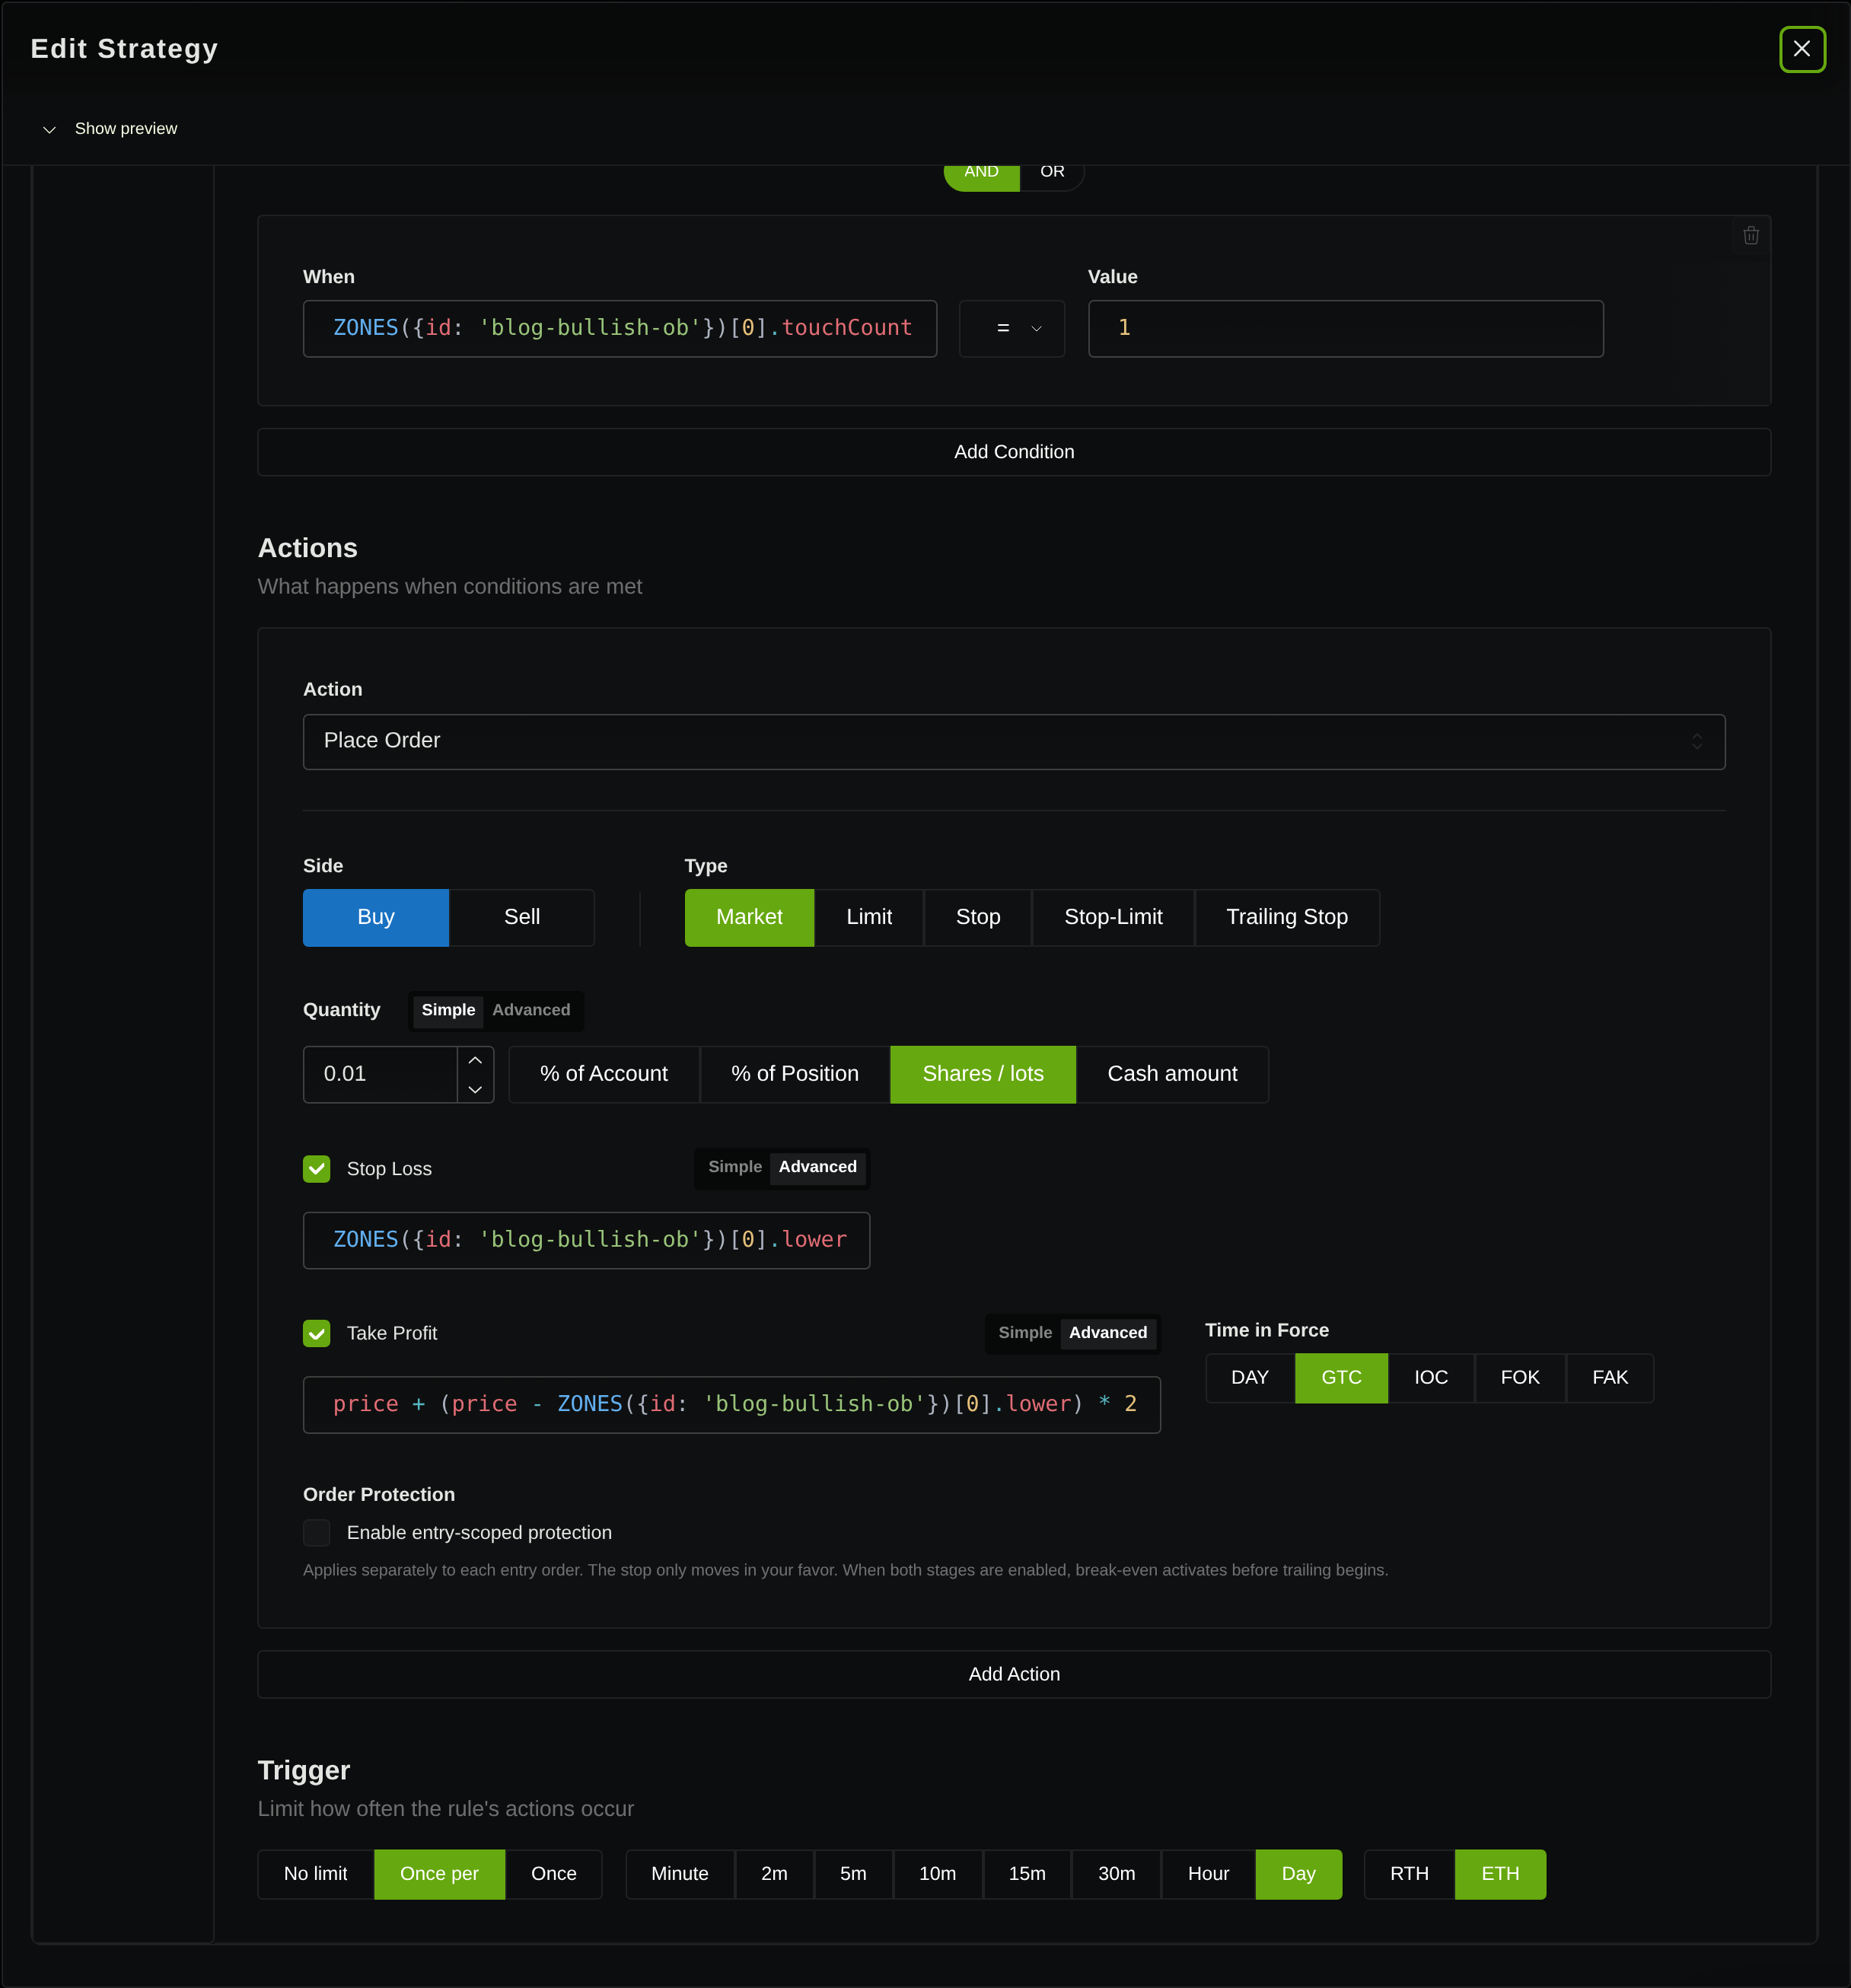
The retained set is limited by lookback and proximity to price; [0] selects the newest member of that set. It is not a permanent reference to every historical block.
Check confirmation time against the recorded trade
A rectangle drawn over an earlier candle can make a pattern look available too soon. TradingView’s repainting discussion explains why unconfirmed values and plotting into the past deserve scrutiny. That general warning is not proof of another platform’s timing; inspect the actual sequence.
For the first trade, the origin candle’s high was $94,952.29 and its low $94,542.00. Its range was $410.29, making the clearance $6.15435. The next candle closed at $95,128.59, above the required $94,958.44435.
- Origin: January 1, 23:00 UTCThe bearish candle supplies the two boundaries.
- Confirmation: January 2, 00:00 UTCThe bullish candle clears the origin high plus the specified range allowance.
- First zone event: 01:00 UTCThe retained event identifies the confirmed area and one touch. Confirmation and first observation are different timestamps.
- Rejection and order: 02:00 UTCLow $94,803.03 overlaps the zone; bullish close $95,234.36 clears its upper edge.
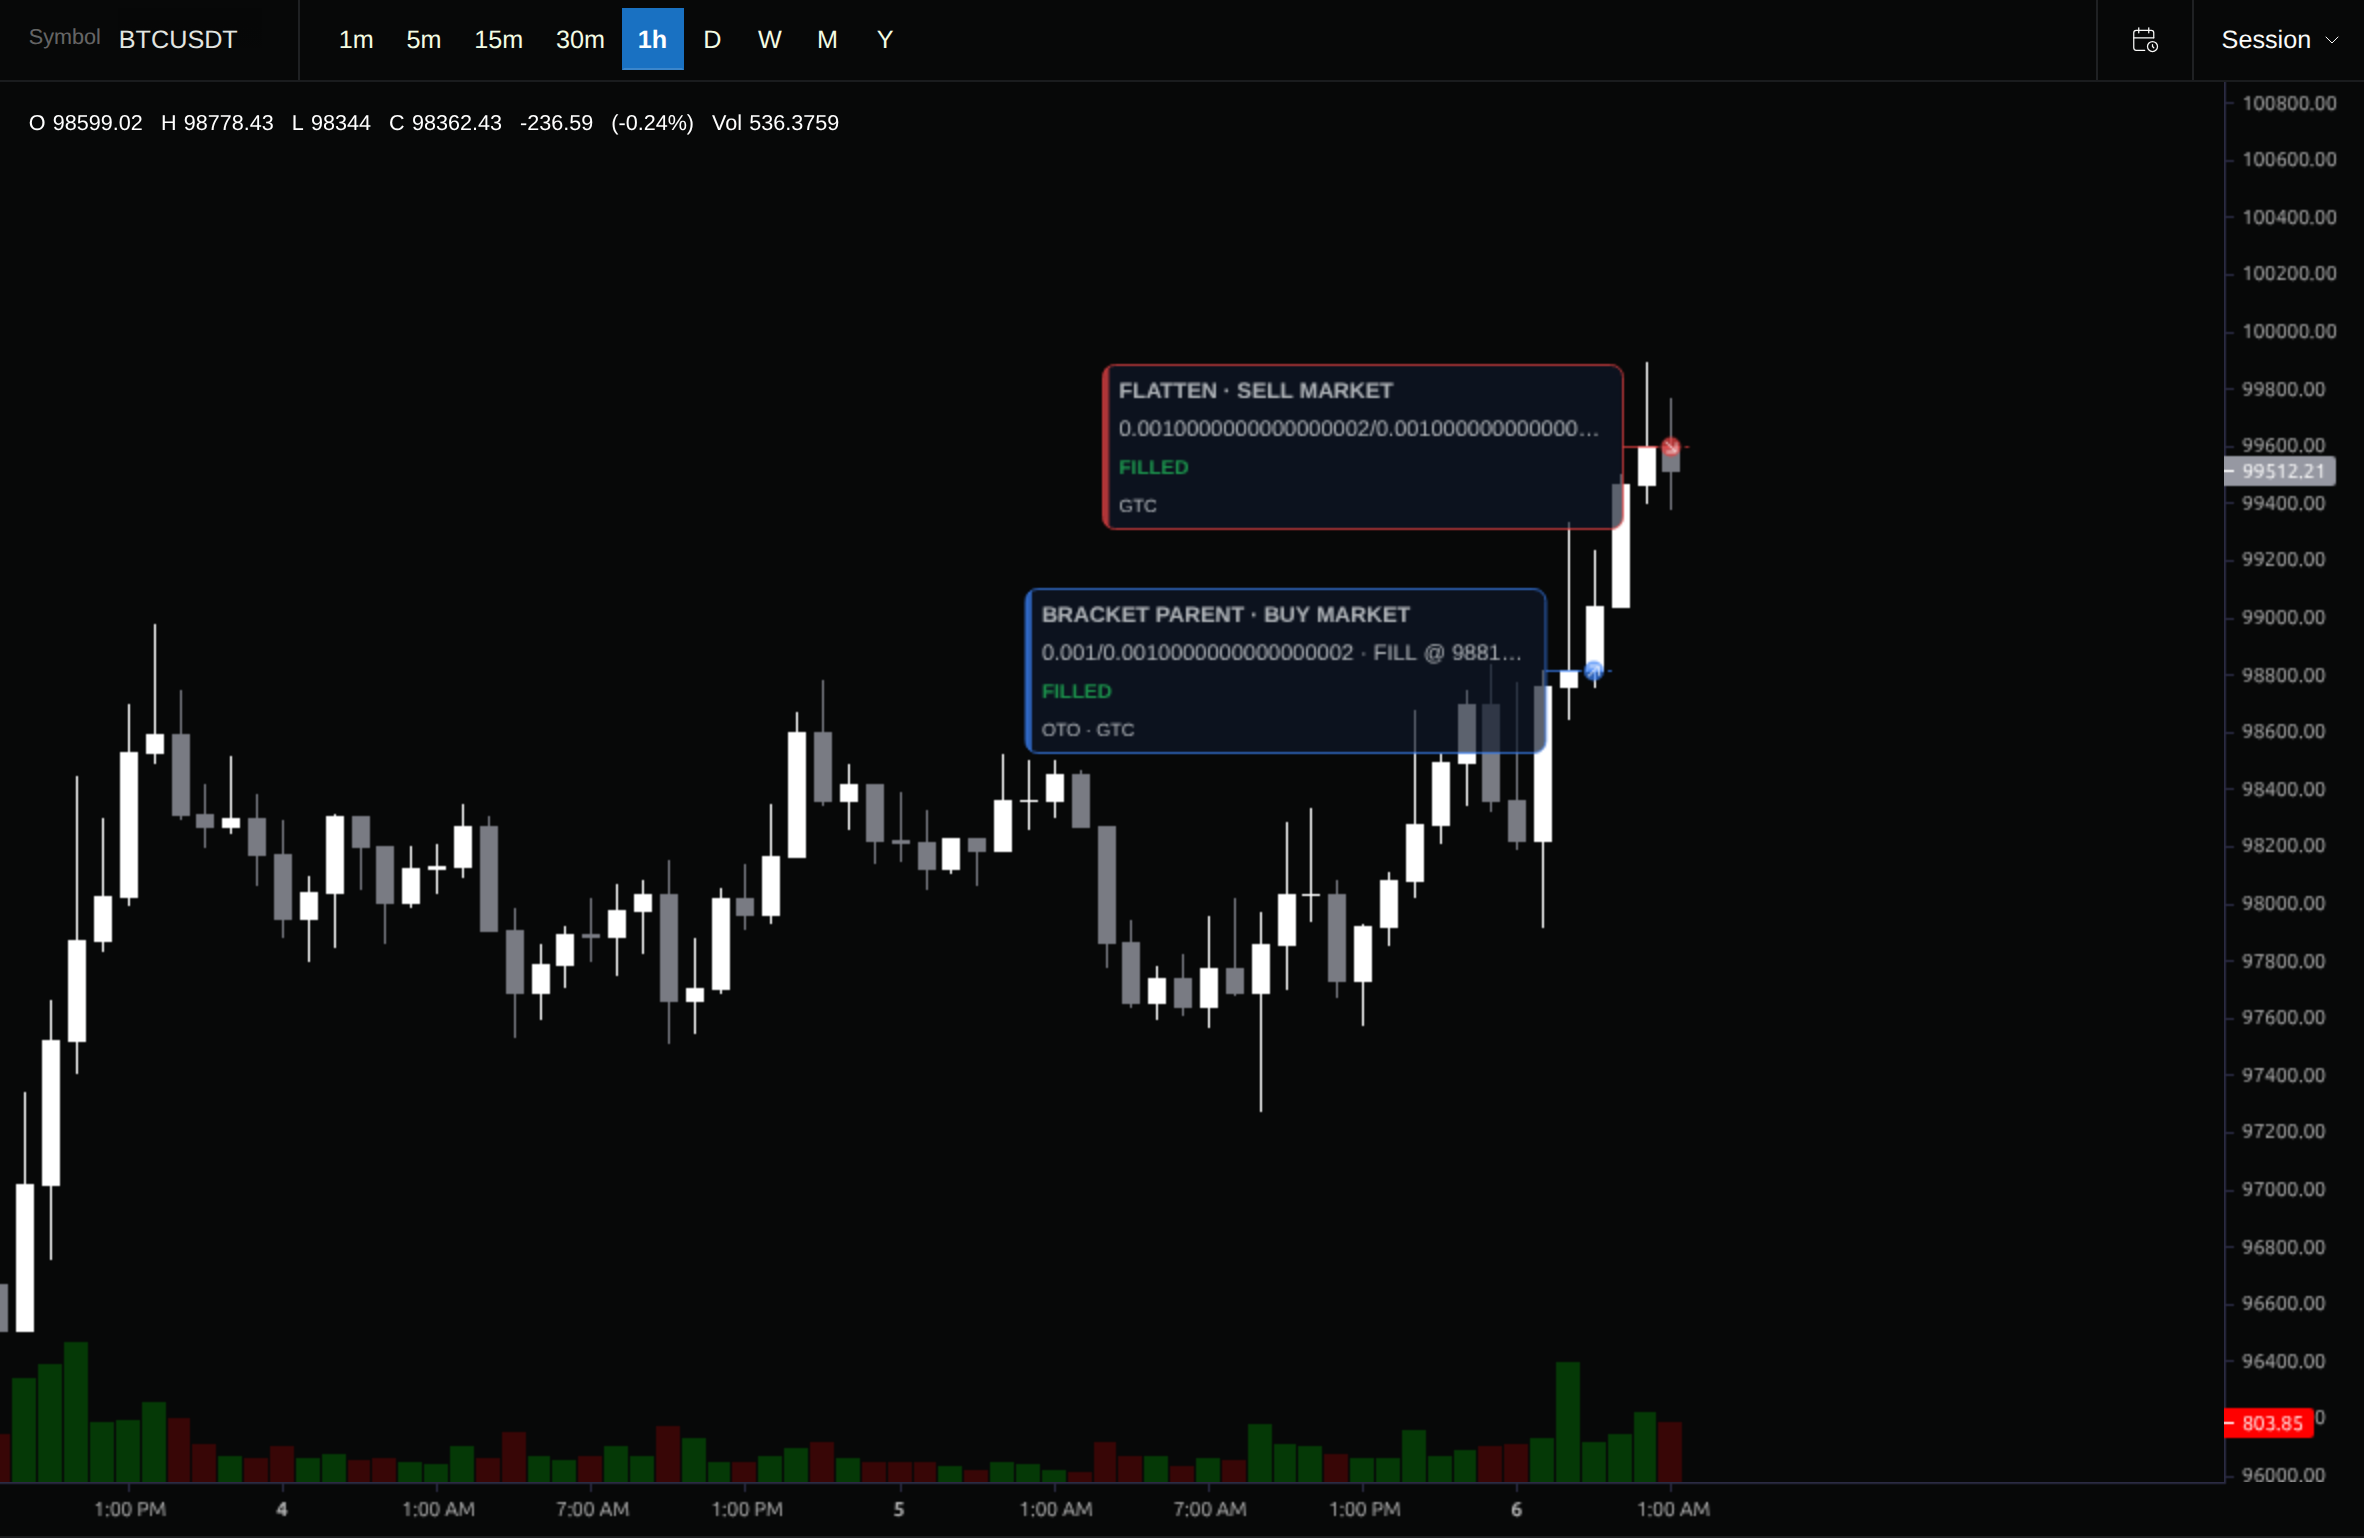
- Recorded fill: 03:00 UTCThe returned trade uses the prior signal candle’s $95,234.36 close.
These are recorded candle-opening and event labels, not intrahour execution times. The confirmation candle’s closing value exists only after that hour finishes. The detector excludes its newest candle from formation replay; this run’s first zone event occurs on the next update, rather than at the origin candle.
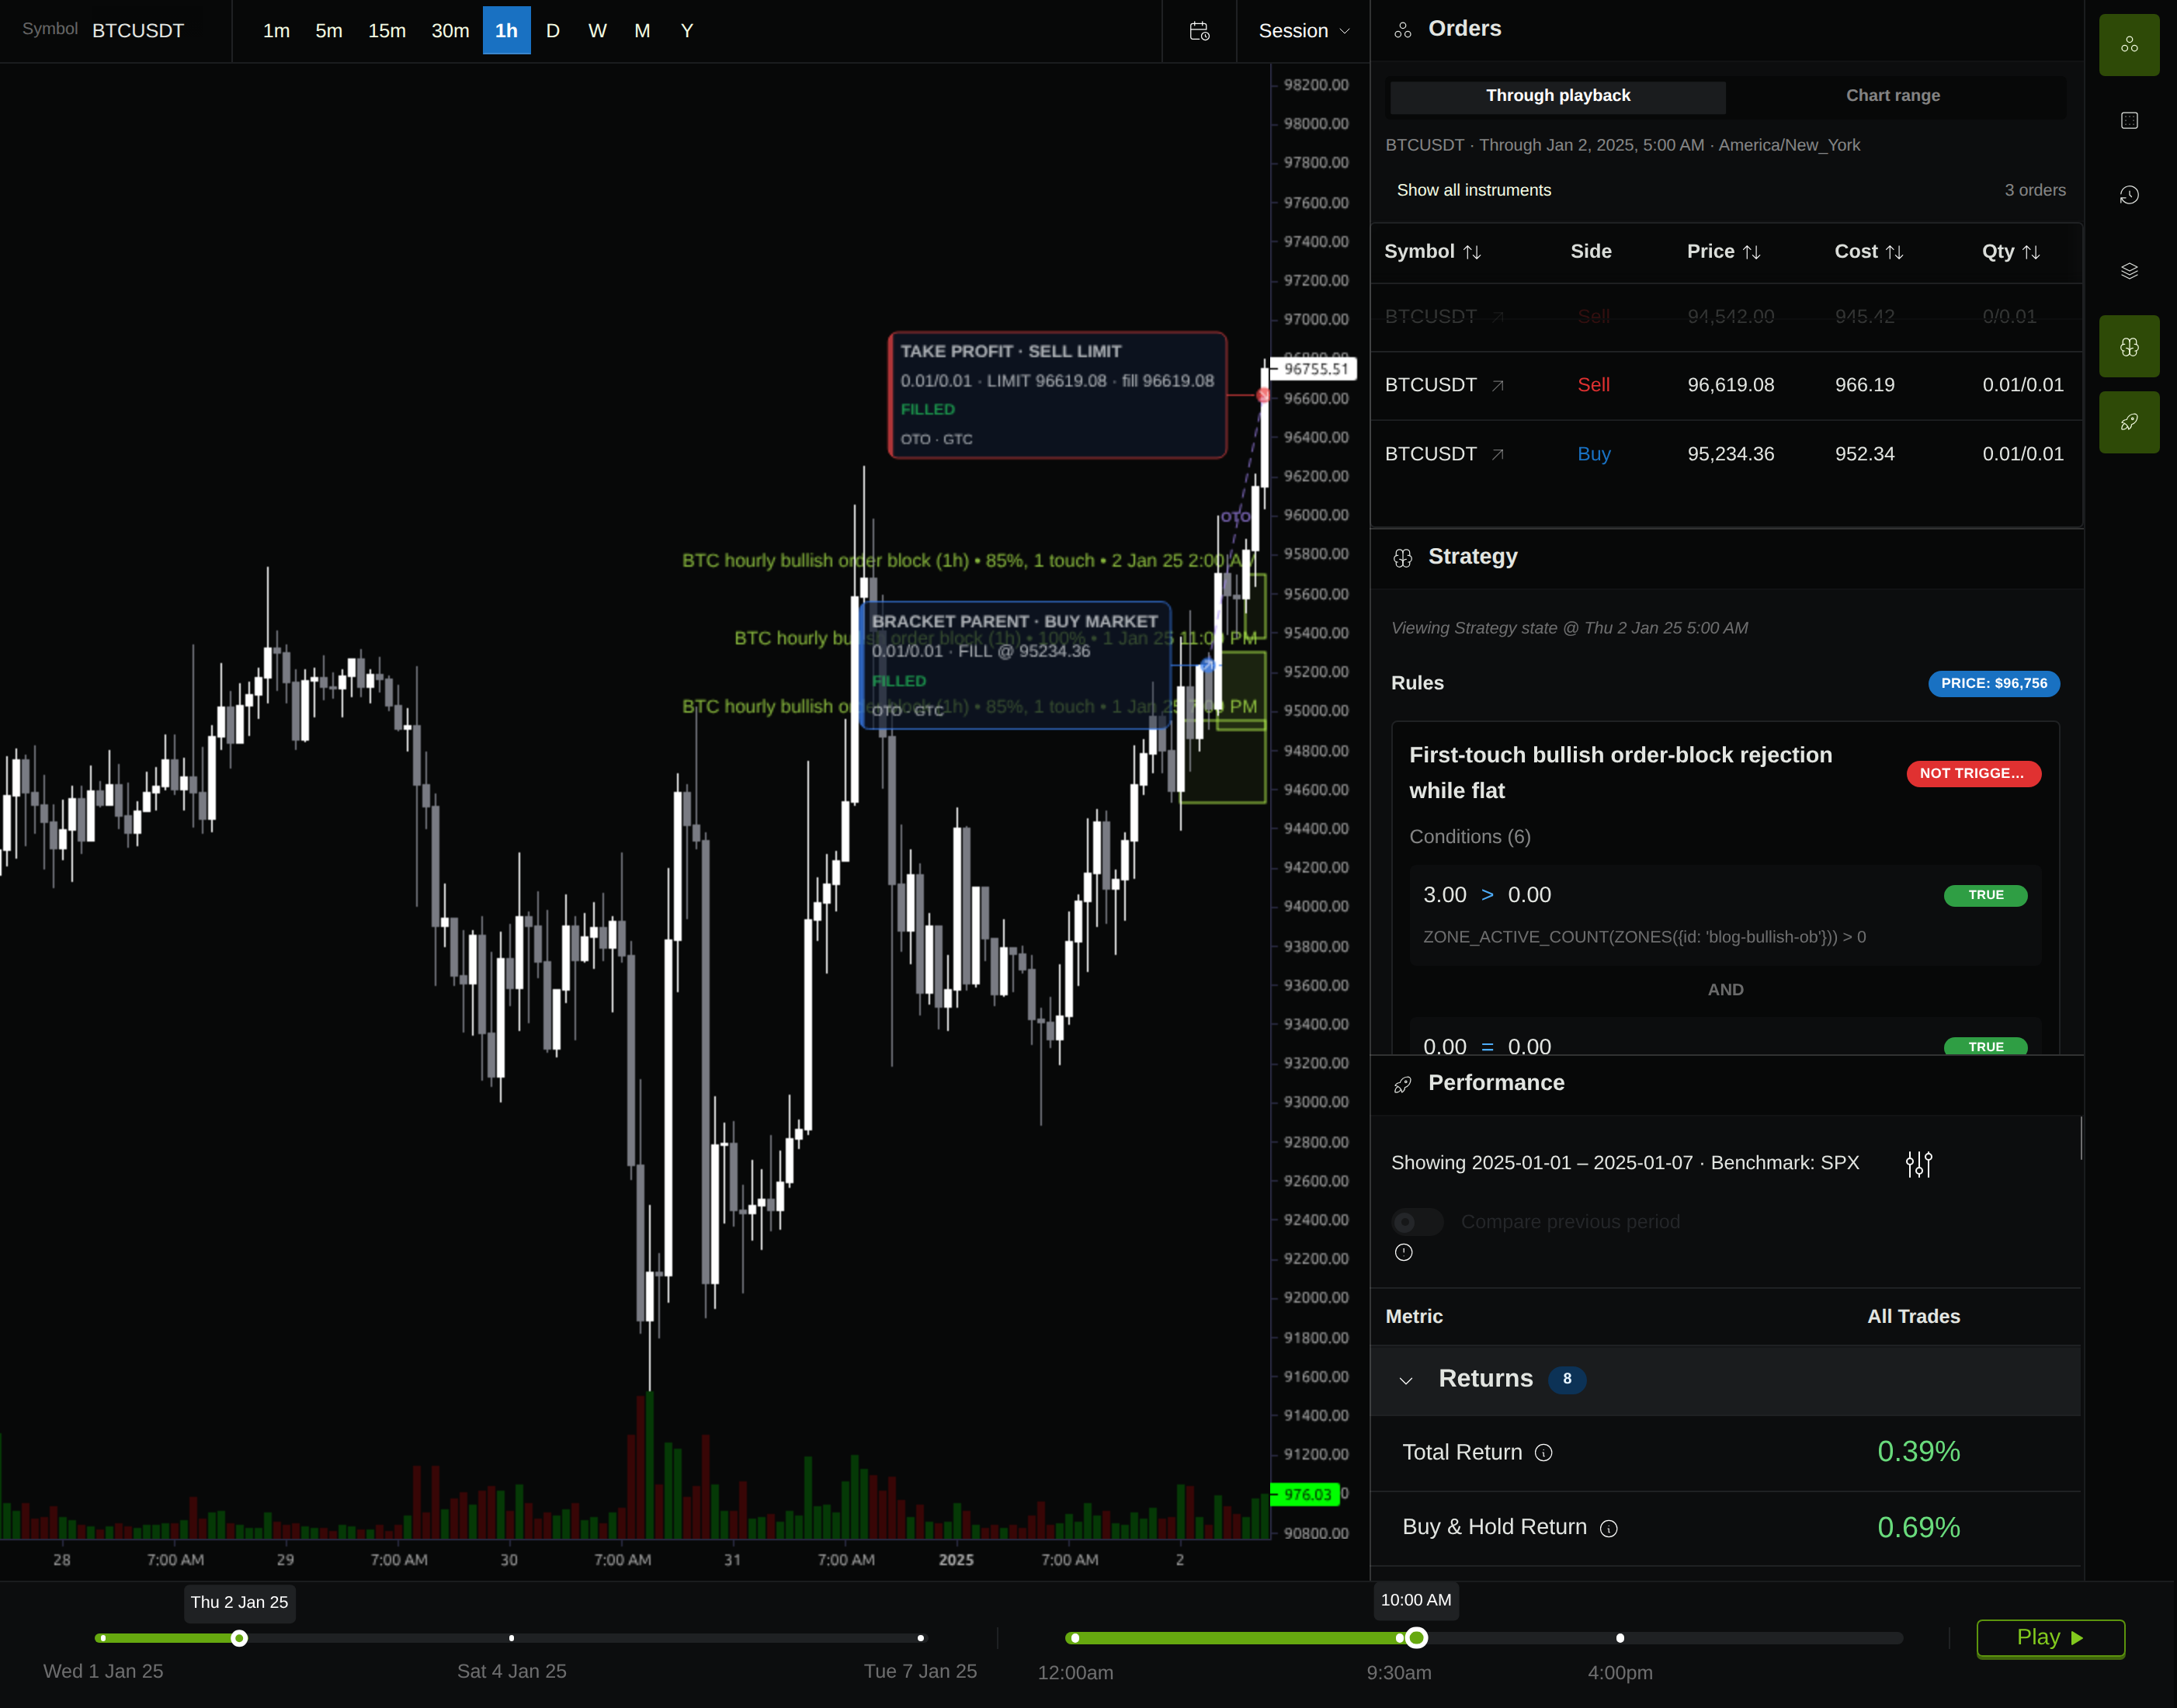
The position’s initial risk was (95,234.36 − 94,542.00) × 0.01 = $6.9236. Its target gain was $13.8472. That reconciles the returned prices and quantity; it does not establish that a real market order could obtain the simulated close.
Keep the interaction that failed
The third trade bought at $98,227.48 with a $97,909.85 stop. The returned stop exit lost $3.1763 on 0.01 BTC.
The zone’s invalidation timestamp was January 5, 08:00 UTC. That hourly candle closed at $97,861.04, below the saved lower boundary. Its later drawing-update event was timestamped 10:00 UTC: the chart update and recorded invalidation are separate observations.
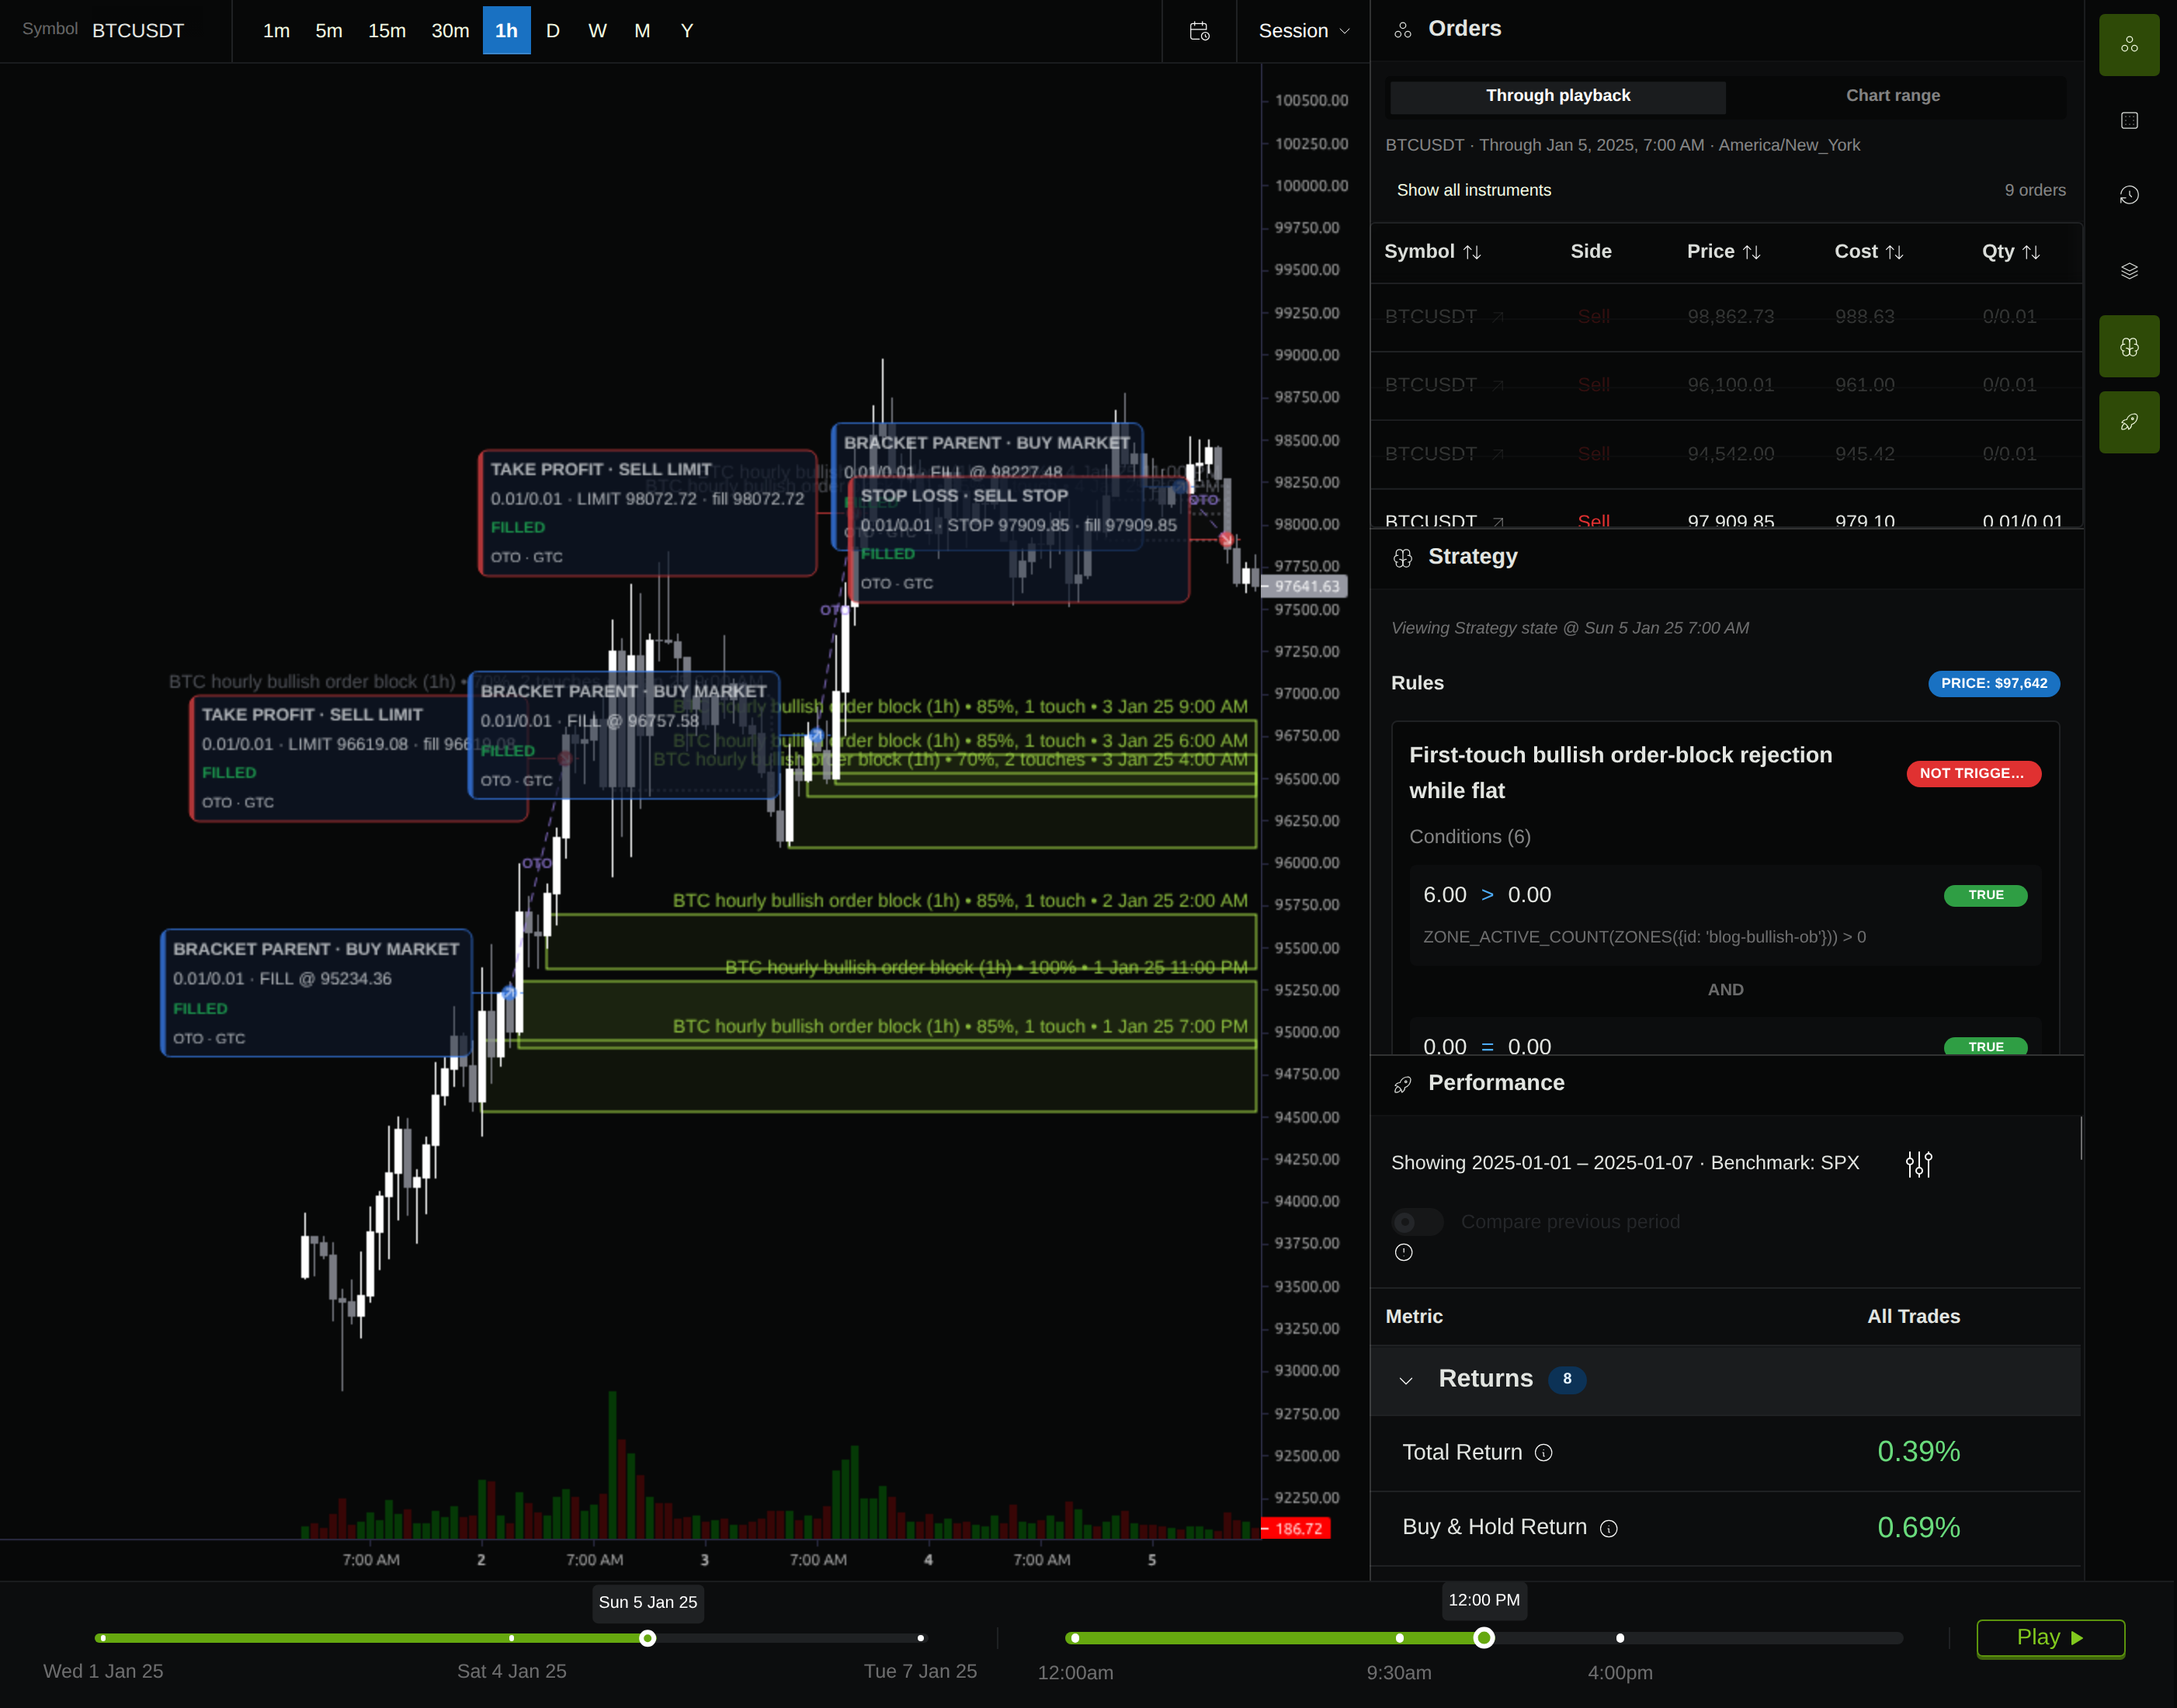
A failed zone does not automatically become a profitable opposite-direction setup. The useful observation is narrower: these entry conditions can trigger before an area later fails.
Read the report as a rule audit
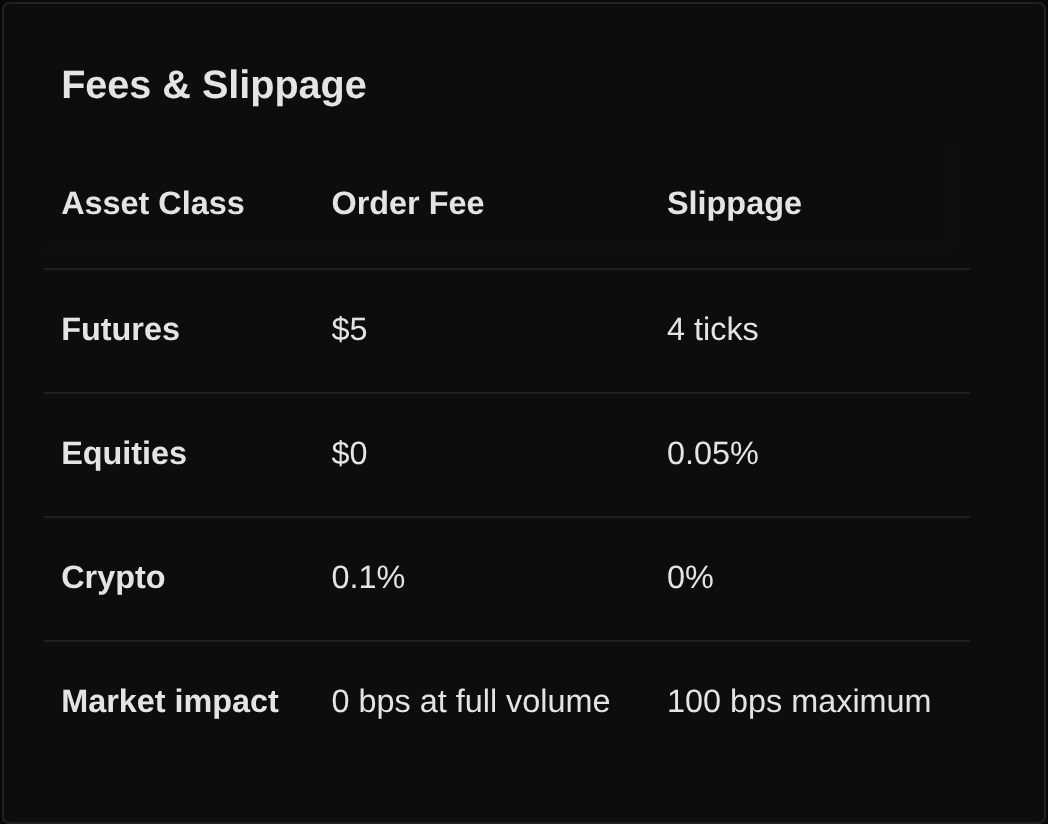
The single prespecified run used Binance spot BTC/USDT, January 1–7, 2025, hourly bars, $10,000 starting capital, fixed 0.01 BTC sizing, on-close execution, close-price fills, enforced volume limits, and final flattening. Commissions, slippage, and market impact were deliberately set to zero.
| Returned trade | P&L before modeled costs |
|---|---|
| First target exit | +$13.8472 |
| Second target exit | +$13.1514 |
| Stop exit | −$3.1763 |
| Third target exit | +$15.6645 |
| Final boundary close | $0.0000 |
| Total | +$39.4868 |
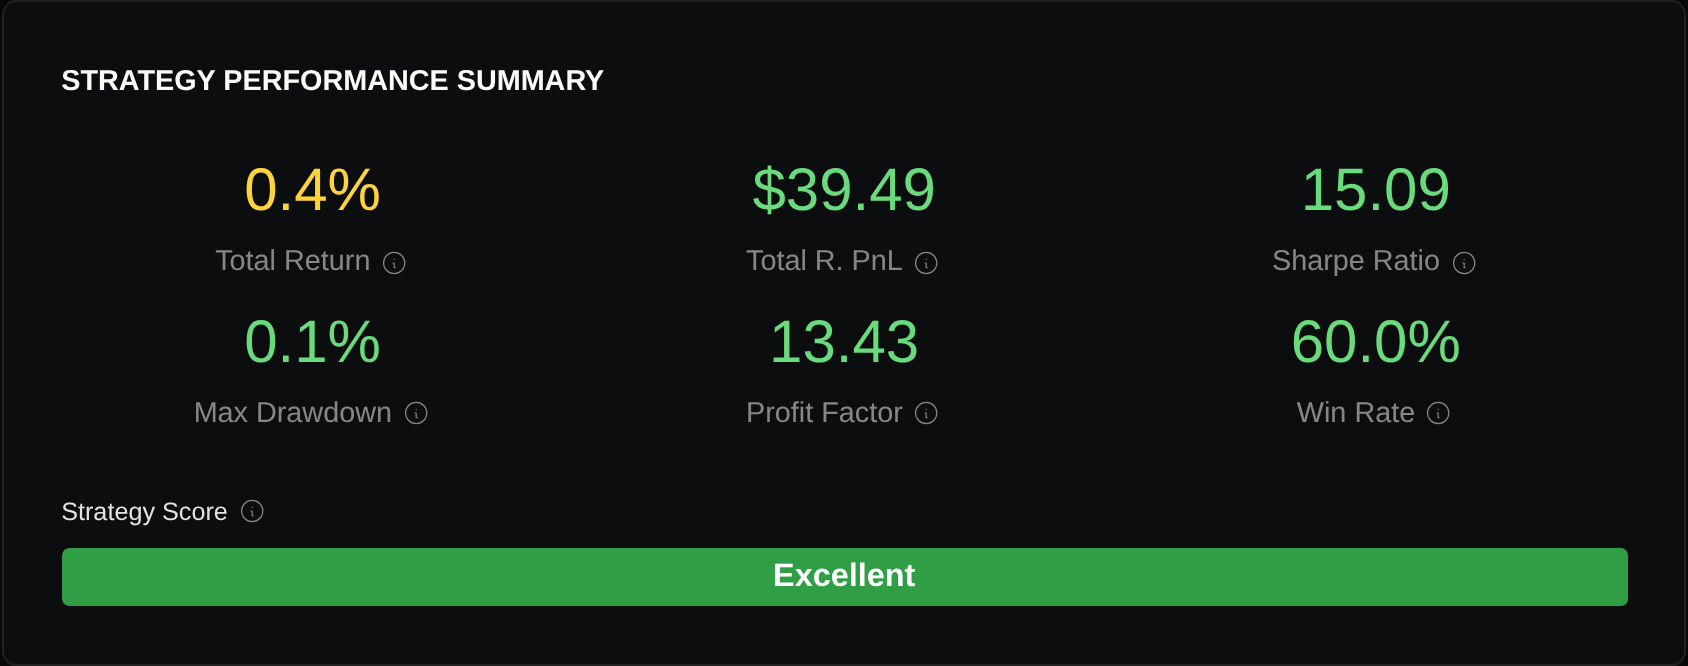
Ending equity was $10,039.4868. The records contain three positive trades, one negative trade, and one flat trade; the report counts that flat trade within its two “losing trades.” The final flat entry and flattening share a January 8, 00:00 UTC timestamp, beyond the 168 hourly bars checked for January 1–7, and its price matches that additional boundary candle’s close. Keep that boundary artifact visible rather than counting it as a normal losing retest.
This run answers a rule-inspection question. It does not establish after-cost profitability, reliable risk estimates from five trades, intrabar price ordering, or live fill quality. Test realistic costs and later periods separately using the slippage stress-test workflow.
Give swing levels and breakers their own definitions
The same worksheet helps distinguish three ideas without treating their names as detection logic:
| Idea | What must be explicit |
|---|---|
| Order block | Origin candle, displacement confirmation, bounds, and close-versus-wick invalidation; executed above |
| Confirmed swing level | Middle candle compared with both neighbors, confirmation after the right neighbor, and zone width |
| Breaker hypothesis | Which original block failed, which bounds survive, and a separately confirmed opposite-side retest |
The current swing-low preset compares the middle candle’s low with both neighbors, uses a band extending upward by 1% of that middle candle’s range, and invalidates on a later wick below its low. The swing-high preset mirrors that structure. These are source-checked definitions, not additional executions in this article; set their interval explicitly before testing them.
This run did not execute a breaker strategy. There is no dedicated breaker preset in the inspected catalogue, and changing a zone’s label does not add failed-block tracking or automatic role reversal. A custom breaker needs its own saved conditions and an observed failure-to-retest sequence before making that claim.
Choose one area, write its formation and invalidation rules, then use Stratifyre’s backtesting workflow to inspect when it became available, why the trade fired, and what happened when it failed.
Put your strategy rules to the test
Build your strategy, inspect historical trades, and review the assumptions behind your results.
Build and test your strategy