Combining trading strategies: drawdown and shared capital
Align trading losses before combining strategies, then check simultaneous positions, idle cash, sizing, and a real SPY–QQQ shared account.
Two backtests can finish above their starting balances and still lose together. Different tickers, indicators, or strategy names do not tell you whether their bad periods overlap. Before combining trading strategies, put their account histories on the same calendar and specify how they will share capital.
This example uses executed SPY and QQQ moving-average histories, an author-calculated equal-capital blend, and a new Stratifyre backtest applying one rule to both ETFs in a shared account. The blend and the shared-account run answer different questions; neither demonstrates merging two separately saved strategies into a native portfolio.
Align losses before adding returns
SPY targets the S&P 500’s large-cap U.S. equity exposure; QQQ tracks the Nasdaq-100’s largest non-financial Nasdaq companies. Those objectives give a reason to investigate common equity exposure, rather than assume two tickers diversify each other. They do not establish this strategy’s historical correlation. State Street’s SPY description, Invesco’s QQQ description.
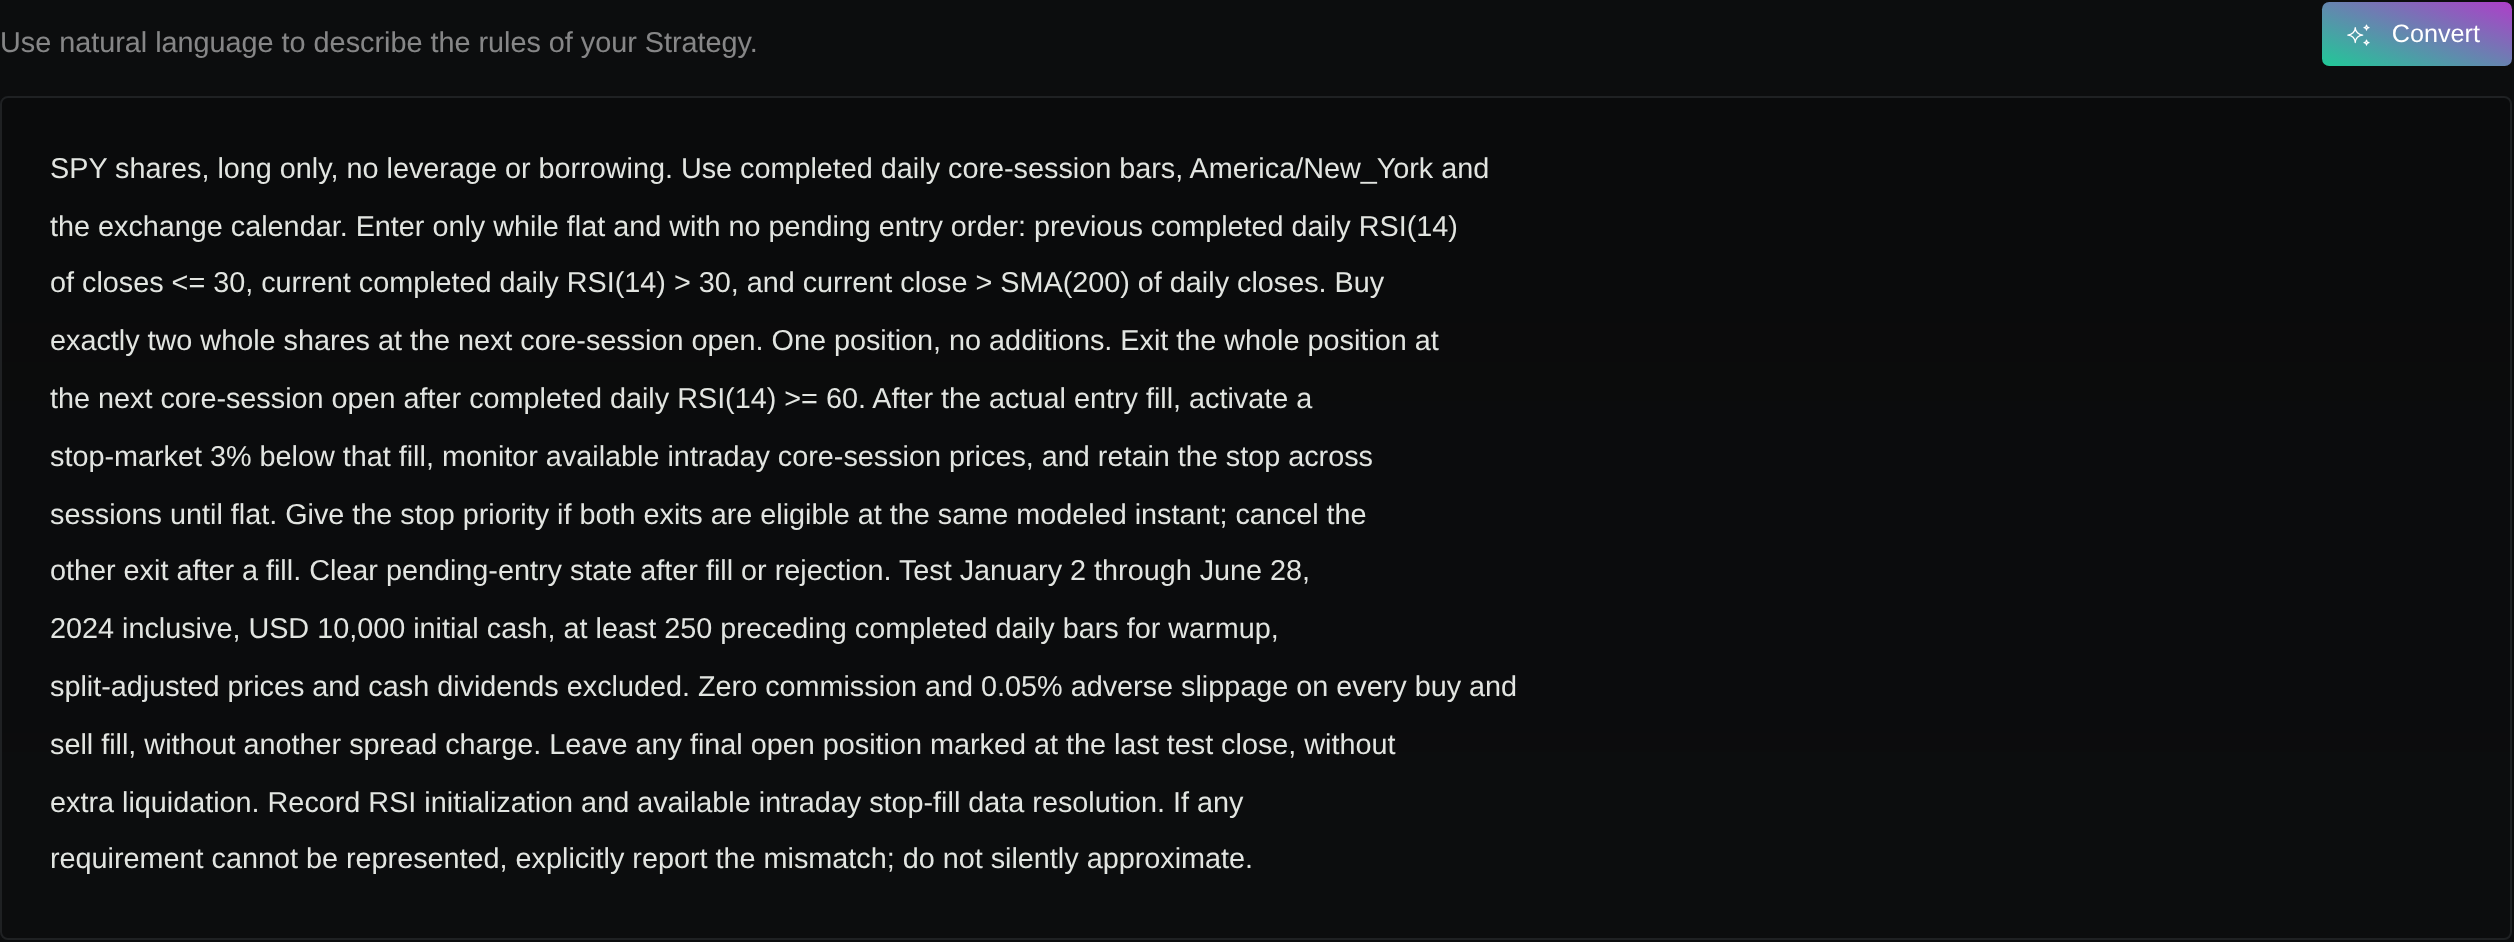
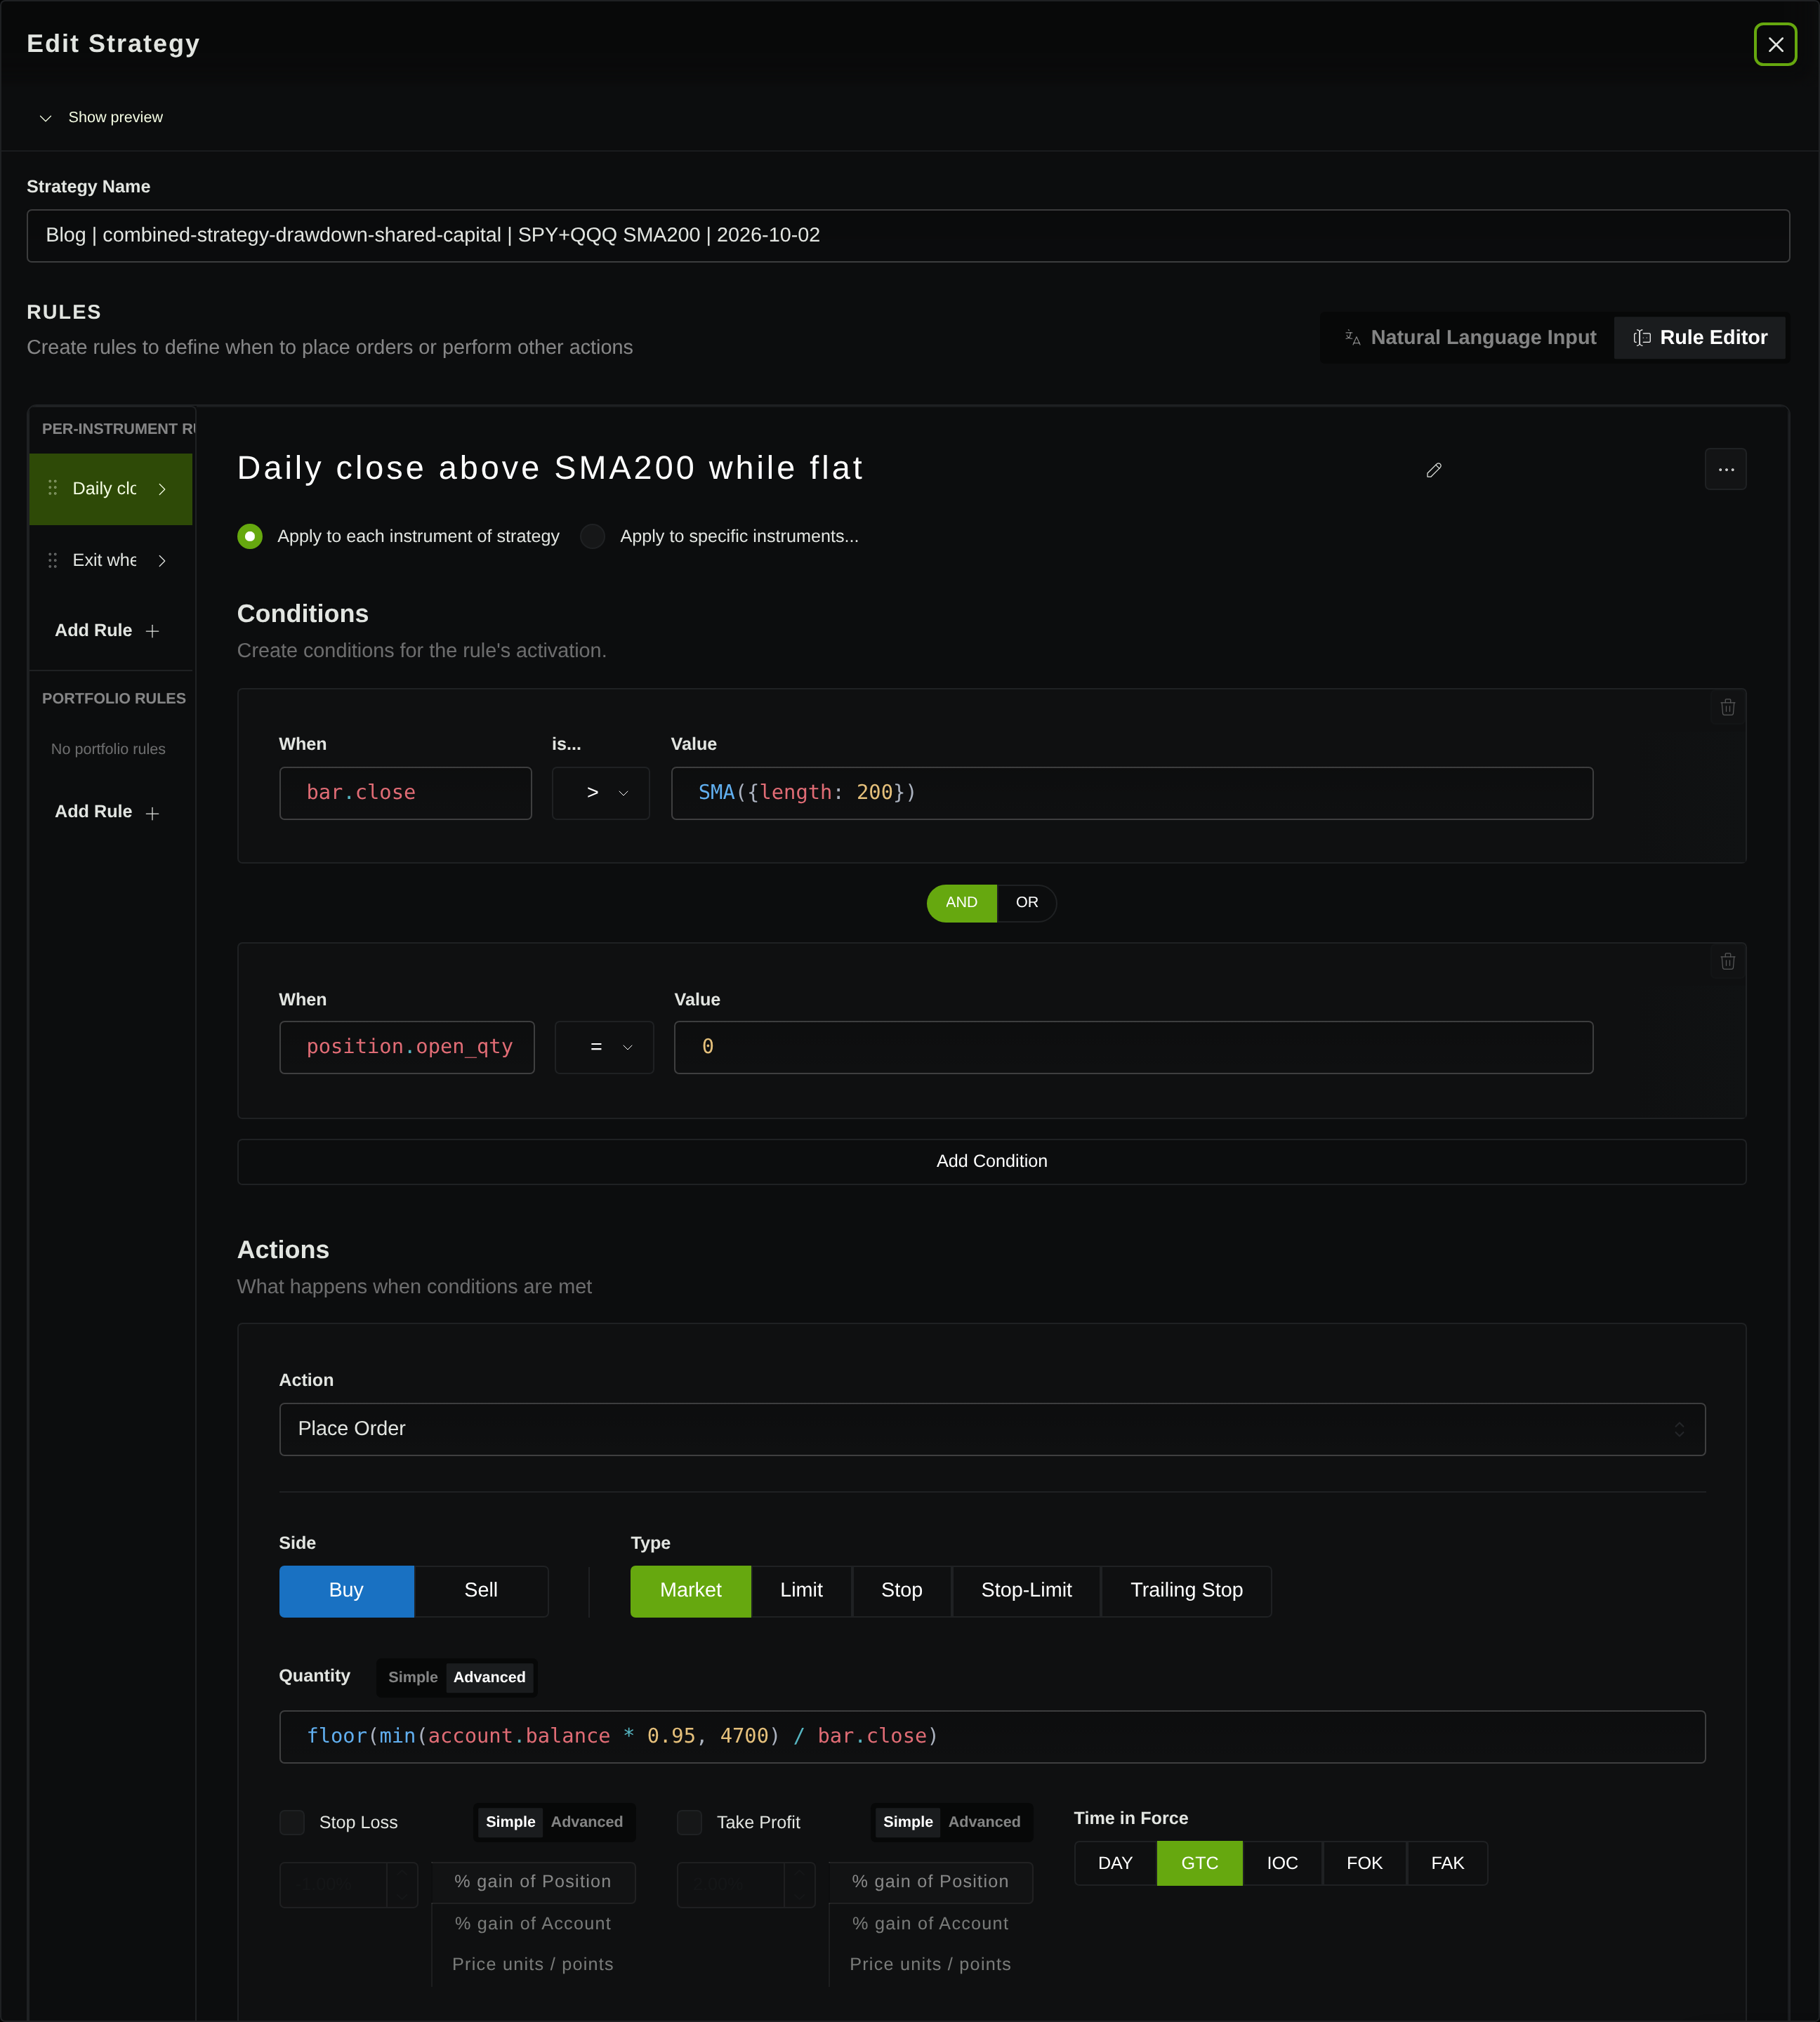
The retained individual runs used the same long/cash rule: buy while flat when the daily close exceeds its 200-bar simple moving average; flatten when the close is at or below that average. Each independent account started with $10,000 and requested whole shares using floor(account.balance * 0.95 / bar.close).
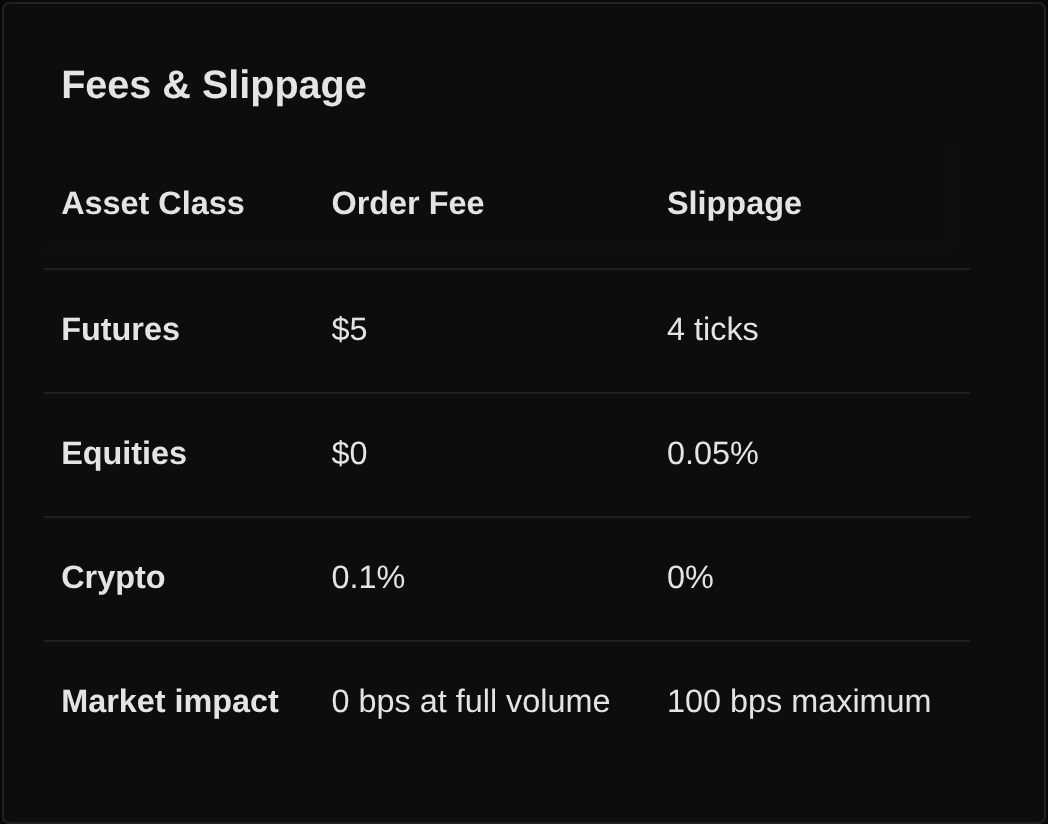
Both ran from January 2, 2024 through June 30, 2025 with daily regular-session data, saved On-Open execution, pessimistic fill settings, a $1 equity-order fee input, and 0.05% equity slippage. Shorts, tax, and end-of-test flattening were disabled. These are recorded historical configurations, not independently certified execution models.
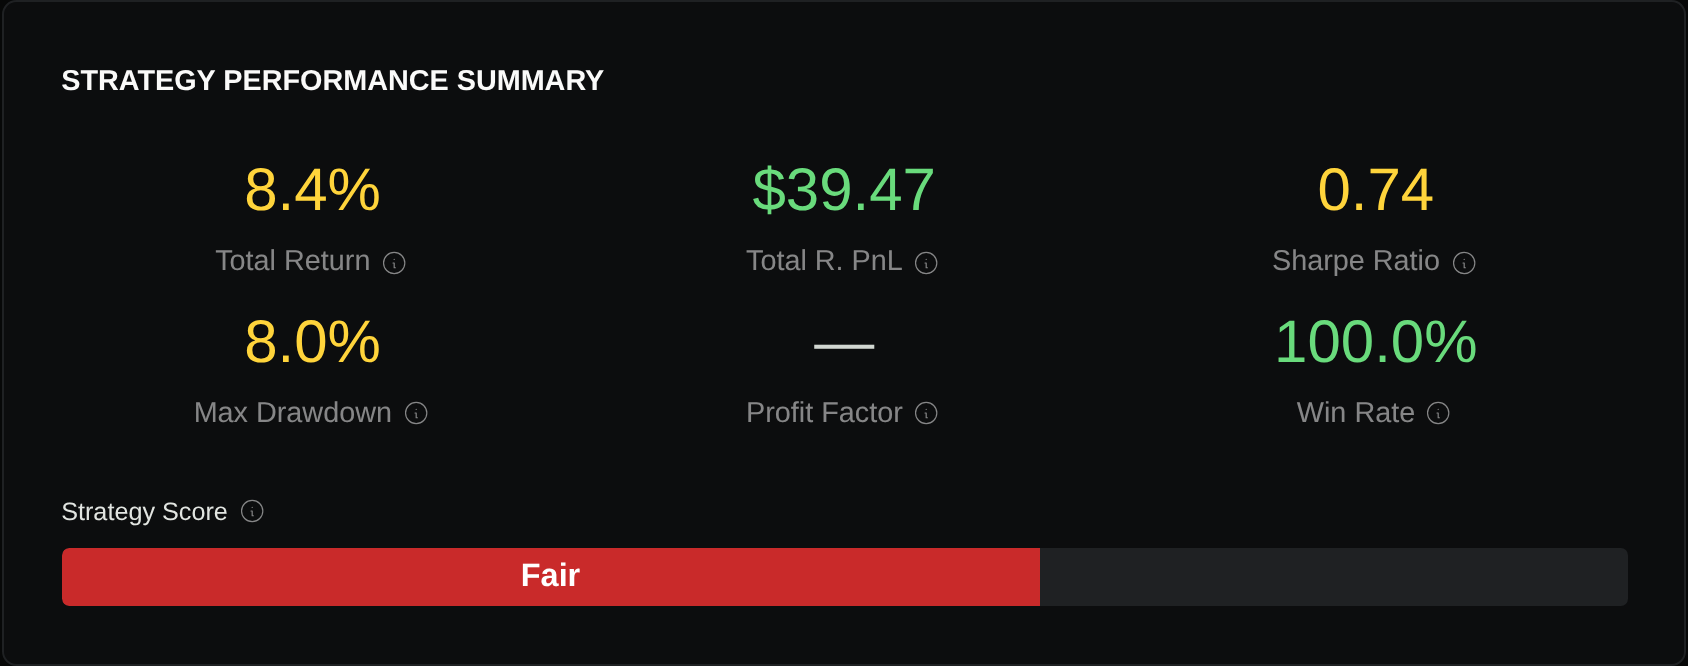
The two full equity histories contain 374 identical observation timestamps. Calculating consecutive account returns on those dates produced a correlation of 0.9214, with 47 jointly negative observations out of 373 return intervals. Each account had 55 negative intervals. The analysis includes flat periods: both accounts were in cash on 241 observations and both held investments on 129.
These are changes in marked account equity, including idle cash and returned costs, rather than correlation between closed-trade outcomes. A positive QQQ closed trade can still fall sharply from an earlier account peak.
Calculate the combined path, then its drawdown
For a $10,000 account notionally divided equally between independent sleeves, the author calculation is:
Combined equity(t) = 0.5 × SPY equity(t) + 0.5 × QQQ equity(t)Drawdown(t) = (highest combined equity so far − current equity) / highest combined equity so farAdding the two unscaled $10,000 accounts would describe $20,000 of starting capital. The equal-capital calculation preserves a $10,000 starting value. It does not re-execute half-sized orders: fractional scaling of whole shares and fixed $1 fees makes it an analytical approximation to separate $5,000 sleeves.
| History | Ending marked equity | Return | Maximum observed drawdown |
|---|---|---|---|
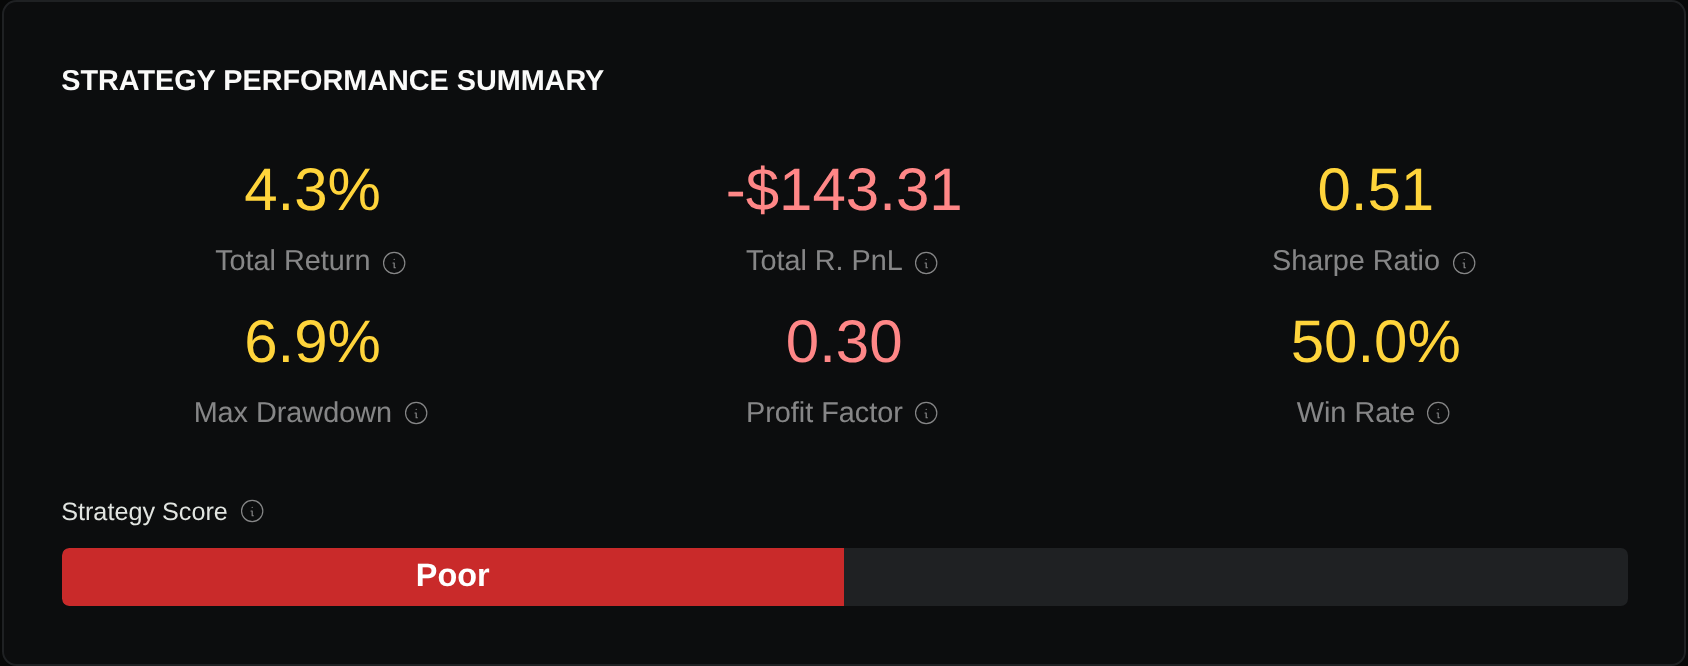
| Independent SPY | $10,429.60 | 4.30% | 6.94% |
| Independent QQQ | $10,835.43 | 8.35% | 8.04% |
| Equal-capital author blend | $10,632.52 | 6.33% | 7.50% |
| Executed shared account | $10,627.48 | 6.27% | 7.31% |
The blend peaked on February 19, 2025 and reached its largest drawdown on March 10. QQQ’s individual trough occurred earlier, on March 6. Averaging the individual maximum drawdown percentages discards that timing; calculate drawdown from the combined path itself.
View example data
| UTC date | SPY | QQQ | Author blend | Shared account |
|---|---|---|---|---|
| 2024-01-02 | 10000.00 | 10000.00 | 10000.00 | 10000.00 |
| 2024-01-31 | 10000.00 | 10000.00 | 10000.00 | 10000.00 |
| 2024-02-29 | 10000.00 | 10000.00 | 10000.00 | 10000.00 |
| 2024-03-28 | 10000.00 | 10000.00 | 10000.00 | 10000.00 |
| 2024-04-30 | 10000.00 | 10000.00 | 10000.00 | 10000.00 |
| 2024-05-31 | 10000.00 | 10000.00 | 10000.00 | 10000.00 |
| 2024-06-28 | 10000.00 | 10000.00 | 10000.00 | 10000.00 |
| 2024-07-31 | 10000.00 | 10000.00 | 10000.00 | 10000.00 |
| 2024-08-30 | 10000.00 | 10000.00 | 10000.00 | 10000.00 |
| 2024-09-30 | 10000.00 | 10000.00 | 10000.00 | 10000.00 |
| 2024-10-16 | 10033.72 | 9990.53 | 10012.13 | 10011.35 |
| 2024-10-31 | 9814.36 | 9857.15 | 9835.76 | 9838.49 |
| 2024-11-29 | 10363.80 | 10350.20 | 10357.00 | 10346.76 |
| 2024-12-31 | 10093.72 | 10376.04 | 10234.88 | 10223.96 |
| 2025-01-31 | 10346.36 | 10586.37 | 10466.37 | 10449.91 |
| 2025-02-19 | 10523.96 | 10914.69 | 10719.33 | 10694.23 |
| 2025-02-28 | 10222.68 | 10319.23 | 10270.96 | 10261.53 |
| 2025-03-06 | 9882.36 | 10037.47 | 9959.92 | 9957.38 |
| 2025-03-10 | 9793.30 | 10037.47 | 9915.39 | 9912.35 |
| 2025-03-31 | 9852.69 | 10037.47 | 9945.08 | 9941.04 |
| 2025-04-30 | 9852.69 | 10037.47 | 9945.08 | 9941.04 |
| 2025-05-30 | 9974.72 | 10251.15 | 10112.94 | 10107.90 |
| 2025-06-30 | 10429.60 | 10835.43 | 10632.52 | 10627.48 |
Execute and inspect the allocation policy
For portfolio backtesting without coding, distinguish selecting multiple symbols from combining saved strategies. This demonstration selected SPY and QQQ in one strategy and applied the same rule independently to each symbol within one account.
The new entry quantity was:
floor(min(account.balance * 0.95, 4700) / bar.close)This caps requested signal-price notional at $4,700 per entry and rounds down to whole shares. The inspected runtime maps account.balance to the portfolio’s ledger balance, updated for realized P&L and fees; it records actual uninvested cash separately. Both symbols can read the same account snapshot before fills, so the expression does not establish quantity reduction when available cash is scarce or guarantee that orders will be admitted.
With two positions, the intended initial allocation leaves a nominal $600 reserve before rounding, costs, and price differences. That is a budget assumption, rather than an enforced cash reserve, a $4,700 loss limit, or a continuously maintained 47% portfolio weight. Positions can grow, and fill prices can differ from the price used for sizing.
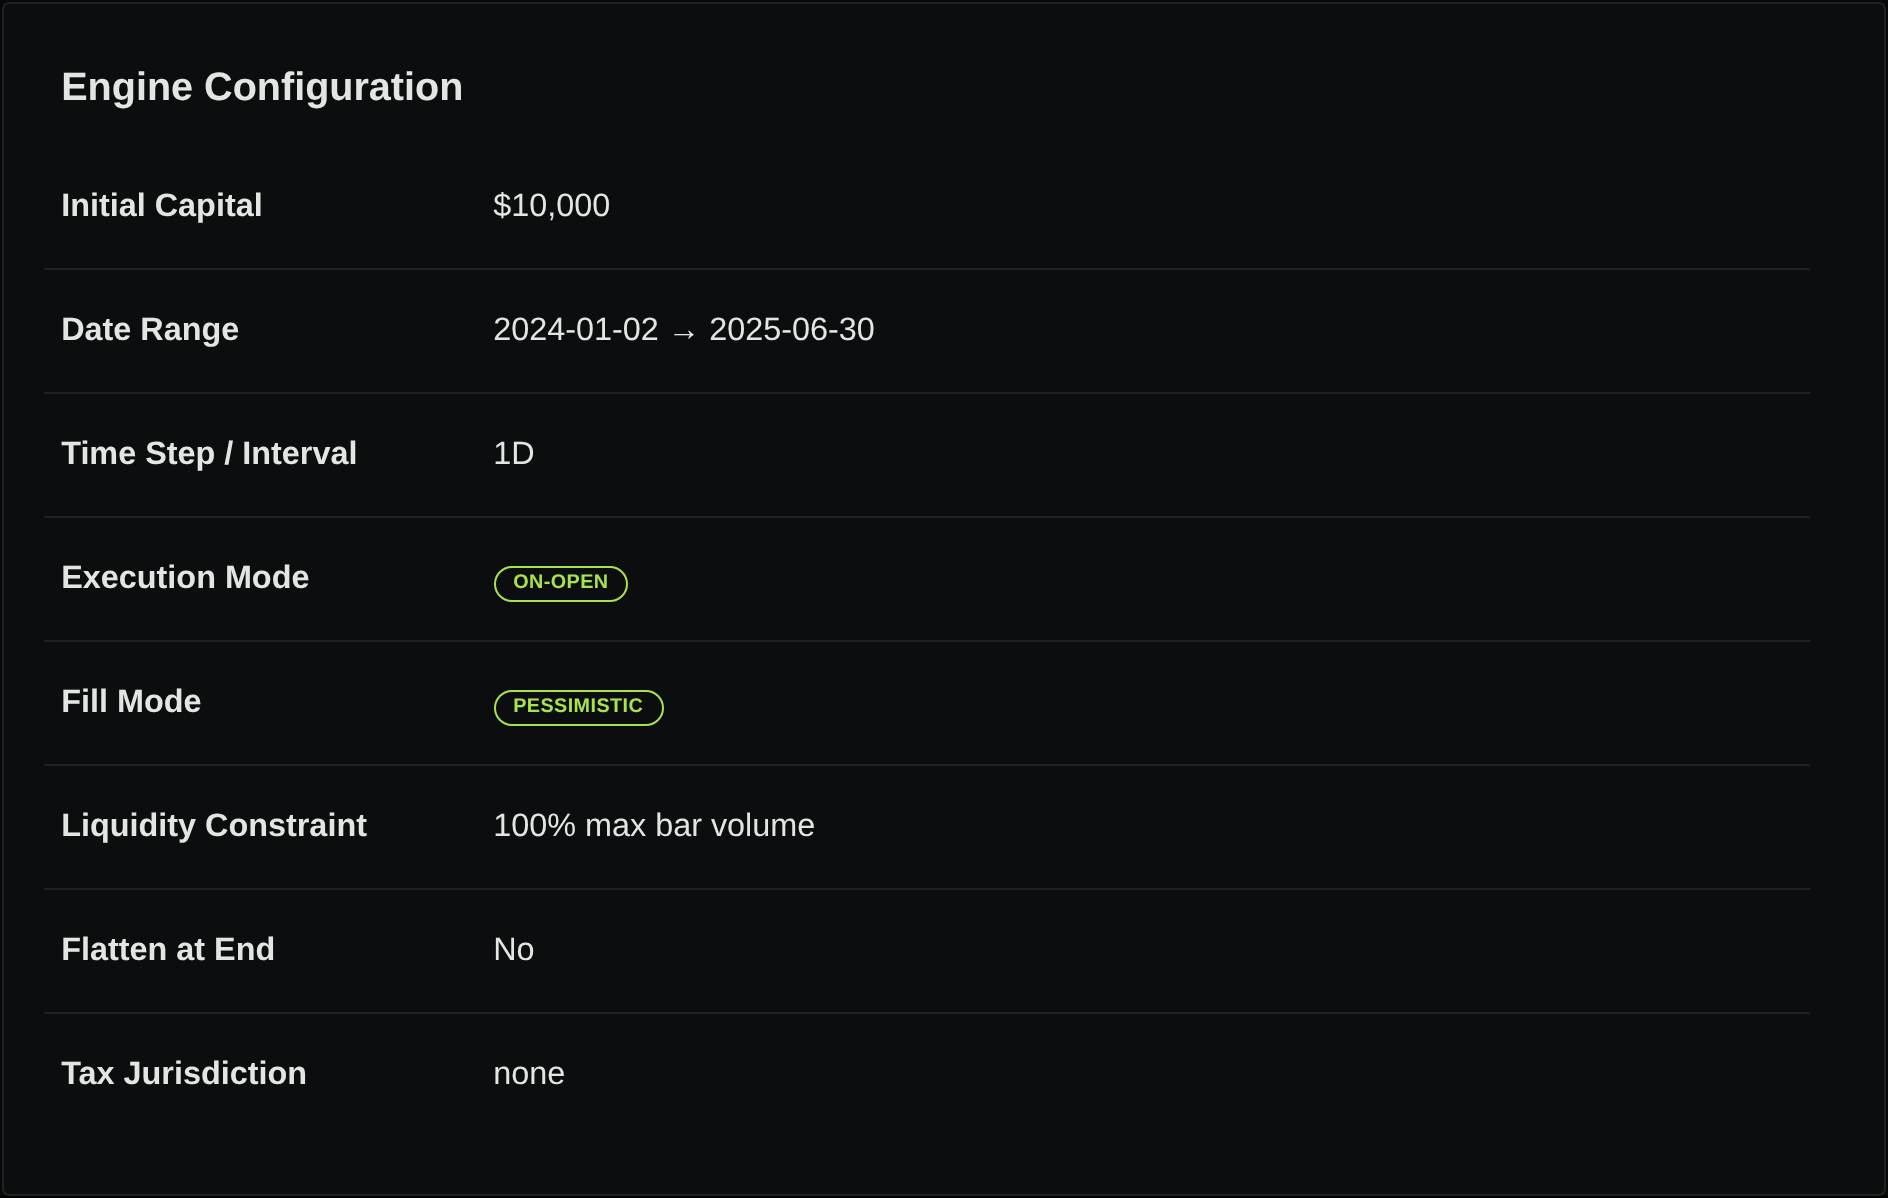
The first recorded entries occurred together on October 16, 2024: eight SPY shares and nine QQQ shares. Their returned entry prices imply $9,063.01 spent on shares; the cash history shows $934.99 remaining, reconciling the additional $2 to two $1 entry charges. Cash was available for both orders in this run, so it does not demonstrate which signal wins when funds are insufficient.
After QQQ exited on March 6 and SPY on March 10, cash was $9,912.35. The pair’s gross closed P&L was −$83.65; four $1 entry/exit charges reconcile the $87.65 account loss. Costs remain in the path even when the account is flat.
Read holdings and cash alongside closed trades
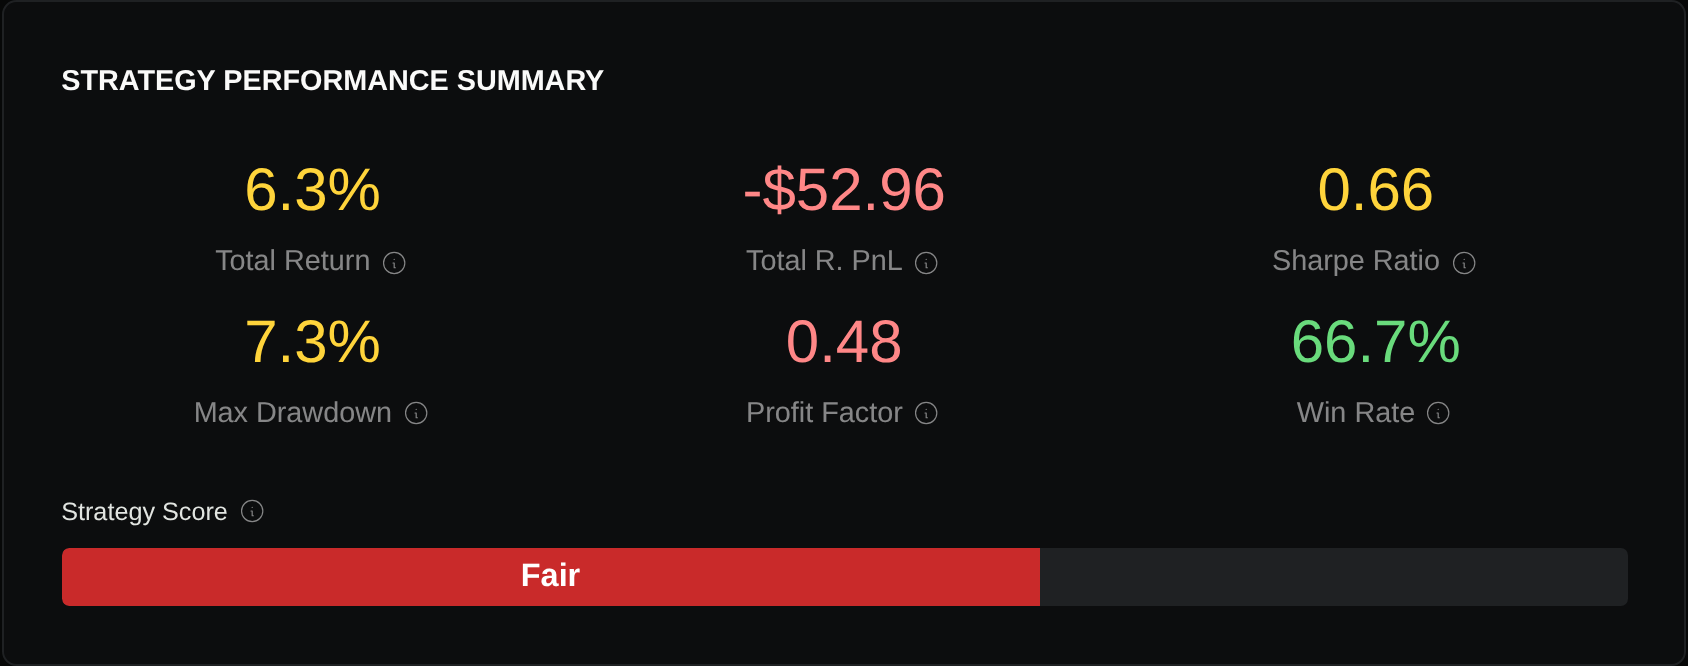
The shared account ended with $719.52 cash plus $9,907.96 holdings = $10,627.48 equity. Three closed trades contributed approximately −$52.96 gross P&L; remaining investments contributed to the marked ending value. No terminal liquidation was requested, so this ending equity is not an all-cash balance after selling everything and paying exit costs.
The returned job record reports unrealized P&L as zero despite the curve’s holdings and marked equity. This comparison uses the retained equity/cash/holdings history and report, rather than treating that job field as a reconciled account total.
Cash averaged $6,796.69 across the 374 shared-account observations, while the highest recorded gross exposure was 93.23% of equity. The long cash periods matter as much as the two tickers. The first 199 observations were flat even though pre-window daily history was available; availability does not prove that the engine used it to warm the indicator. Correlation and exposure figures therefore describe this returned path, including that initial cash period.
Keep the conclusion within the experiment
The observations carry one regular-session timestamp per date, at 14:30 UTC in winter and 13:30 UTC in summer. They do not establish closing-equity or intraday worst-case drawdown. Saved On-Open settings alone also do not prove that every signal used a completed close before a later opening fill. Causal timing, warmup consumption, and complete dividend/adjustment accounting were not independently certified here.
SPY and QQQ were selected because matching executed histories were retained; there was no optimizer or search for an attractive portfolio result. This pair applies one rule to two equity exposures, so it does not establish behavior for unrelated strategies, futures margins, short borrowing, or future losses. The small difference between the author blend and native account reflects different allocation and whole-share sizing; it is not evidence of a diversification edge.
Start with two instruments and explicit per-entry allocation in the multi-instrument strategy guide. Verify the chosen sizing variable’s meaning, then inspect returned cash, simultaneous holdings, any rejected orders, and the combined equity path before adding more symbols; the ETF trend-filter example supplies the individual-rule context, and position-sizing comparisons explain why allocation and loss budgets differ.
Put your strategy rules to the test
Build your strategy, inspect historical trades, and review the assumptions behind your results.
Build and test your strategy