Backtest and paper trading disagree? Check the first comparable decision
Find the earliest defensible difference in inputs, decisions, orders or fills—and recognize when a backtest and simulated session cannot yet be compared.
A backtest contains trades. Your paper bot contains fewer trades, different fills, or none at all. Comparing their final balances tells you that something differs; it does not tell you where the difference began.
Start with the first comparable decision. Confirm that both records cover the same market event with the same saved rules and relevant inputs. Then follow the decision through sizing, submission, acknowledgement and execution. Stop at the earliest stage where the evidence differs—or where one side has no evidence.
Our actual Stratifyre example stopped before that first paired decision. The historical backtest and built-in simulated session shared the same saved strategy version, but their observation windows did not overlap. That finding prevents a misleading explanation about slippage or missed entries.
Confirm that you are comparing the same event
A saved strategy name is a useful label. A saved version and its rule expressions are better comparison keys. Record the instrument and venue, entry and exit conditions, sizing expression, indicator parameters and starting exposure on both sides.
Next, match the observation window. A January backtest and an October paper session can test the same idea, but they cannot disagree about one January decision. For event reconciliation, retain the session’s actual interval and replay that interval only when matching historical data is available. Keep the original research backtest separately.
Finally, separate these clocks:
- Source time: when the bar or quote represents the market, including whether a candle timestamp identifies its opening or closing boundary.
- Availability time: when the bot could first use that information, including completed-candle and warmup requirements.
- Decision time: when the strategy evaluated the rule.
- Order time: when submission, acknowledgement, cancellation and fills occurred.
Normalize timestamp units and time zones before aligning them. A matching printed minute can hide a different candle boundary. QuantConnect’s reconciliation documentation identifies timestamp conventions, arriving data and indicator warmup as possible differences in its own environment; these are useful checks, not diagnoses of a Stratifyre session. QuantConnect reconciliation.
A real comparison that stopped at its inputs
We inspected an executed Binance BTC/USDT spot backtest and the retained simulated session used in our backtest-to-paper checklist. Both persisted the same rule arrays, strategy version and version hash:
- Enter a fixed 0.05 BTC market order when EMA20 crosses above EMA50 while flat.
- Flatten when EMA20 crosses below EMA50 while long.
- Start with $10,000.
The saved identity matched. The operating records did not:
| Check | Backtest | Simulated session |
|---|---|---|
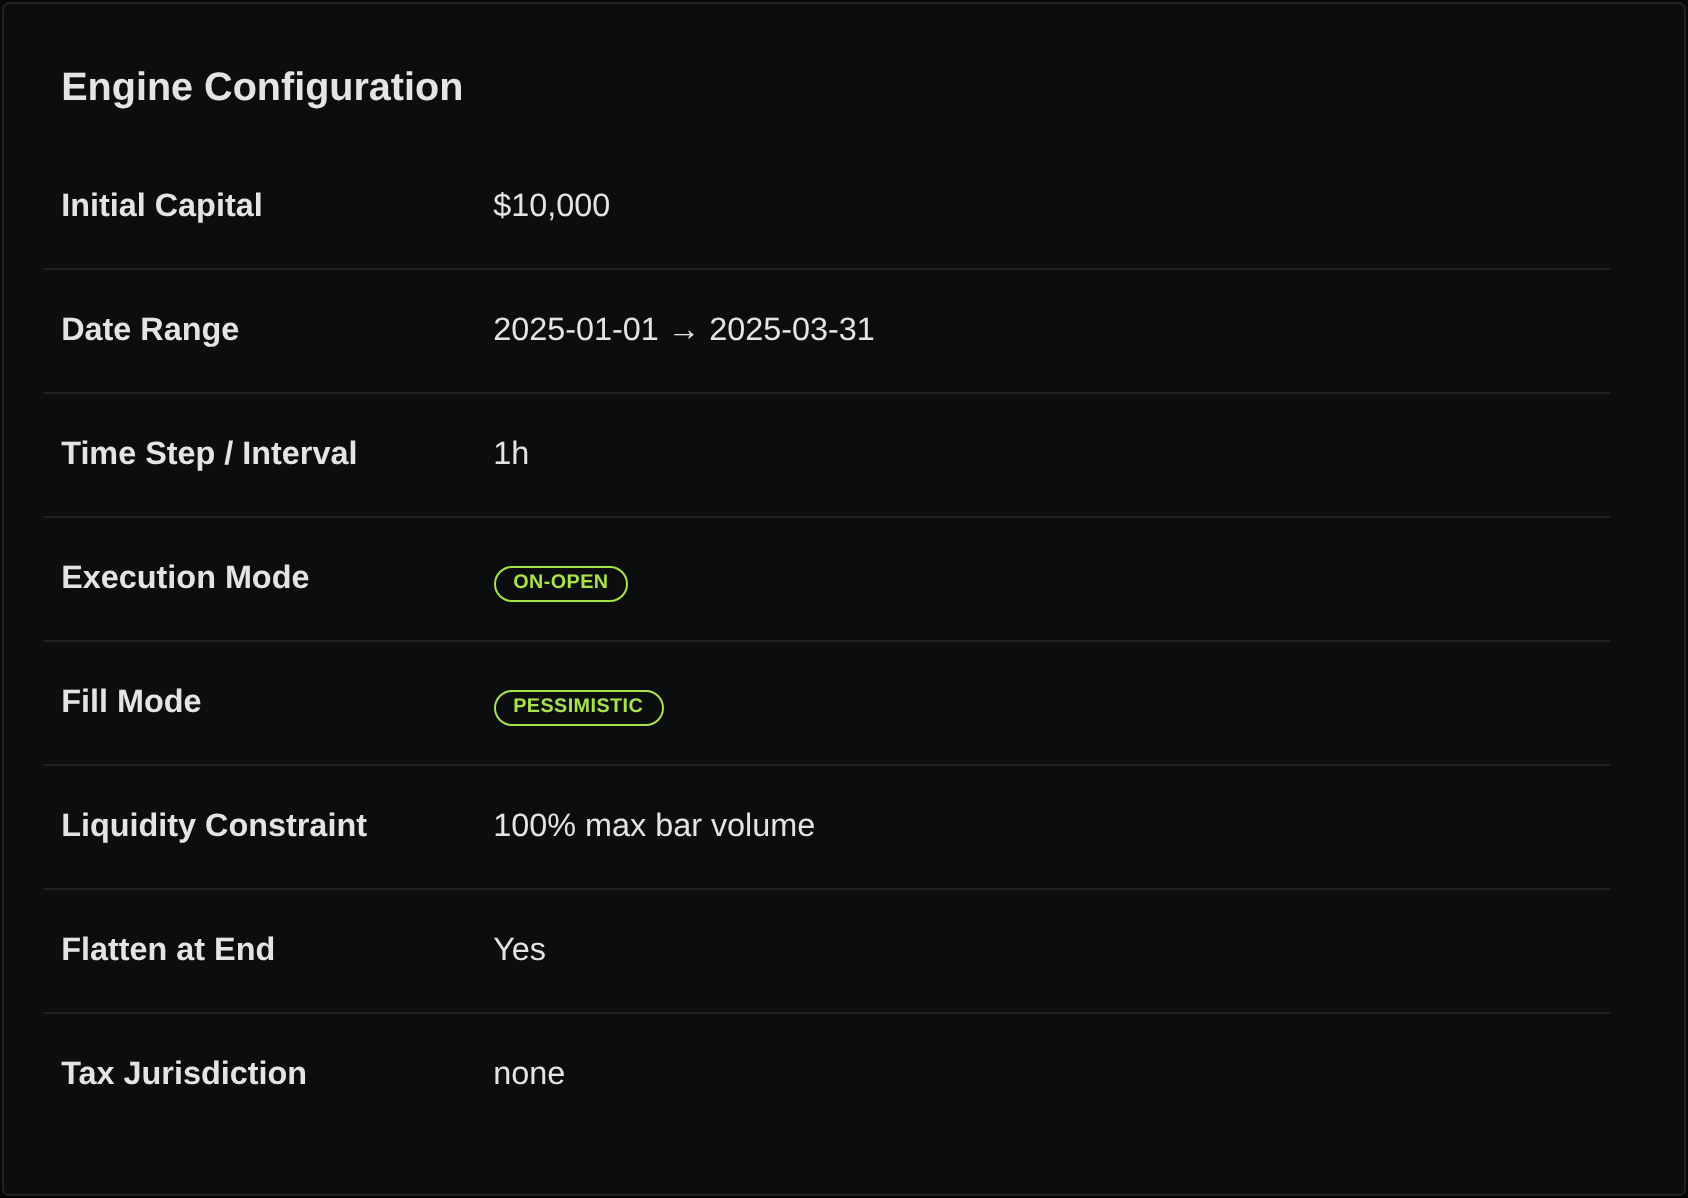
| Window | January–March 2025 | October 2, 2026; about 110 seconds |
| Evaluation setting | Hourly timestep | One-second runtime tick |
| Recorded trades | 24 | 0 |
| Recorded session events | Separate historical records | 0 |
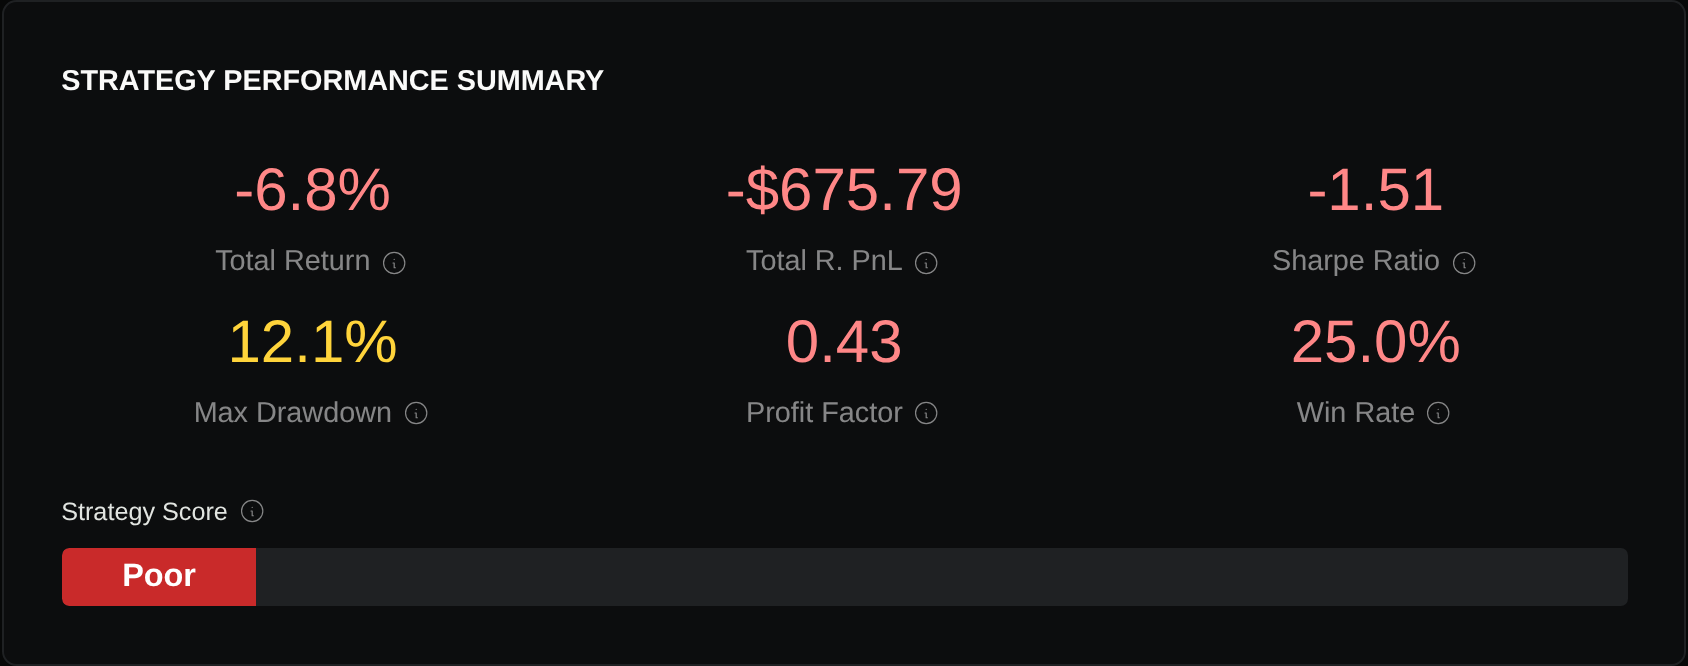
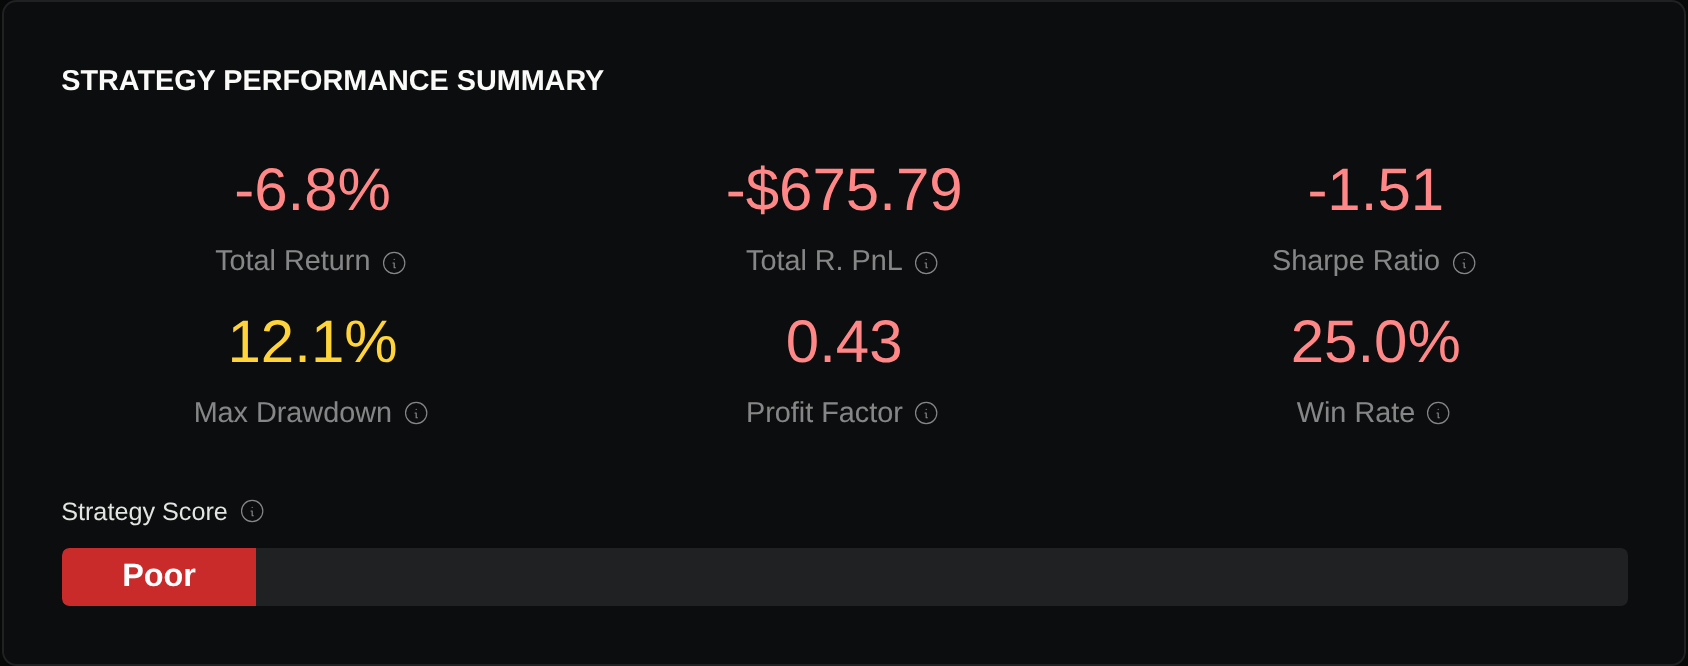
The backtest completed with 24 trades. Its report displays a $675.79 loss; that is a historical result. The earliest returned trade entered at 2025-01-11 22:00:00 UTC. There is no simultaneous session decision against which to compare that entry.
The session ran from 2026-10-02 23:23:17.702 UTC to 23:25:07.967 UTC. It recorded 104 runtime ticks, zero trades and zero events. Reinspection confirmed it remained stopped, with no open orders or positions and no active billing-resource entry for that session.
This was Stratifyre’s built-in Simulated mode. It was not an Alpaca paper account or a live broker session. The one-second setting describes the runtime loop’s frequency; it does not prove one-second input candles or a particular EMA update cadence. We did not retain the session’s evaluated indicator values or warmup input history.
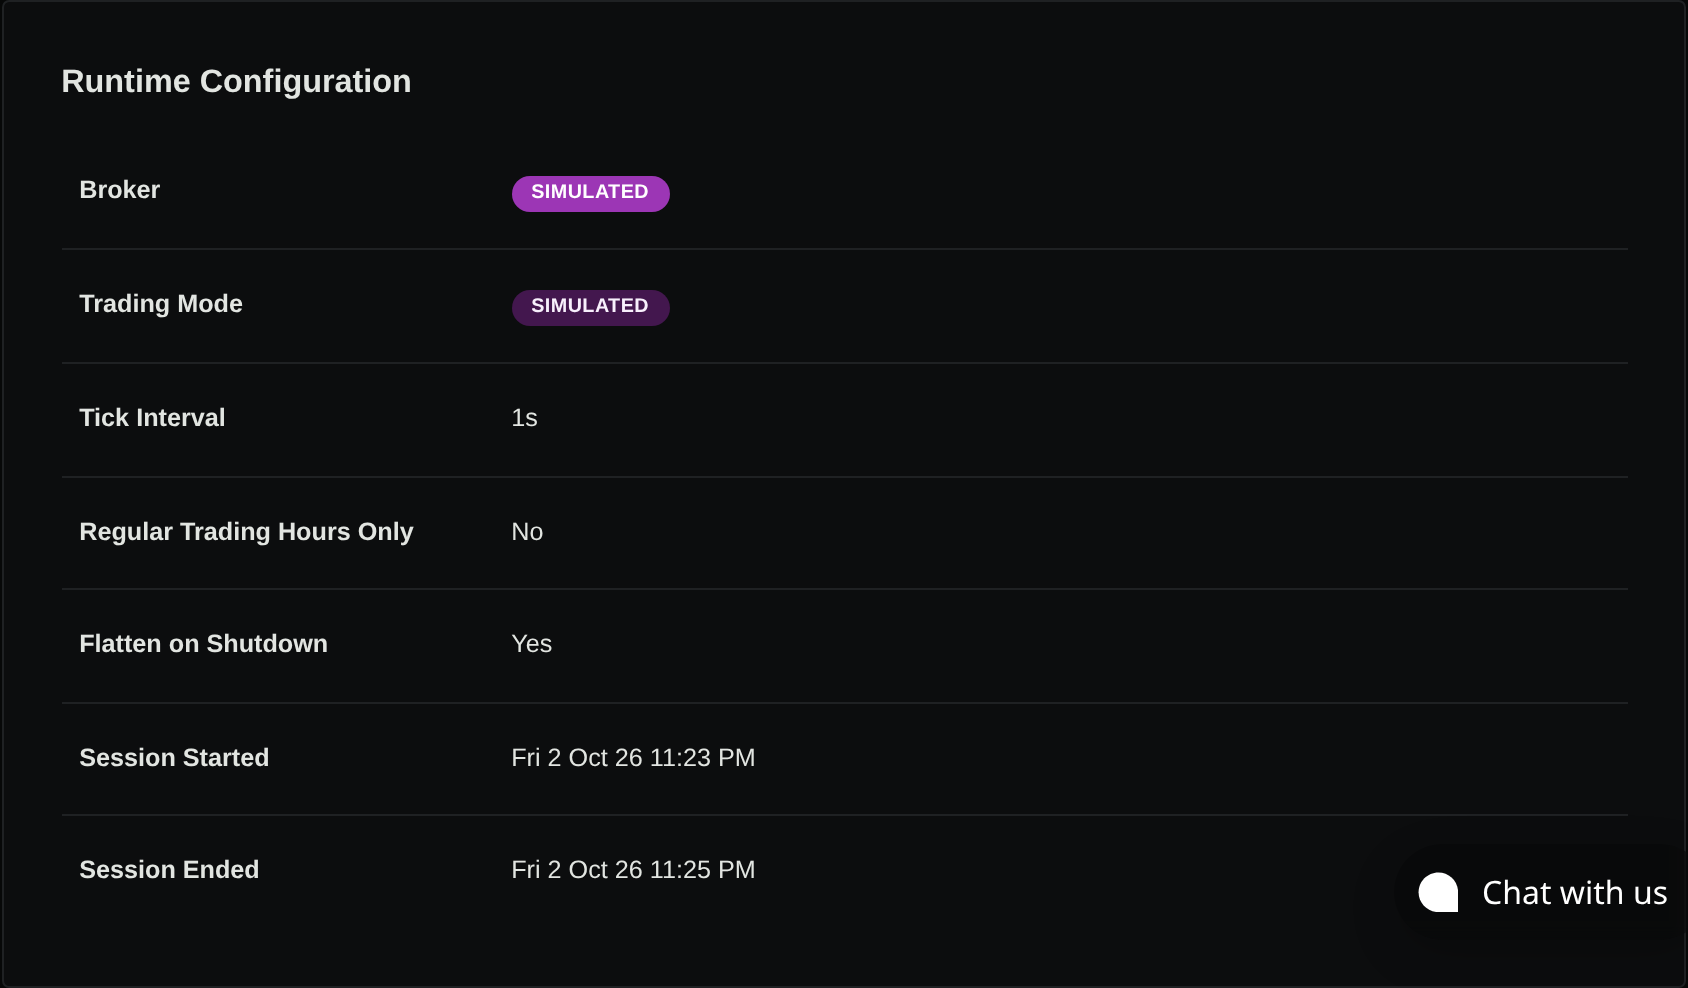
The observed finding is a failed comparison precondition: no common decision window. Different cadence and session controls are additional settings to reconcile. They are not explanations for an entry that nobody observed.
Build a ledger before choosing an explanation
Once you have common inputs and a common window, inspect records in time order. Keep one row per decision or lifecycle transition, with a stable decision or order reference. Include decisions to do nothing.
For each stage, retain both sides:
- Input: instrument, source timestamp, OHLCV or quote, candle interval, completion state and receipt time. If these differ, investigate data before interpreting the rule result.
- Decision: saved rule version, indicator values, previous state, evaluation time and true/false result. Matching prices with different indicator values calls for checking history and warmup.
- Permission and size: session eligibility, risk decision, available cash, existing exposure, pending orders and rounded quantity. A true entry condition can still produce no permitted order.
- Submission: order reference, type, side, quantity, time in force, submission time and acknowledgement. An uncertain timeout leaves submission unresolved until reconciled.
- Execution: status transitions, filled and remaining quantities, fill timestamps, prices and reported charges. Compare balances only after these records reconcile.
The earliest supported mismatch narrows the next investigation. For example, illustratively, equal signals and sizes followed by an acknowledged paper order with no fill point toward order execution. That example does not describe our zero-event session.

Investigate the earliest supported difference
If source candles differ, compare their venue, interval, completeness and revisions. If session eligibility differs, separate signal history, entry permission and fill hours using the regular-versus-extended-hours guide.
If both sides agree through submission but fills differ, inspect when each order became eligible to fill and what price information was available. The one-second versus one-minute fill guide explains why finer candles and different evaluation settings are separate variables.
If quantities and fills match but cash differs, reconcile charges against the recorded fills before changing a modeled cost. Use the slippage stress-test method for sensitivity analysis after identifying the discrepancy.
Broker paper execution also has provider-specific limits. Alpaca, for example, says its paper simulator omits market impact, latency slippage and order queue position. Even an explained paper fill does not establish the corresponding live fill. Alpaca paper-trading assumptions.
Keep the diagnostic conclusion precise: first different input, first different decision, first different order transition, or insufficient matching records. Preserve the preceding matching records and any missing evidence. Change one identified assumption, then check the same event again; a better final return alone does not verify the explanation.
For your next comparison, use the paper-trading setup guide to verify the environment, freeze the strategy and define a bounded observation window. Save the decision inputs and order records that window produces. Our retained example establishes why that matching record is necessary; a paired signal-and-fill comparison still needs to be performed.
Put your strategy rules to the test
Build your strategy, inspect historical trades, and review the assumptions behind your results.
Build and test your strategy