Monte Carlo drawdown: what changing trade order tells you
Shuffle an executed trade list to inspect losing streaks and drawdown, compare bootstrap methods, and separate conditional scenarios from forecasts.
A profitable backtest can have an uncomfortable route to its final balance. Several losses arriving together create a different experience from the same losses interrupted by winners. A Monte Carlo drawdown analysis lets you inspect that sequence sensitivity—but its answer depends on exactly what you randomize.
Start with one narrow question: if these recorded dollar outcomes arrived in another order, how would the longest losing streak and peak-to-trough decline change? Shuffling answers that question without changing the total. Sampling trades with replacement asks a different question because some winners and losses repeat while others disappear.
Start with an executed trade list
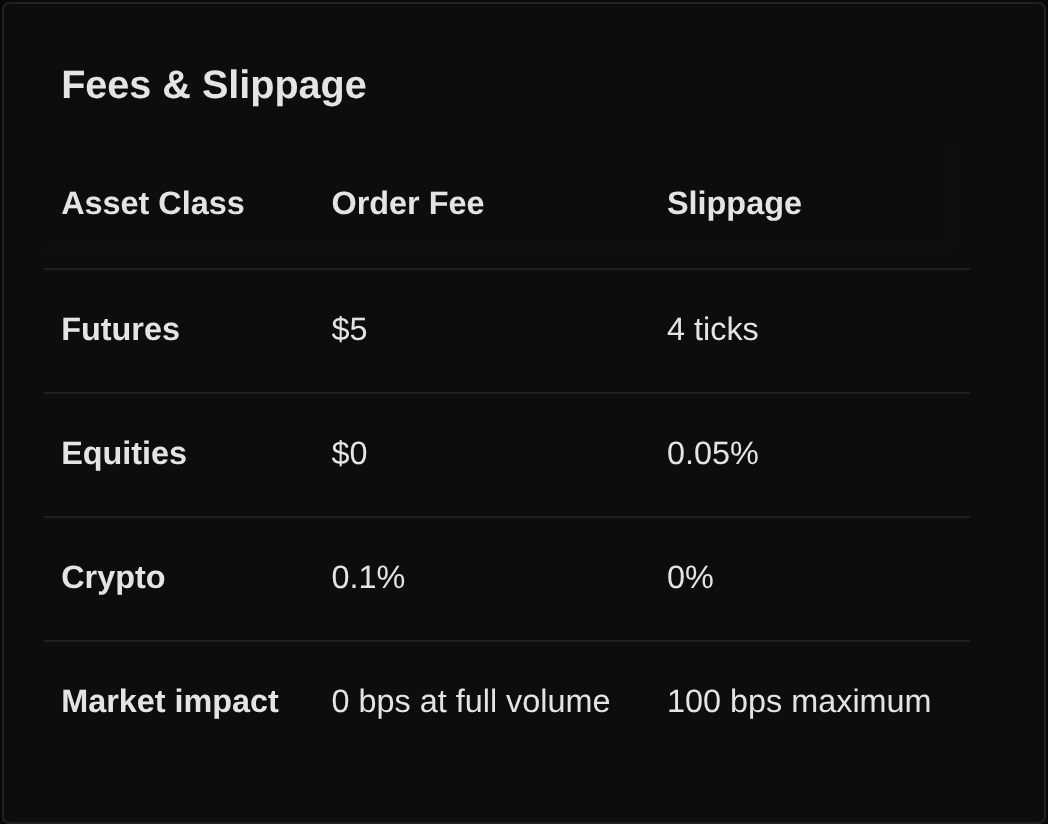
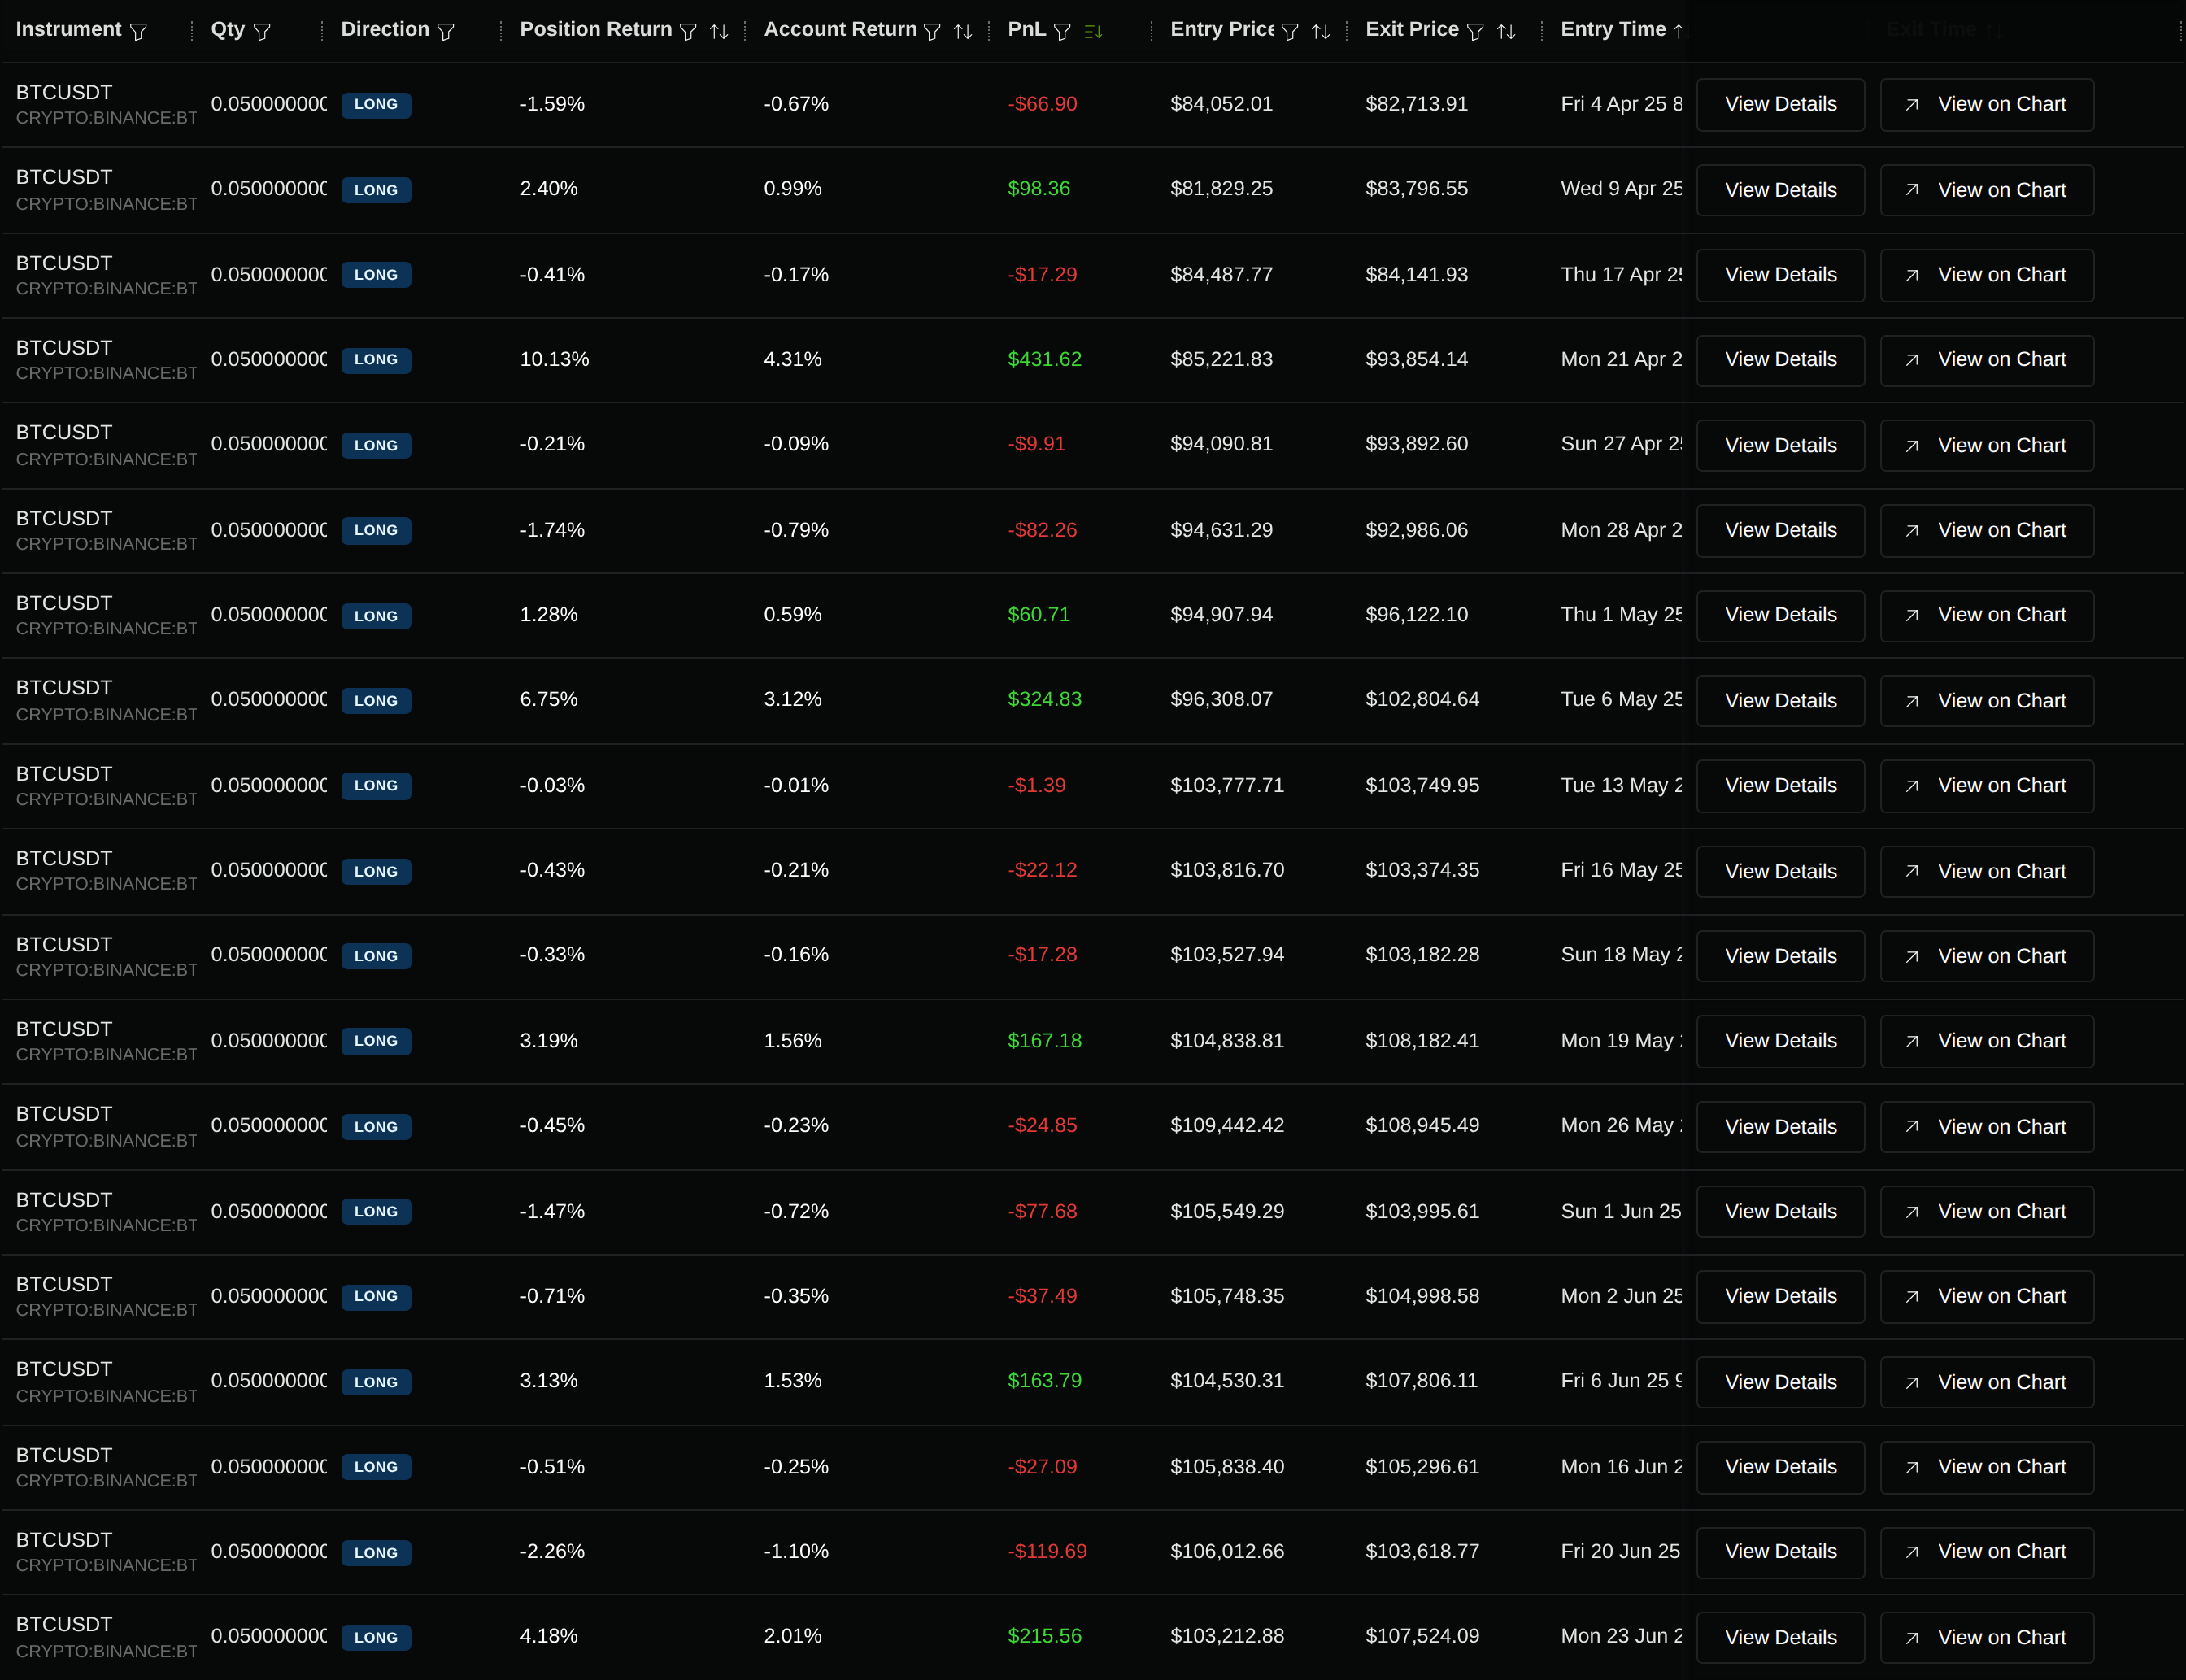
This example reuses a completed Stratifyre demo backtest of Binance BTC/USDT, April 1–June 30, 2025. Hourly EMA(20) crossing above EMA(50) buys 0.05 BTC while flat; the downward cross closes the holding. Saved settings use $10,000 initial capital, on-open execution, pessimistic fills, 0.05% configured slippage, long-only trading, and final flattening.
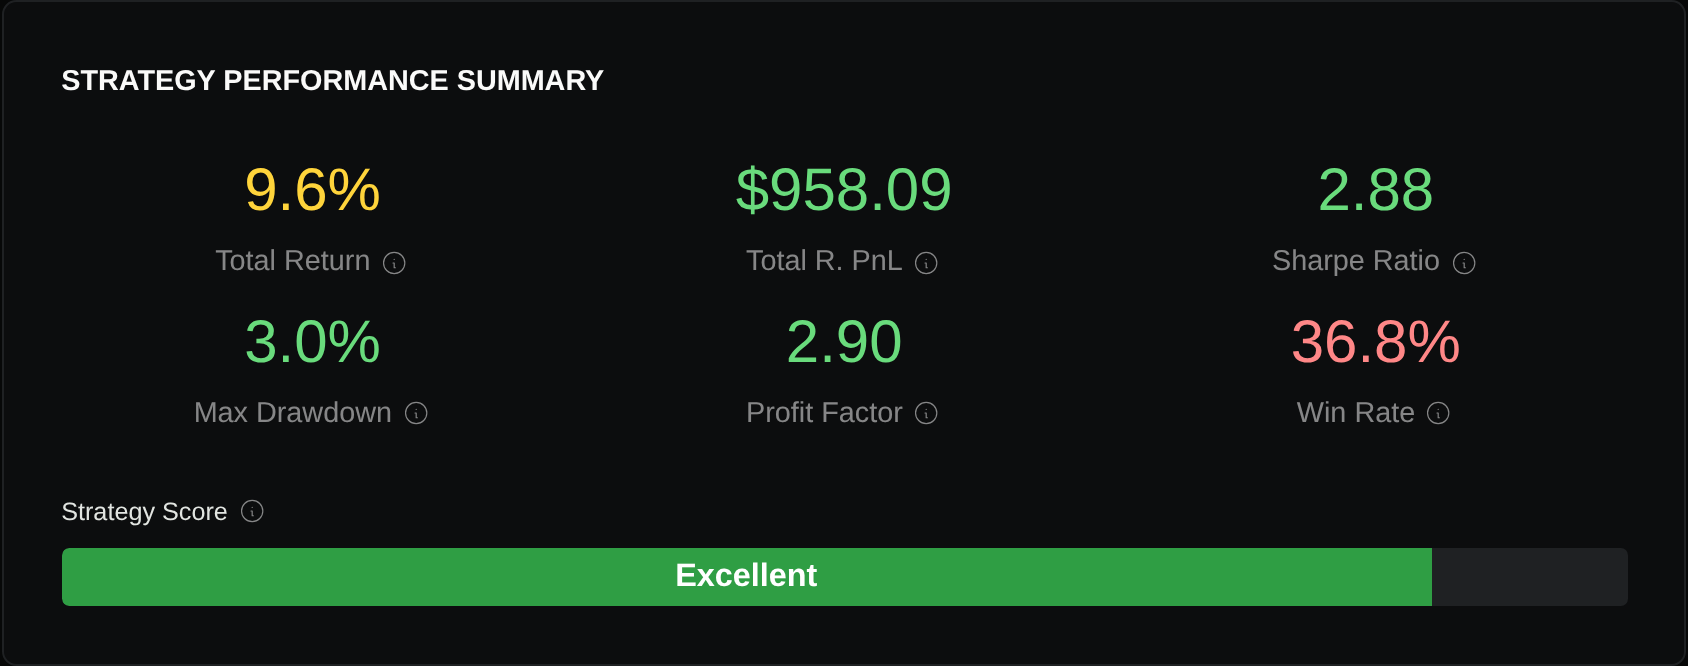
The 19 recorded trades contain seven winners and twelve losses. Their reported P&L sums to +$958.09. The source is deliberately small: it illustrates a method and does not establish a repeatable trading edge.
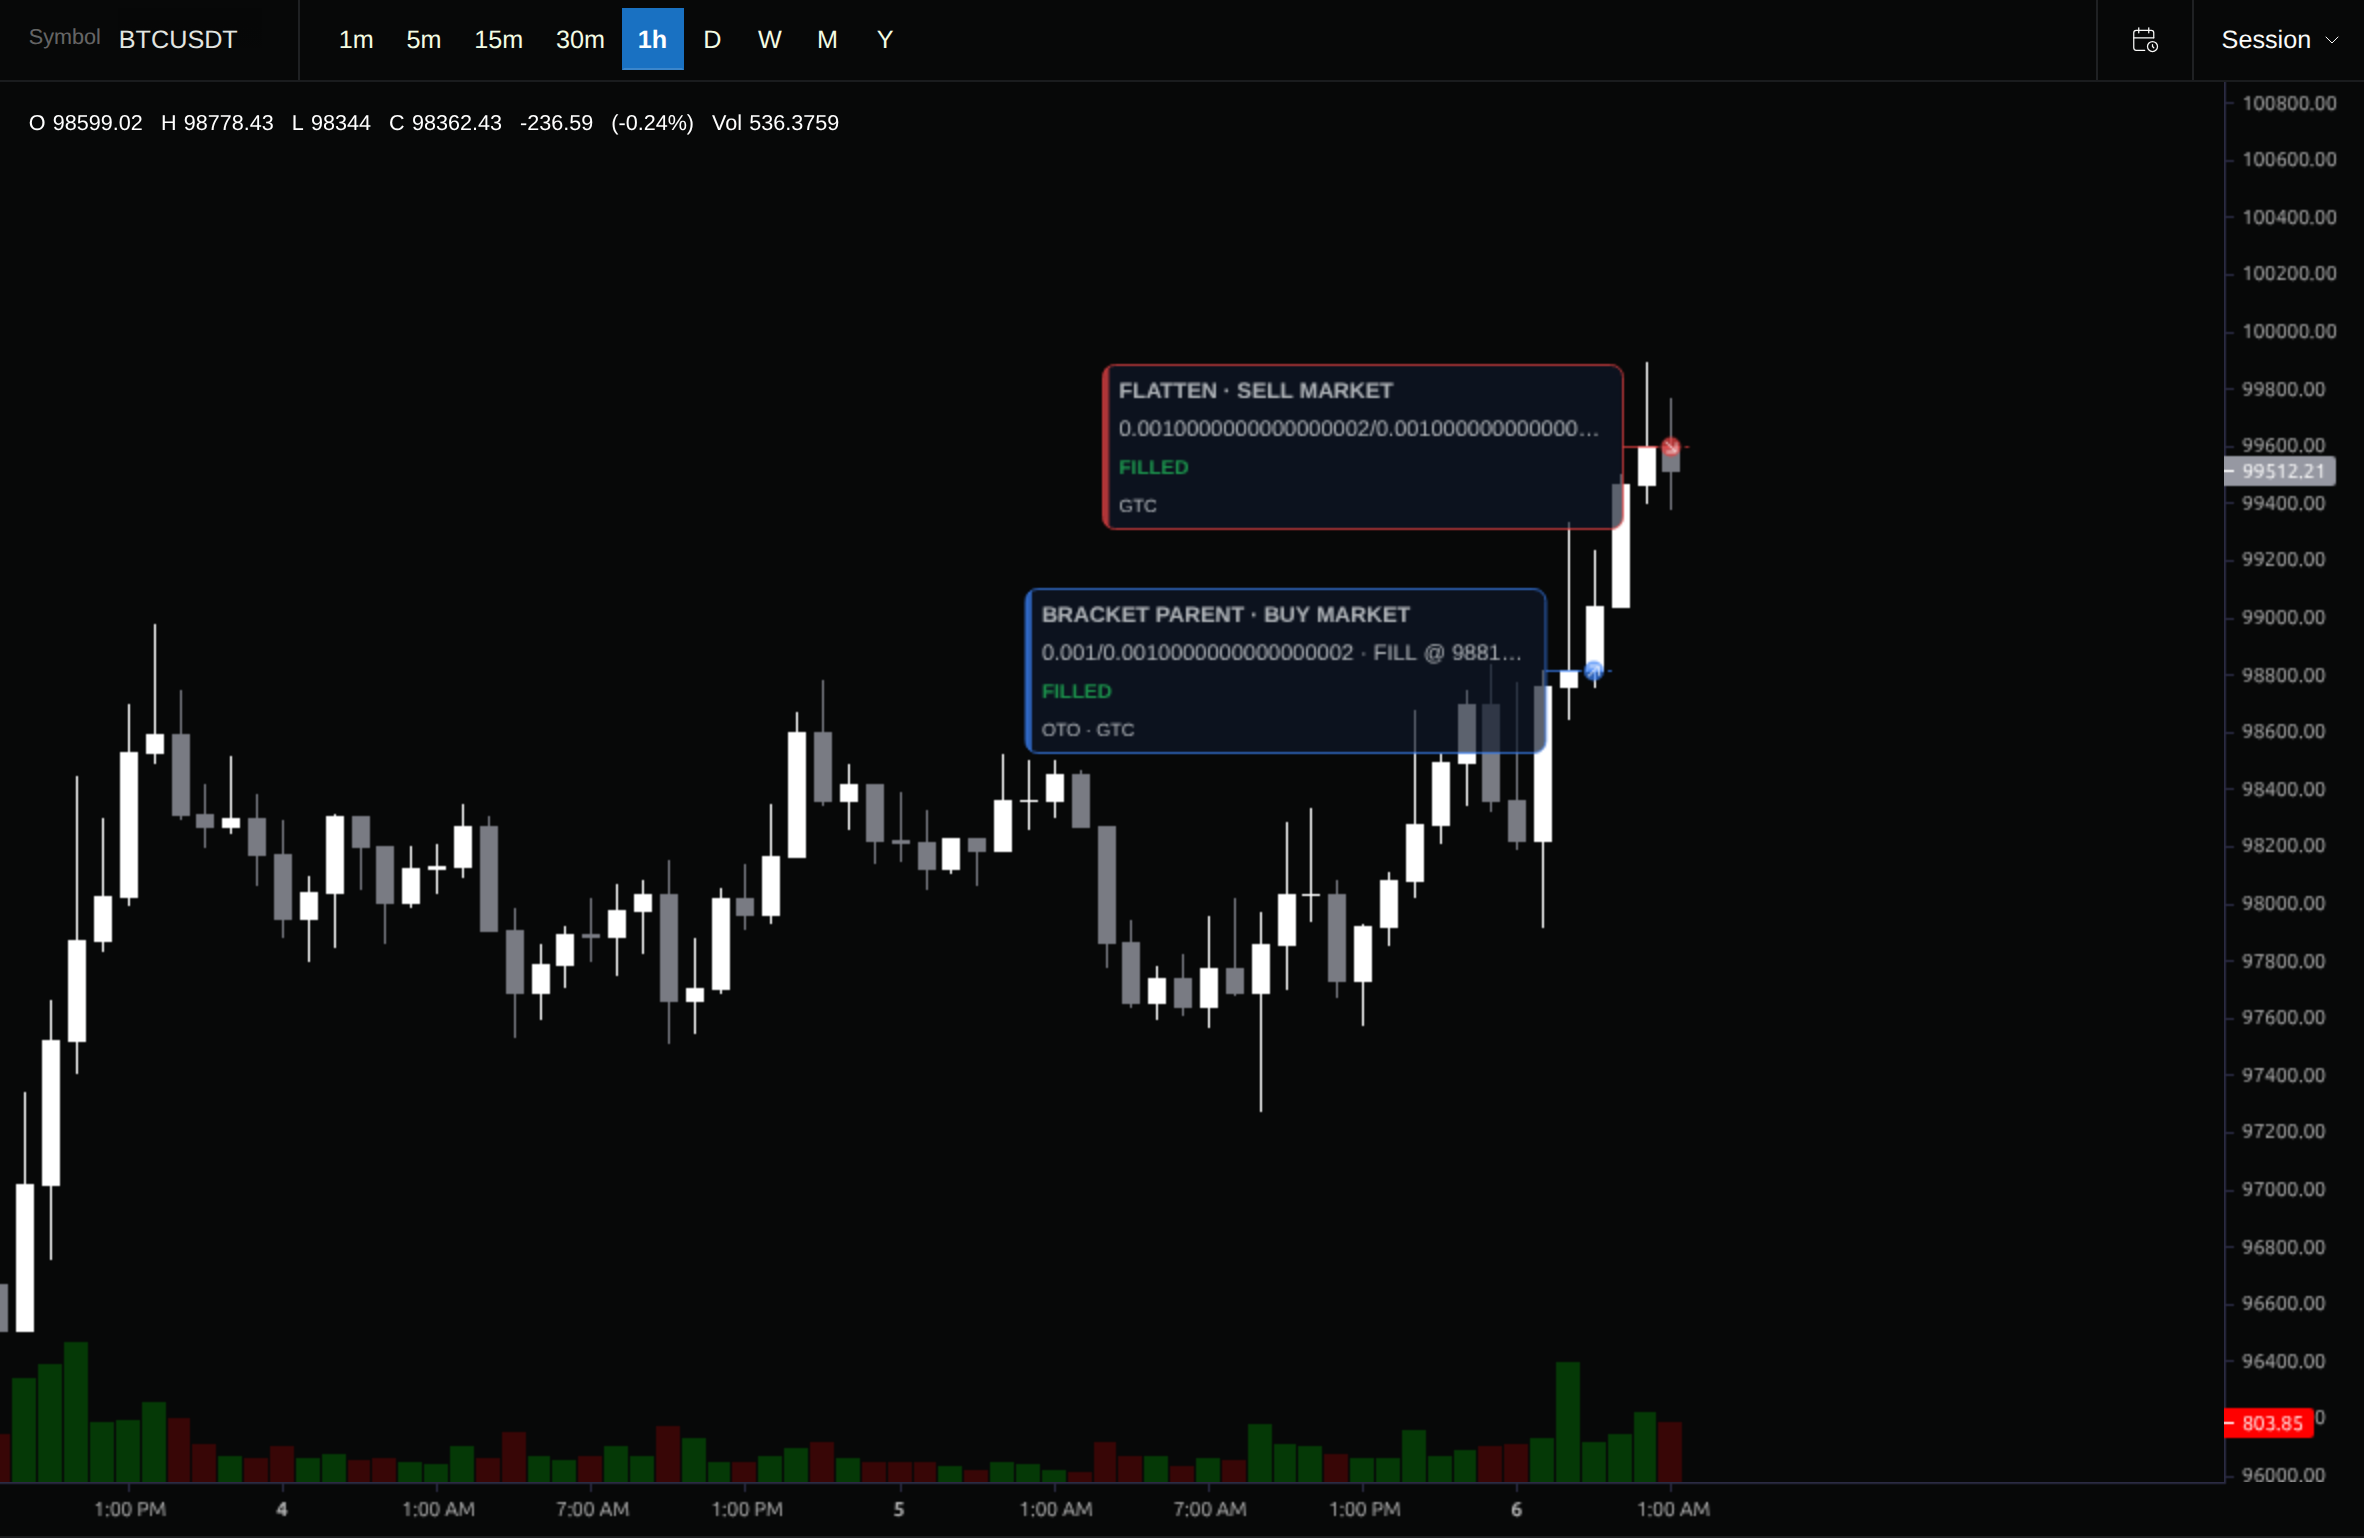
Two limitations carry through the analysis. The saved 0.10% crypto commission returned zero trade fees, so these are reported outcomes rather than verified after-commission results. The source run also retains a replay signal/fill disagreement. Rearranging its rows cannot validate the original fills or repair their costs.
Inspect the actual source trade list
Separate shuffle, bootstrap, and parameter search
| Method | What changes? | What stays fixed in this worksheet? |
|---|---|---|
| Shuffle | Trade order, without replacement | Every recorded P&L appears exactly once; total remains +$958.09 |
| Independent bootstrap | Draw 19 trades with replacement | Source pool and path length; individual trade counts and total can change |
| Block bootstrap | Draw consecutive groups with replacement | Local order inside each selected group; joins and total can change |
| Parameter perturbation | Change strategy inputs and rerun market history | Whatever execution/data settings the new backtests retain |
The standard bootstrap samples from observed data with replacement, as described in SciPy’s bootstrap documentation. Independent trade sampling discards the original chronological dependence: a losing episode becomes isolated rows that can land anywhere.
Blocks retain adjacency within each group. There are different block methods: the arch documentation distinguishes fixed circular blocks, fixed moving blocks, and variable-length stationary blocks. Block length and boundary behavior are assumptions you must record.
Parameter optimization is another task. Changing EMA lengths generates different signals and trades; selecting the strongest candidate is not evidence about rearranging the original trade list. See the existing grid versus random parameter-search example for that distinction.
Define the equity and streak calculations first
The following results are author-created analysis of actual reported trades, not a native Monte Carlo result. Starting from $10,000, the worksheet adds each dollar P&L at a virtual trade close. It keeps the original dollar amounts fixed, with no compounding, resizing, added costs, overlapping positions, or new fill simulation.
At each close:
Closed-trade drawdown
Equity = $10,000 + cumulative recorded P&L
Peak = highest worksheet equity reached, including the starting account
Drawdown (%) = (peak − current equity) ÷ peak × 100
Maximum drawdown = largest percentage decline along that path
A losing streak counts consecutive negative P&L rows. A nonnegative row breaks it. In chronological exit order, this source has a longest losing streak of three and closed-trade maximum drawdown of 1.35%; its maximum dollar decline is $146.78.
The native account report gives 3.0061% drawdown. A sequence reconstructed only at trade closes omits the movement while a position is open. The worksheet therefore cannot substitute for account equity, margin monitoring, or an intraday loss-limit check; the two drawdown figures are not competing measurements of the same path.
Compare the prespecified paths
Before resampling, we fixed 60 paths per method, 19 trades per path, and three seeds: 20261002 for shuffle, 20261003 for independent bootstrap, and 20261004 for circular blocks of three trades. The 180 paths retain every outcome, including losses.
For circular blocks, a sampled start copies three consecutive rows, wrapping from the end to the beginning when necessary. Seven blocks concatenate into a path truncated to 19 rows. That wrap and the joins are artificial. Three is a teaching choice, not a validated dependence estimate.
The median and 90th percentile use nearest-rank positions: the 30th and 54th sorted observations among 60. They describe these sampled paths; they are not confidence limits or future-risk estimates.
Same source trades, different drawdown paths
Author analysis · 60 paths per method · fixed dollar outcomes
View example data
| Method | Median (%) | 90th percentile (%) | Largest sampled (%) |
|---|---|---|---|
| Shuffle | 2.1552282086 | 3.1085930392 | 4.1848804906 |
| Independent bootstrap | 2.1013874125 | 3.9379793125 | 6.2336348600 |
| Circular blocks of 3 | 1.8455009709 | 2.5971321975 | 3.1900720849 |
| Path family | Median longest loss streak | 90th percentile streak | Largest sampled streak | Sampled total P&L range |
|---|---|---|---|---|
| Original chronology | 3 | — | — | +$958.09 |
| Shuffle | 5 | 6 | 8 | +$958.09 to +$958.09 |
| Independent bootstrap | 5 | 8 | 13 | −$159.42 to +$2,408.64 |
| Circular blocks of 3 | 4 | 7 | 9 | −$5.29 to +$1,769.64 |
Shuffle changes the experience without changing the final dollars: its median longest streak increases from the original three losses to five. Bootstrap additionally changes the mix of outcomes, which explains why its paths can finish below the starting account even though the original total is positive.
The block sample’s drawdowns happen to be smaller here. That does not make blocks a safer model. Different assumptions, seeds, and this short source sample produce different distributions; choosing the smallest drawdown after comparing methods would bias the interpretation.
For reproducibility, download the exact recorded input, standard-library Python calculation, and all 180 paths and results. The calculation uses seeded Python random.Random and decimal arithmetic, without intermediate rounding.
python3 resample.py --input recorded-source.json --output reproduced.jsonUse the product mode that matches your question
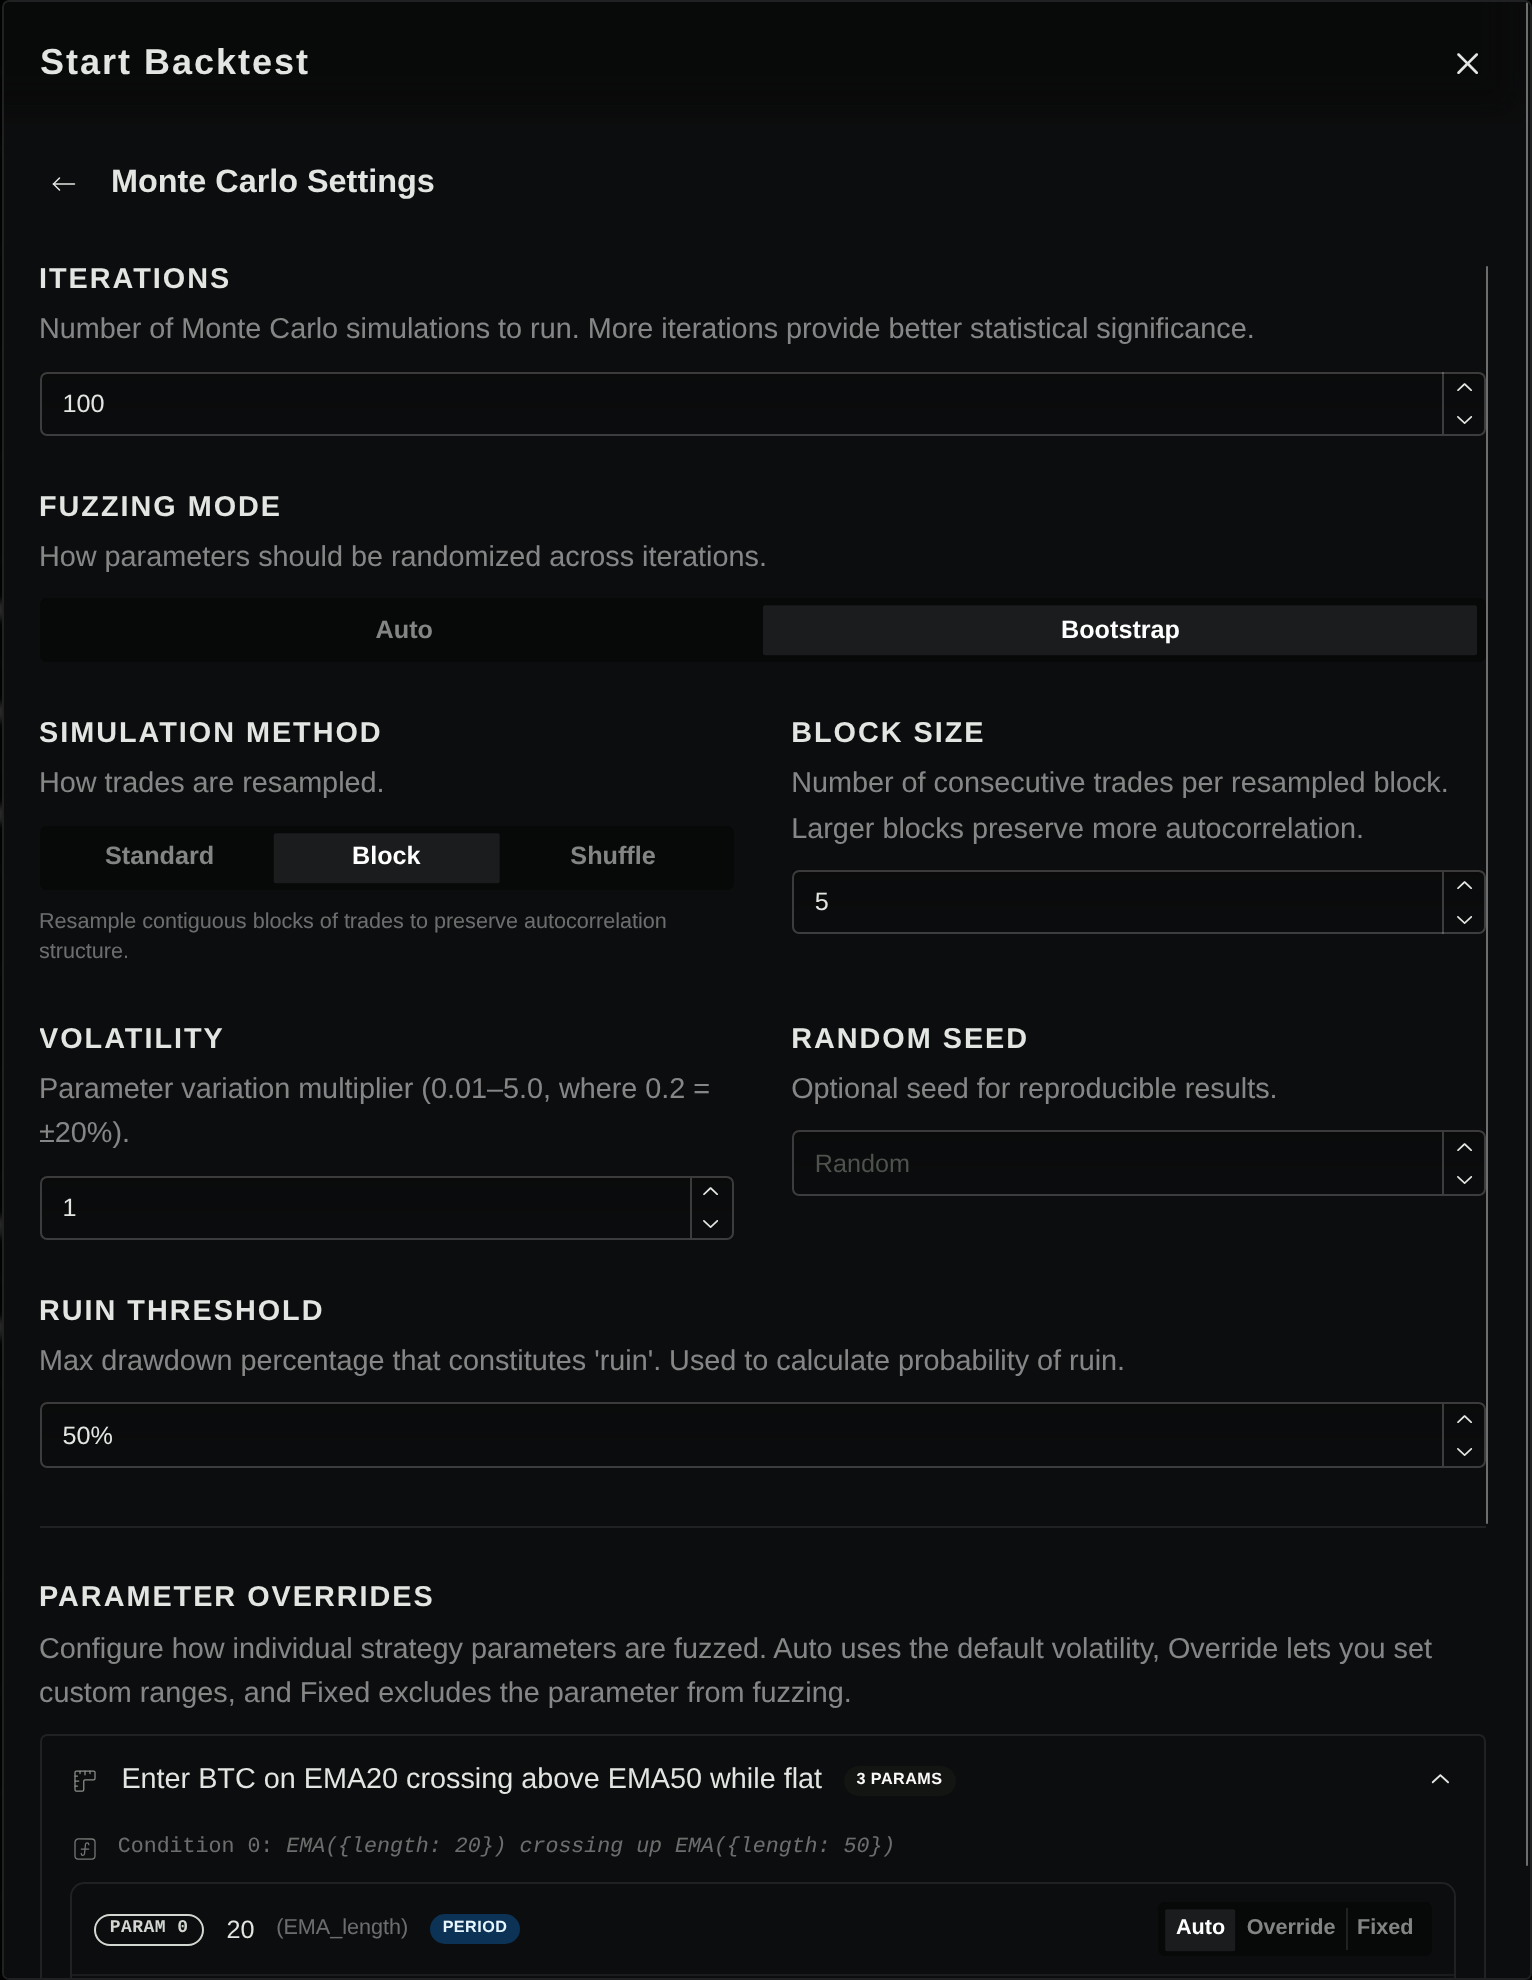
The actual demo settings expose Auto and Bootstrap modes. Bootstrap offers Standard, Block, and Shuffle; Block exposes a size control, and a random seed can be entered. Auto varies strategy parameters. These controls were inspected without submitting a new job. Stratifyre’s Monte Carlo controls guide
Inspect the native resampling controls
More repetitions can reduce sampling noise under a fixed model, but they cannot add unseen crashes, repair missing fees, or make dependent trades independent. Nineteen trades from one historical window cannot establish the rate of future losing streaks. Fixed-dollar outcomes also cease to describe your account if sizing compounds or depends on available equity.
Before using any resampling result for a sizing decision, reconcile costs and fills, inspect open-position equity, and test frozen rules on a genuinely unused period. Open the Monte Carlo guide and choose Shuffle for your first order-only comparison, keeping its assumptions beside the source trade list.
Put your strategy rules to the test
Build your strategy, inspect historical trades, and review the assumptions behind your results.
Build and test your strategy