No-code backtesting software: test your rules before choosing
Compare documented workflows in Stratifyre, TrendSpider, Composer, and TradingView, then use a saved-rule and trade audit to evaluate your own strategy.
Choose no-code backtesting software by taking one strategy through saved rules, execution settings, a completed report, and an individual trade. A builder that recognizes your indicators still needs to express when you enter, whether you already hold a position, how much you buy, and what ends the trade.
This guide compares current official documentation for Stratifyre, TrendSpider, Composer, and TradingView. The hands-on evidence is one real completed Stratifyre demo backtest, inspected again on October 3, 2026. We did not execute the strategy on the other platforms, measure their speed, or compare their returns.
Write an acceptance test for your strategy
Before opening a trial, reduce your idea to a small specification. Use your intended market and holding period. An allocation strategy that switches ETFs once a month asks different questions from an intraday setup with a stop and a limit entry.
Our inspection example uses Binance BTC/USDT spot, hourly bars, and two moving averages. It is deliberately simple enough to read back without guessing what the builder meant.
- Entry eventEMA(20) crosses above EMA(50). A cross is a transition; remaining above the slow average is a different condition.
- Position stateEnter only while open quantity equals zero. Buy a fixed 0.05 BTC with a market order.
- Exit eventEMA(20) crosses below EMA(50), with positive open quantity. Flatten the position.
- Execution assumptionsRecord evaluation and fill timing, starting capital, test dates, costs, and the treatment of an open position at the end.
For your own test, add the requirement most likely to break a generic builder: a completed higher-timeframe candle, one entry per session, a trailing exit, or a fixed risk budget. Ask to see the saved representation of that requirement. Simplifying it away changes the strategy you are evaluating.
Compare the documented workflow
The table describes authoring and inspection paths, not a ranking. Competitor entries are documentation-based; availability for your instruments, account, and intended dates still needs a trial.
| Platform | Authoring path supported by the evidence | Inspection path | Requirement to test first |
|---|---|---|---|
| Stratifyre | The observed saved builder separates conditions from actions, including crossing operators and open-position quantity. | This executed demo exposes saved configuration, summary metrics, and individual completed trades. | Can you reconcile a trade with its rule state and charged costs? The example below has unresolved discrepancies. |
| TrendSpider | Its Strategy Tester guide documents visual entry/exit conditions, direction, timeframe, depth, extended-hours settings, and trade cost. | Official guides describe chart entry/exit arrows and downloadable backtest data. | The creation guide specifies a single tester timeframe; verify your intended timeframe logic in the current tester. |
| Composer | Its Symphony Editor documents assets, weights, if/else conditions, Any/All logic, and filters. | Its tutorial shows benchmarks, metrics, and historical allocations. | Does your idea describe target holdings and rebalancing, or require intraday order events? Its stock/ETF backtest documentation uses daily adjusted closing prices. |
| TradingView | Built-in and community strategies can be applied without writing a script; custom strategy authoring uses Pine Script. | Strategies show chart trades and Strategy Tester results; the broker emulator models fills and costs. | Does an existing strategy implement your exact rules, and can you inspect its source or obtain a clear explanation? |
Sources: Stratifyre backtesting; TrendSpider’s creation guide, result visualization, and data export; Composer’s Symphony tutorial and backtest assumptions; TradingView’s strategy introduction and broker emulator.
A useful distinction is the object you are building. Composer’s documented blocks describe holdings and allocations; its threshold-trading guide also describes rebalancing when weights drift. TrendSpider describes technical entry and exit conditions. TradingView can be convenient for using an existing strategy, but changing a protected script’s inputs does not expose its internal logic: community scripts may be open-source, protected, or invite-only.
For broader workflow comparisons, the existing TradingView, QuantConnect, MultiCharts, and Backtrader pages cover other development paths. Keep this trial focused on the strategy you actually want to express.
Inspect what the builder saved
In the retained Stratifyre example, the entry contains both the upward cross and position.open_qty = 0, joined by AND. The action is a 0.05 BTC market buy. The saved exit contains the downward cross and position.open_qty > 0, followed by Flatten. Current readback confirmed that the strategy rules and the completed job’s rules match the retained specification.
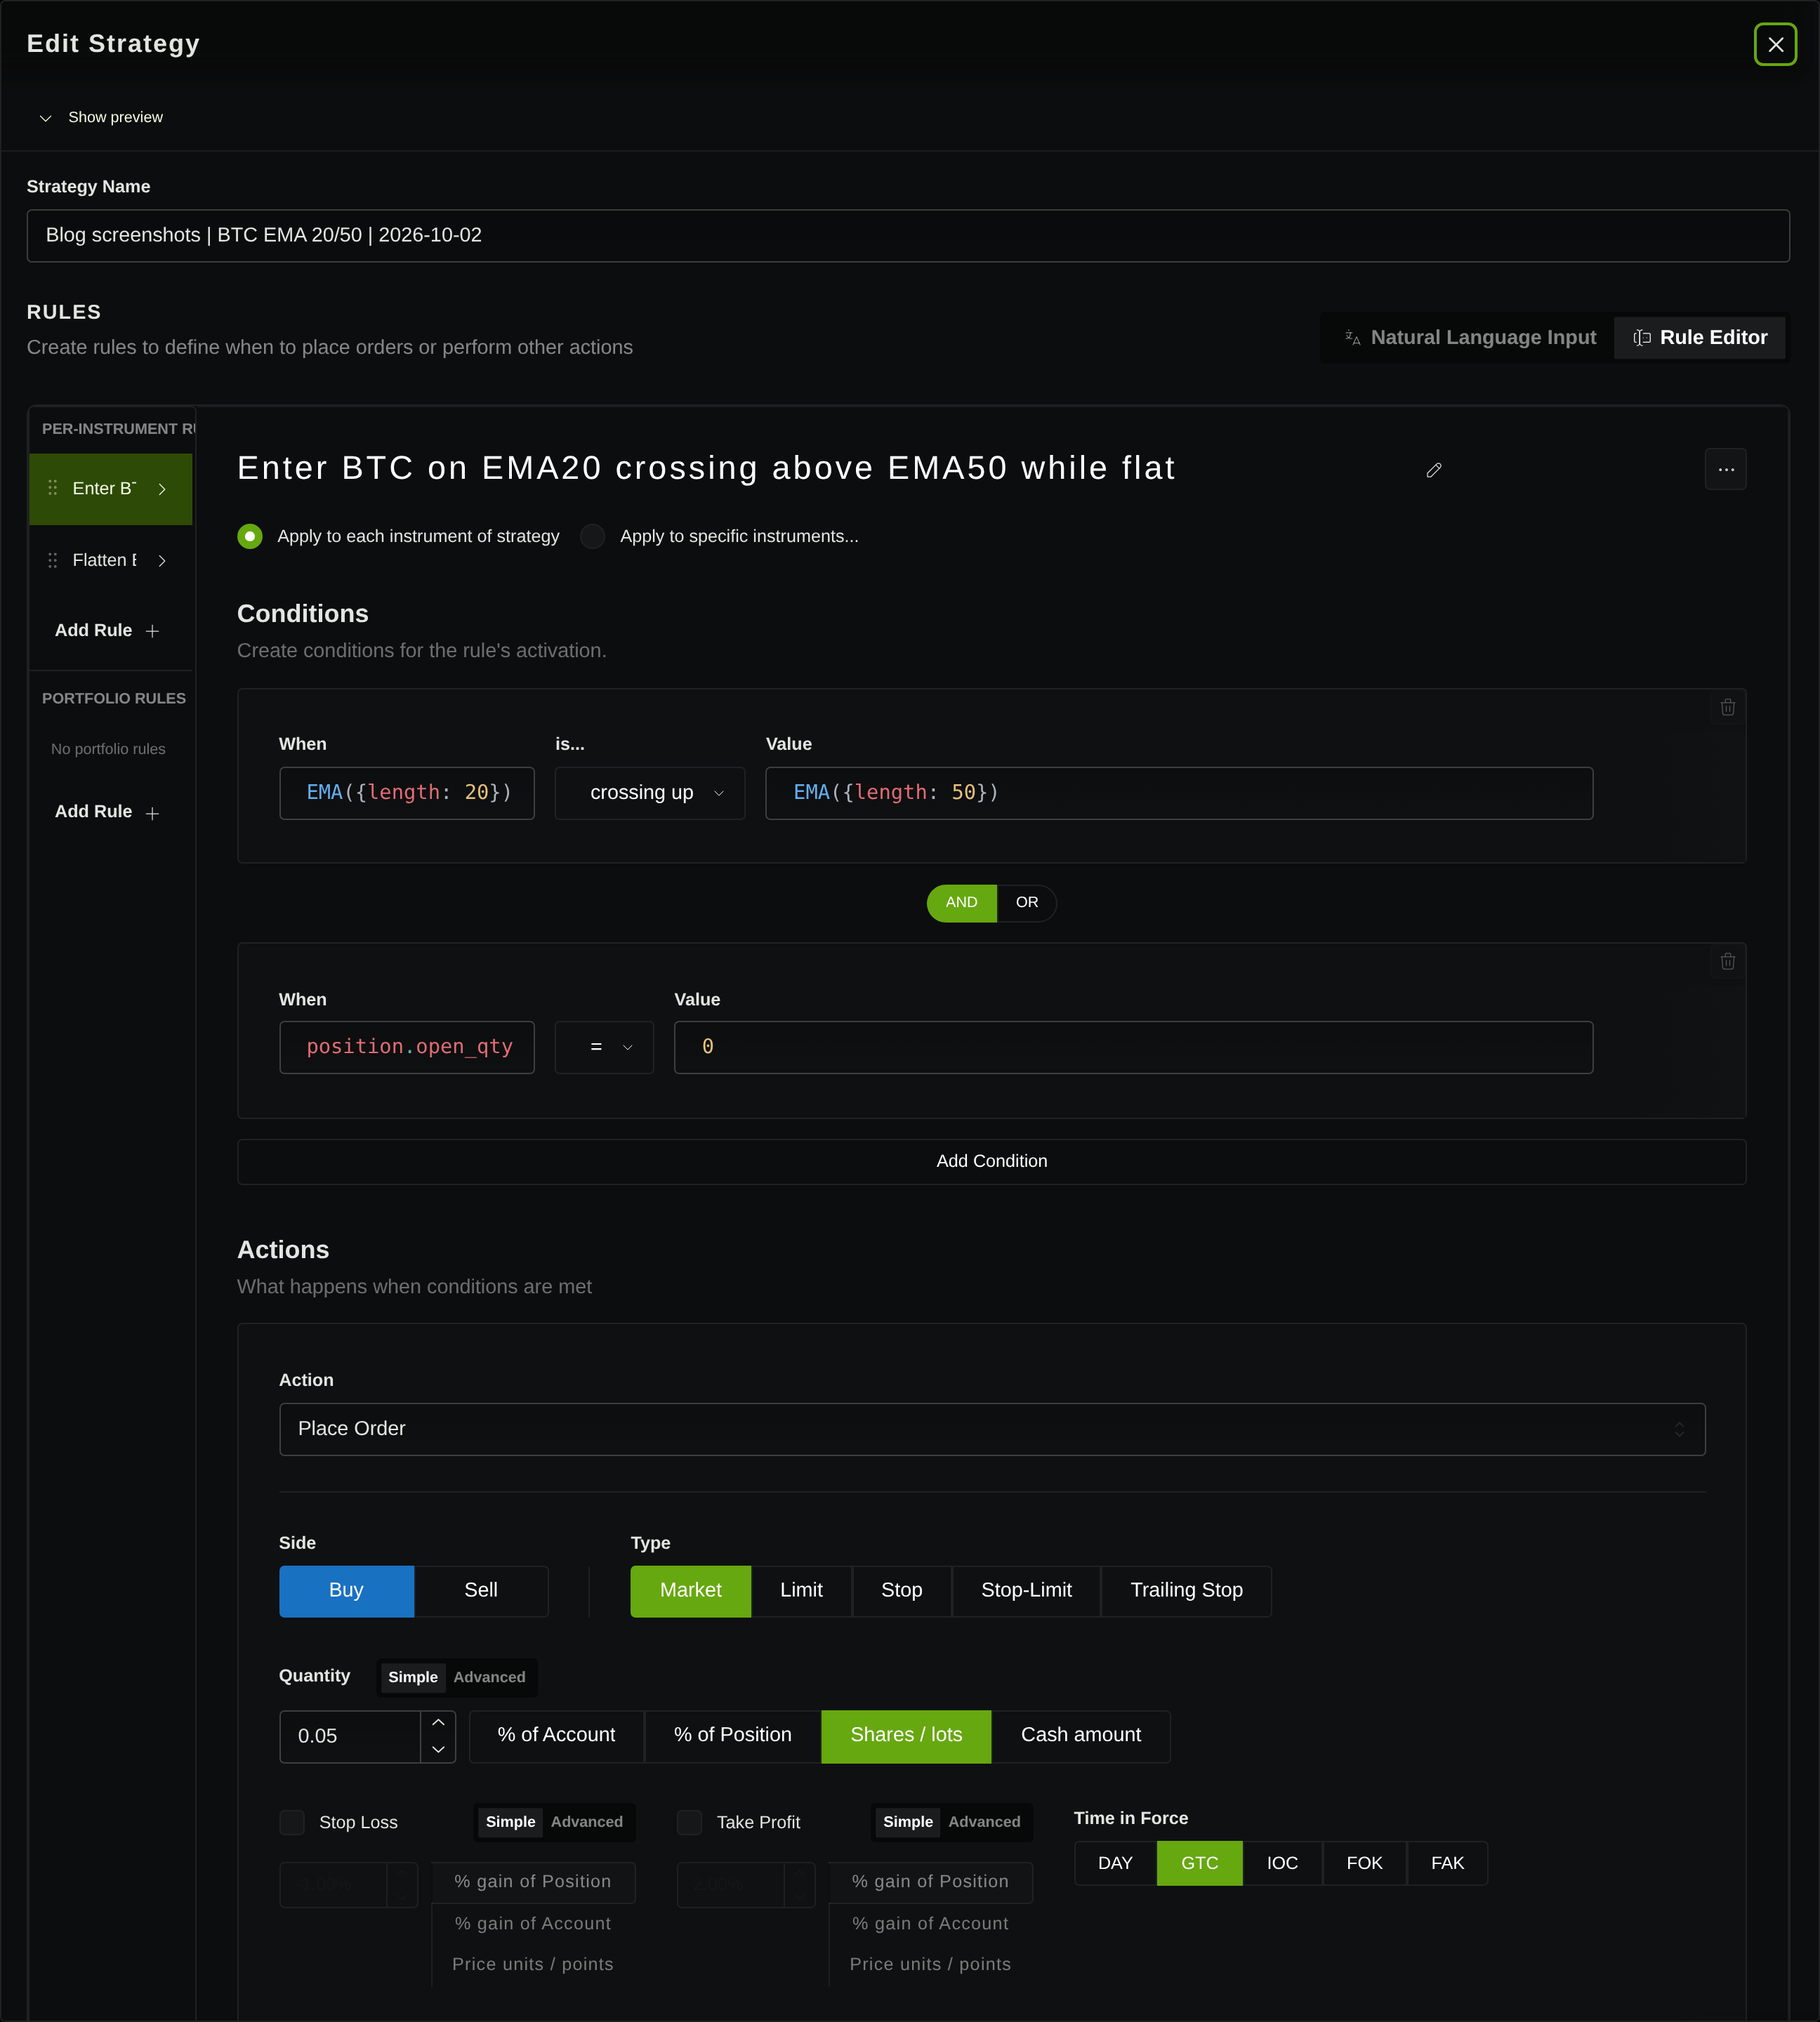
This is the first acceptance check: the saved strategy must agree with your written specification. Inspect the quantity and order type as well as the indicator names. For natural-language workflows, review the resulting rules before accepting the interpretation.
Read a completed result, then one losing trade
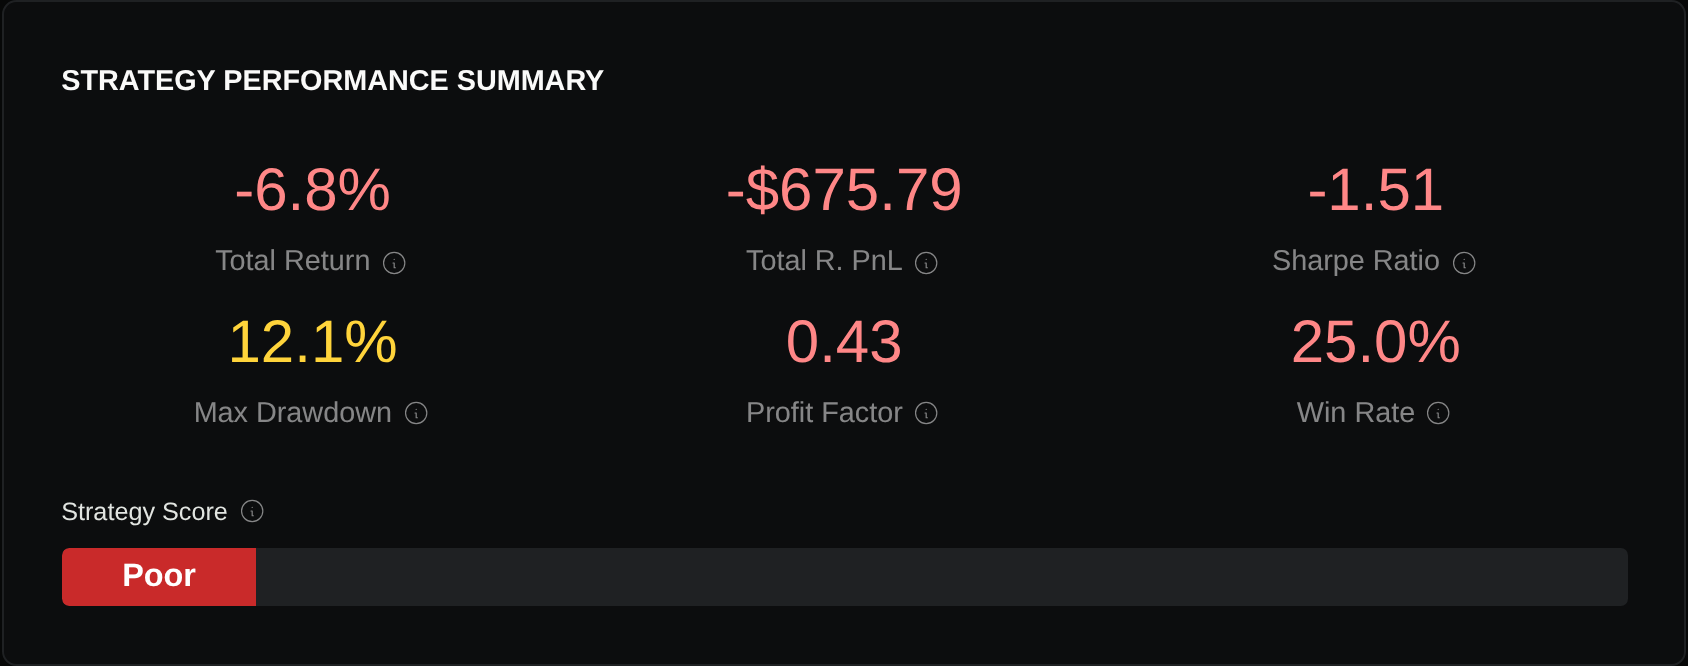
The retained run covers January 1–March 31, 2025, with $10,000 starting capital, hourly evaluation, the saved on-open execution setting, pessimistic fills, and flatten-at-end enabled. It returned 24 trades: six positive and eighteen negative. Reported P&L was −$675.79, with reported ending equity $9,324.21. This is an actual historical simulation with a losing result.
Choose a losing trade rather than stopping at the total. One recorded trade bought approximately 0.05 BTC at $94,988.220375 and exited at $94,276.688075 ten hours later. Its price-change arithmetic is:
(94,276.688075 − 94,988.220375) × 0.05 = −35.576615That agrees with its recorded loss of approximately $35.58. The 24 returned trade P&Ls also reconcile to the job’s realized P&L within decimal precision.

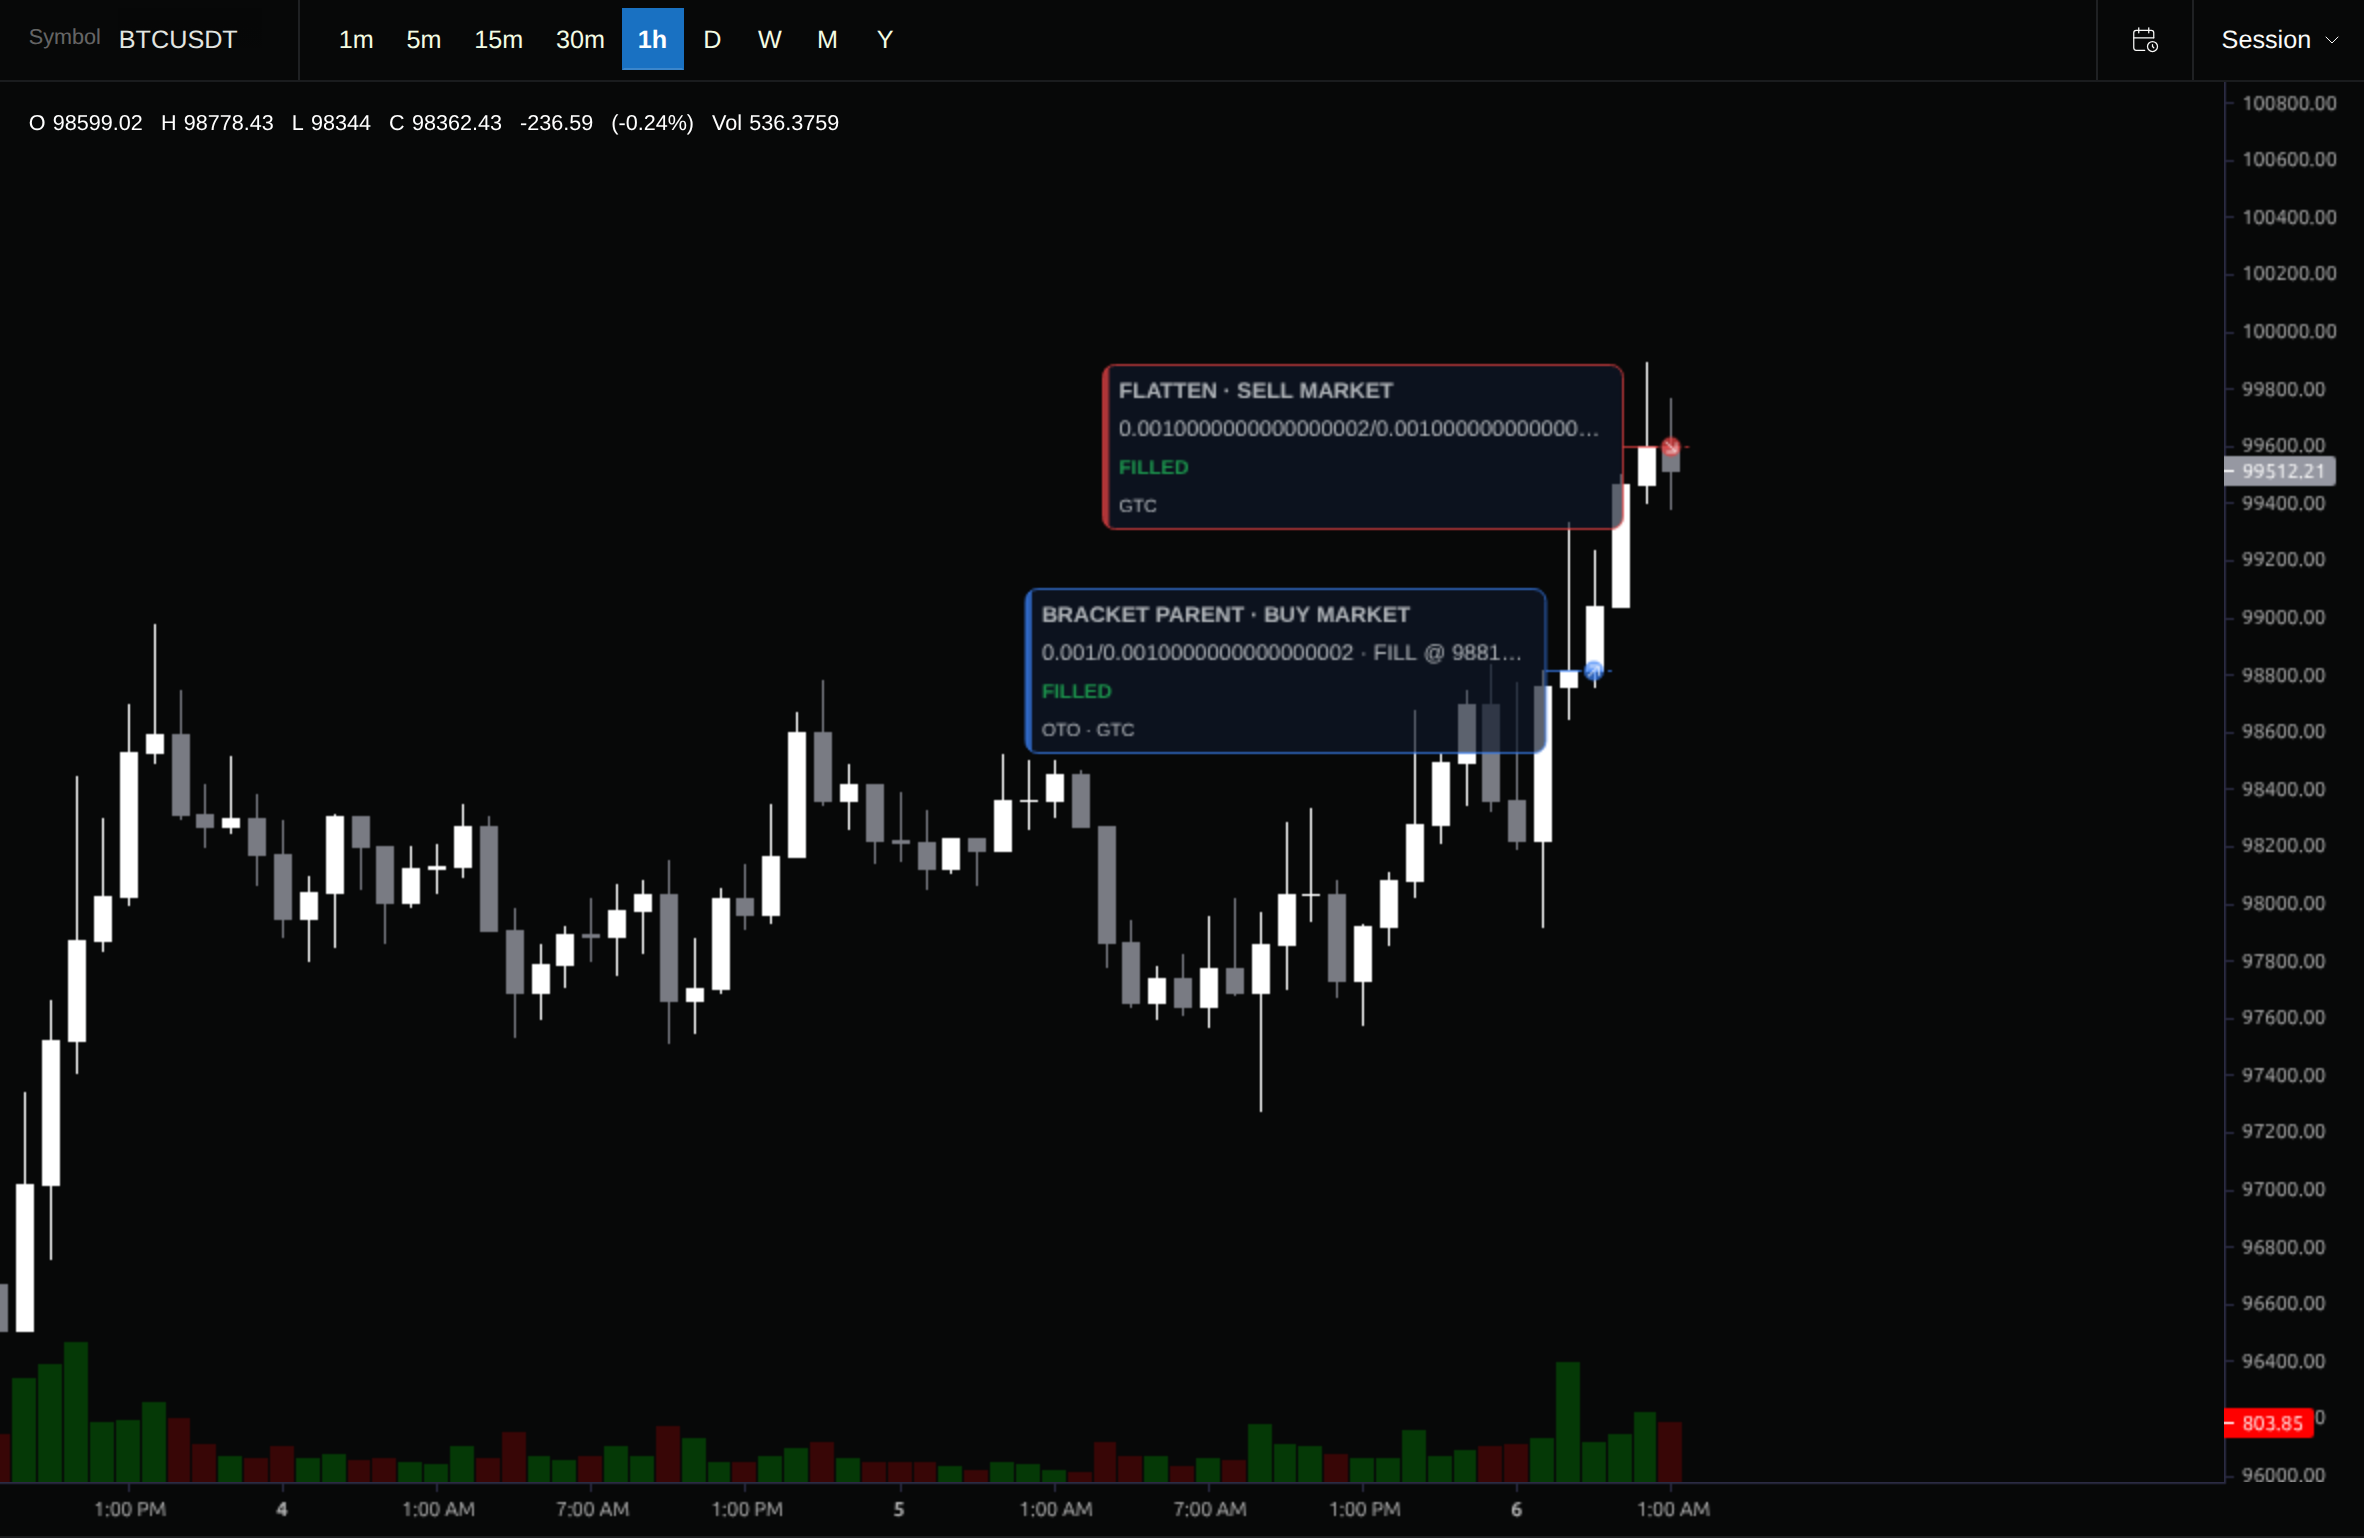
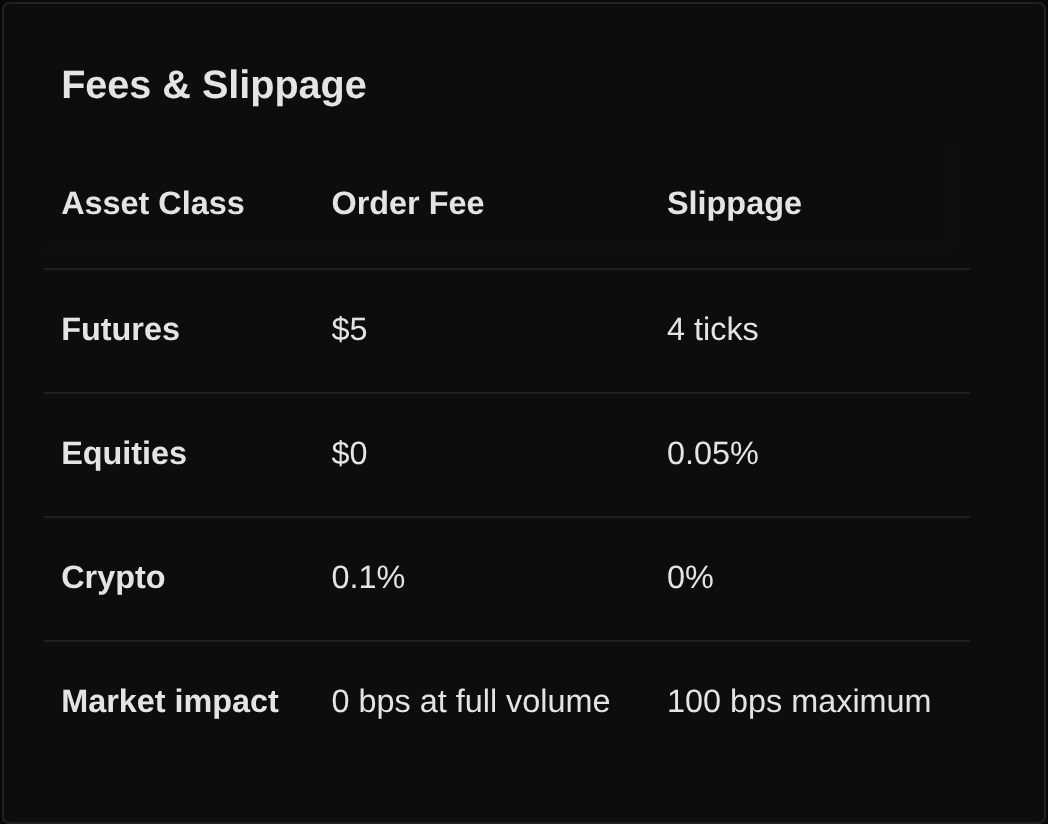
Two limits matter for a software trial. The configuration contains a crypto commission setting, yet all 24 returned trades record zero fees. Earlier inspection of this run’s chart at the selected entry timestamp also displayed a false upward-cross condition and an order price different from the completed fill. The cause remains unresolved. These observations prevent us from calling this a verified after-commission result or a fully reconciled signal-to-fill replay; the full Bitcoin example retains those limitations.
Use the same five checks in every trial
| Acceptance check | Evidence to keep |
|---|---|
| Express the strategy | Saved entry, state, exit, sizing, and any timing restriction match your specification. |
| Match the data | Exact instrument/venue, usable dates, bar interval, session, and adjustment or rollover assumptions are recorded. |
| Explain execution | Signal time, order submission, fill assumptions, quantity, and final-position treatment can be identified. |
| Reconcile a trade | Entry/exit prices and quantity explain P&L; returned charges match the costs you intended to model. |
| Repeat the inspection | Saved rules, configuration, report, and trade records remain available after the run. |
Treat an unexplained mismatch as an open question for that workflow. A cost input, chart marker, or attractive return is not enough to resolve it. Use the slippage stress-test example when execution costs are your main concern, and keep trial assumptions fixed before comparing outcomes.
Start with one bounded backtest in Stratifyre, then retain the saved rules and explain one trade before expanding the strategy. The software earns a place in your workflow when those checks answer your actual requirements.
Put your strategy rules to the test
Build your strategy, inspect historical trades, and review the assumptions behind your results.
Build and test your strategy