Win rate, profit factor and expectancy: why winning often can still lose money
Reconcile winning and losing trades, costs and dollar expectancy with a real Bitcoin backtest—and see why an 80% win rate can still produce a loss.
A high win rate can lose money when the losing trades cost more than the winners earn. Win rate counts outcomes; profit factor compares their dollar totals; expectancy measures the average result per completed trade. All three need the same trade list and cost basis.
Consider an explicitly hypothetical sequence: eight $50 wins and two $300 losses. It wins 80% of the time and loses $200 before fees. Below, we reconcile an actual completed Bitcoin backtest showing the reverse pattern, then work through that fictional high-win-rate case after costs.
Define the trade and its cost basis first
Use completed trades with an explicit accounting unit: a closed position, closed lot or round trip. Partial exits can create several rows from one entry, so compare reports only after checking what each counts. Exclude open positions from this closed-trade worksheet; reconcile their unrealized P&L separately if they remain in the account.
Let N be all completed rows, W positive rows, L negative rows and B exactly zero rows, using one consistent P&L basis. Then N = W + L + B. A zero outcome stays in N but is neither a winner nor a negative loss here. TradingView similarly defines percent profitable as winners divided by all closed trades, keeping even trades in the denominator. Percent profitable definition
| Metric | Calculation on the chosen P&L basis | What it answers |
|---|---|---|
| Win rate | W ÷ N × 100% | How often was a completed trade positive? |
| Profit factor | Sum of positive P&L ÷ absolute sum of negative P&L | How much did the winners earn for each dollar lost? |
| Dollar expectancy | Sum of signed P&L ÷ N | What was the average dollar result per completed trade? |
| Dollar payoff ratio | Mean positive P&L ÷ mean negative-loss magnitude | How large was the average winner relative to the average loss? |
Profit factor uses realized trade outcomes; open-position gains do not belong in its numerator. With negative P&L present, a value above one means the positive rows outweighed the negative rows on that basis. With no negative rows, the ratio has a zero denominator; an infinite or blank display is not evidence that losses cannot occur. Profit factor definition
“Gross profit” also needs a definition. It can mean the sum of winning trade outcomes after commissions, before offsetting losing trades: that is TradingView’s documented convention. It does not necessarily mean profit before fees. Check whether the rows already include costs before subtracting them again. Gross profit and commission handling
Reconcile a real run: fewer wins, larger winners
This retained, executed demo-account backtest trades Binance spot BTC/USDT hourly from April 1 through June 30, 2025. It buys 0.05 BTC when EMA(20) crosses above EMA(50) while flat, then closes on the downward cross. The starting account is $10,000; saved settings specify on-open execution, pessimistic fill mode, 0.05% slippage and final flattening. These are configured settings, not independent verification of the executed fill model.
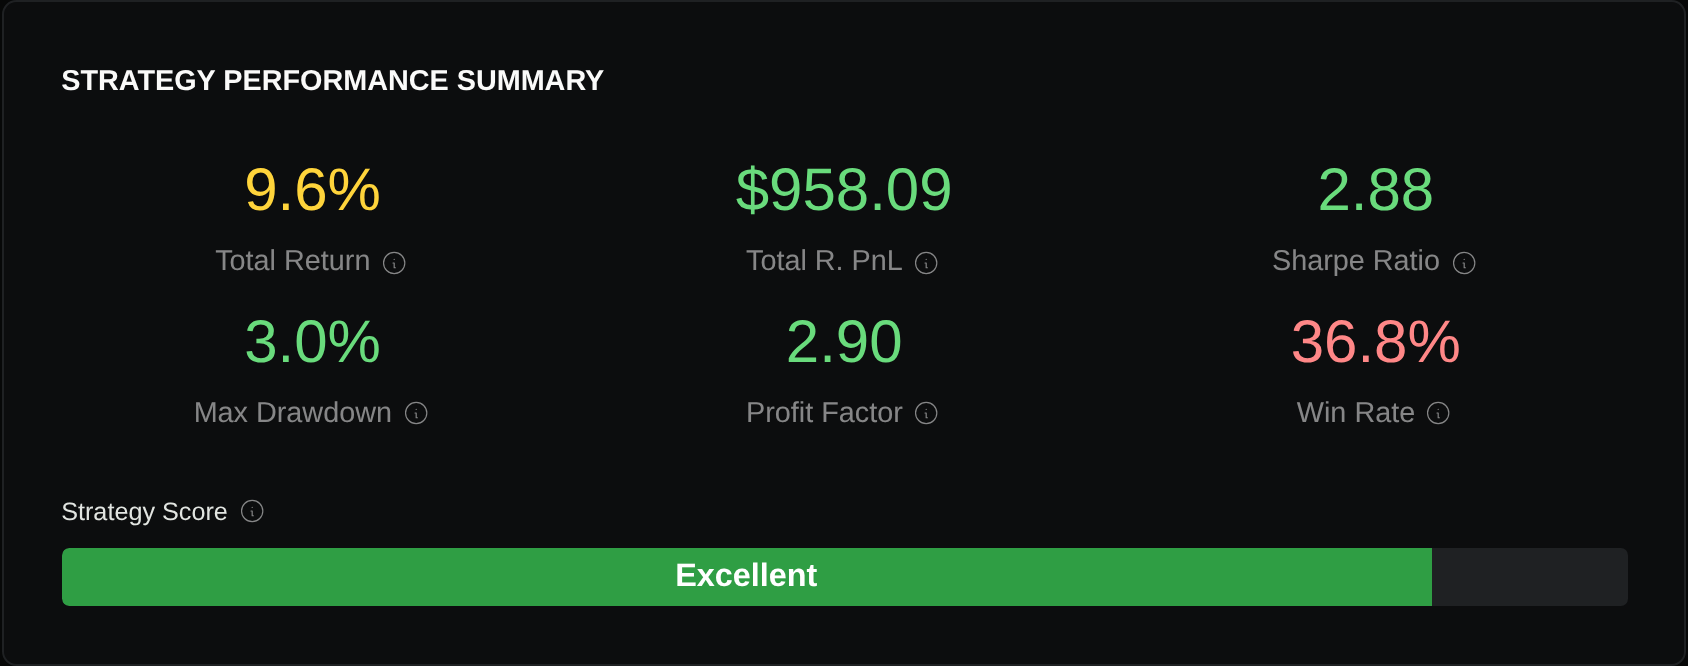
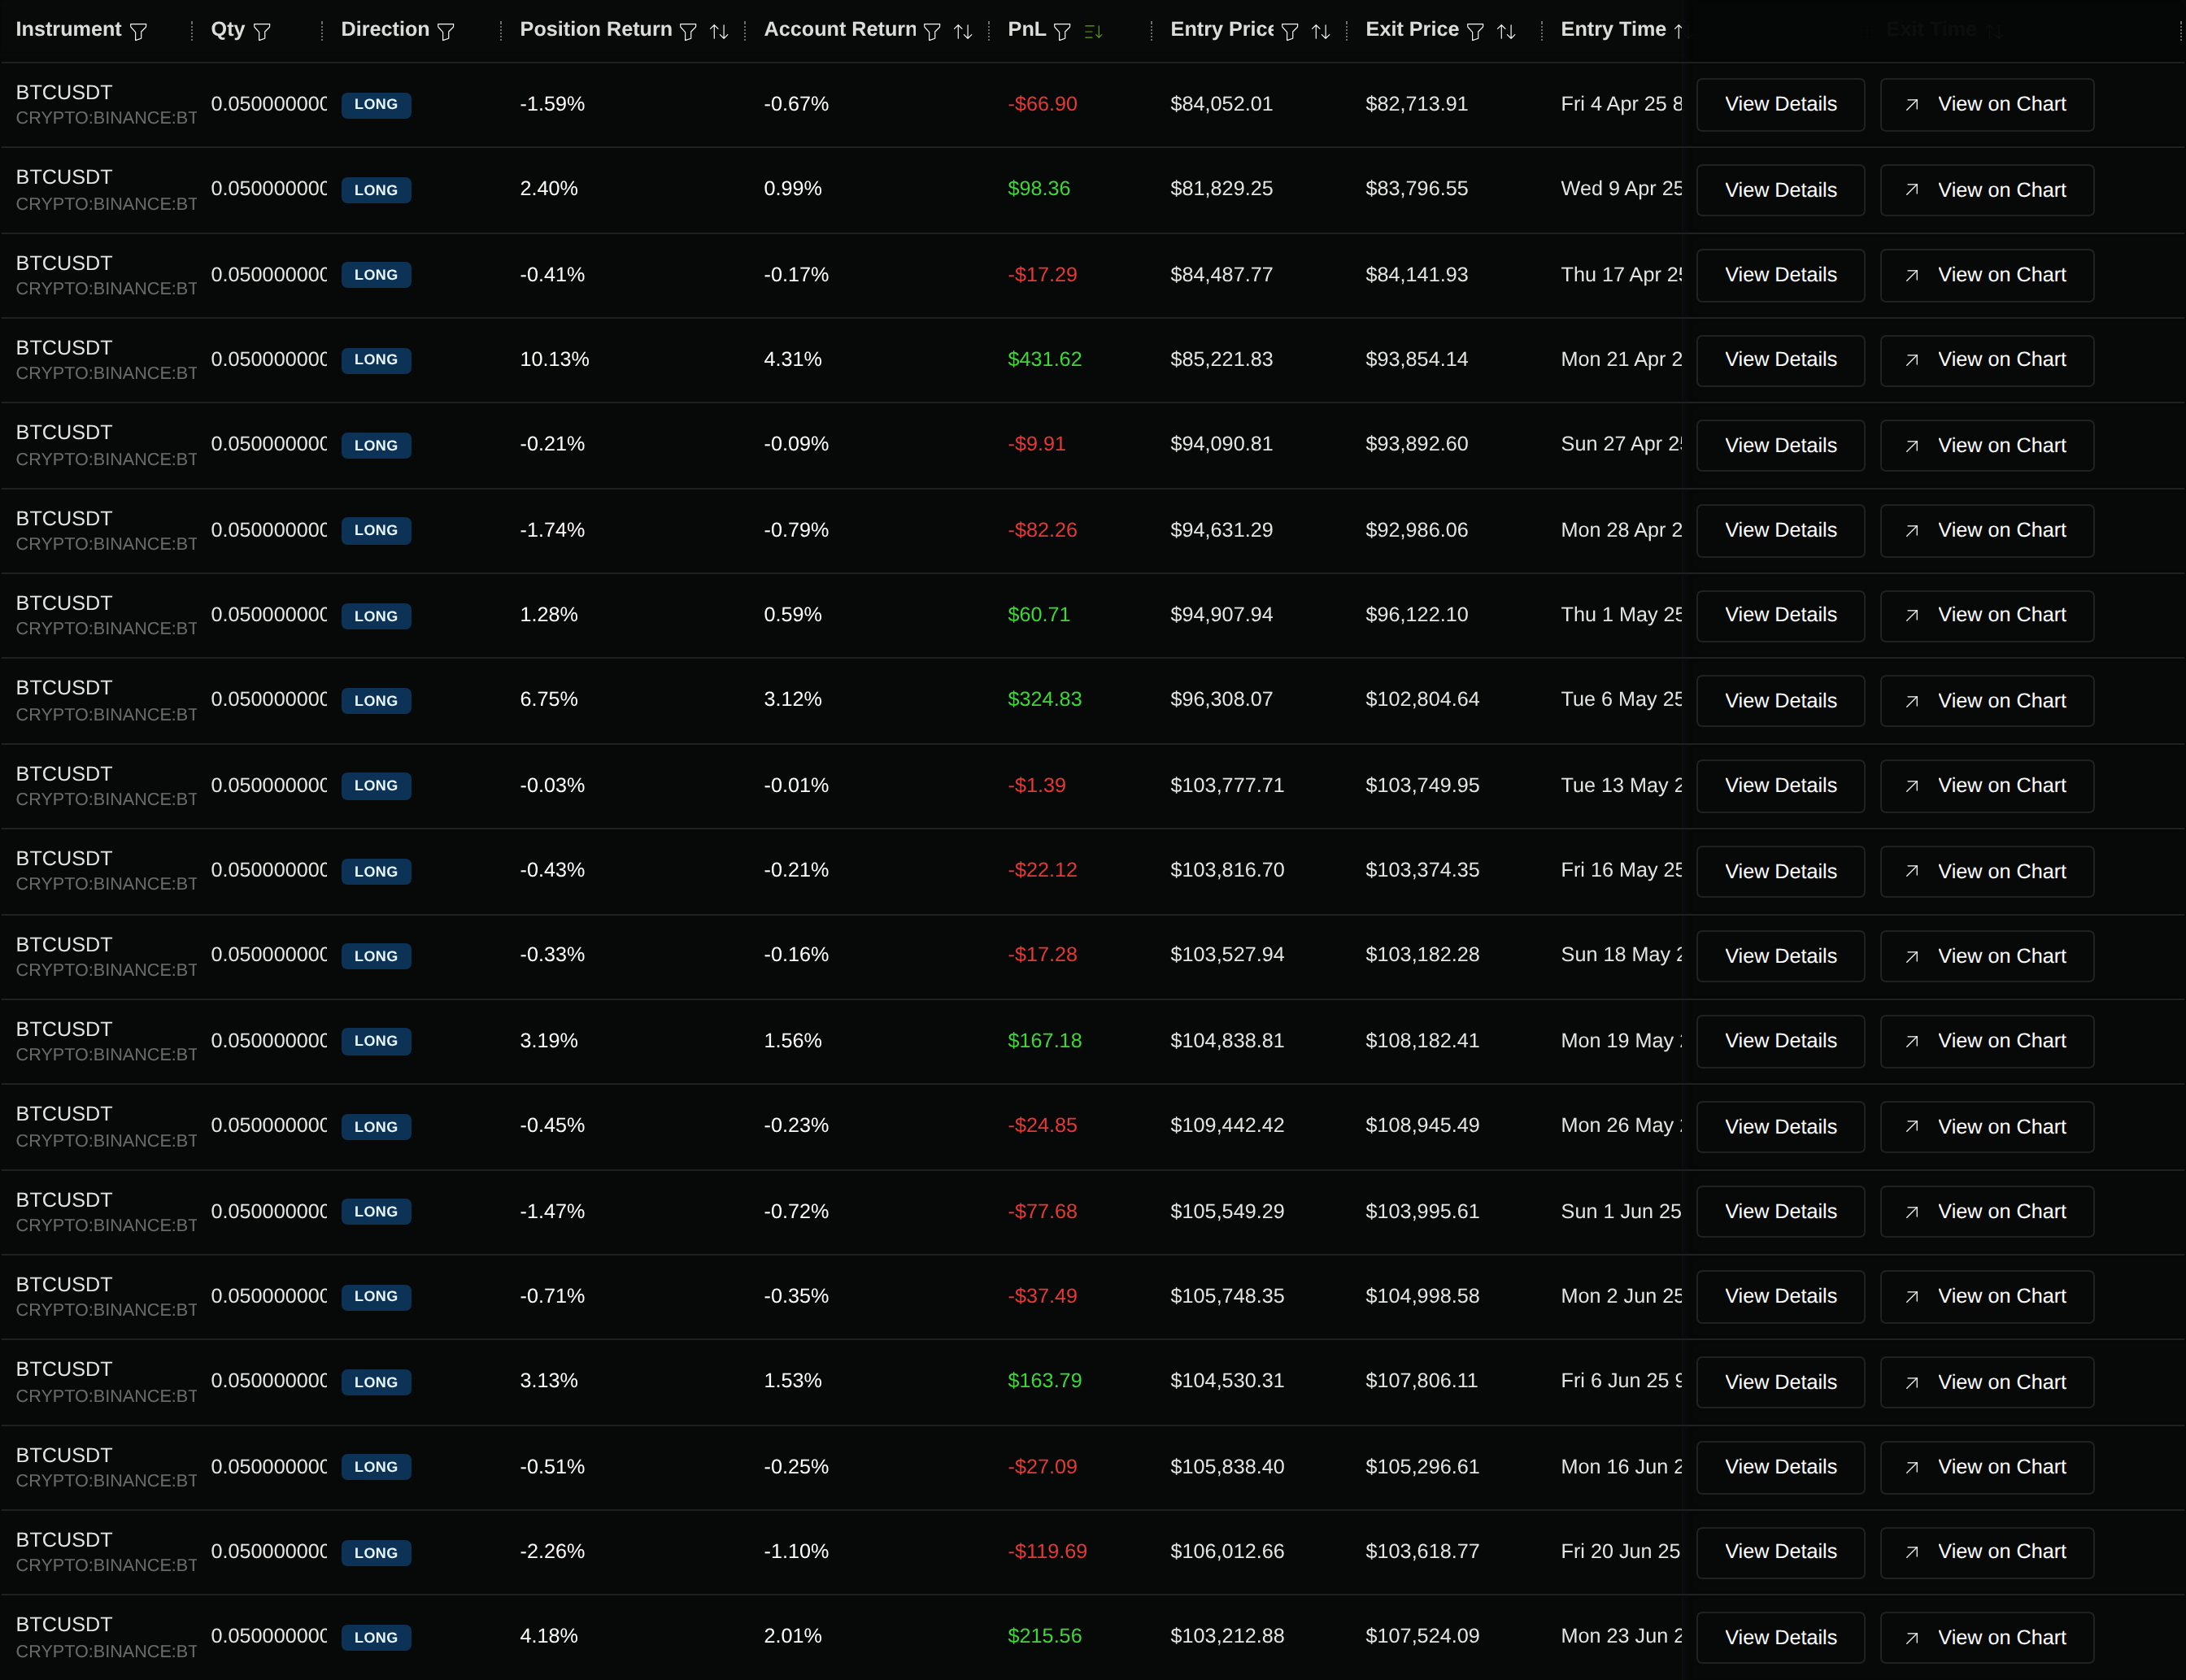
We reused the completed run already examined in the profit-concentration article, rather than searching for a new result to fit this lesson. Its complete returned list contains 19 trades: seven positive, twelve negative and zero exactly breakeven.
The following sums use all 19 exact returned P&L values before rounding to cents.
| Reconciliation item | Recorded or calculated result |
|---|---|
| Winners / all completed trades | 7 ÷ 19 = 36.84% |
| Negative losses / all completed trades | 12 ÷ 19 = 63.16% |
| Exactly zero / all completed trades | 0 ÷ 19 = 0% |
| Positive trade P&L sum | $1,462.05 |
| Absolute negative trade P&L sum | $503.96 |
| Signed price P&L at returned fills | +$958.09 |
| Returned trade fees | $0.00 |
| Reported net P&L | +$958.09 |
| Ending equity less starting equity | $10,958.09 − $10,000 = +$958.09 |
| Profit factor | $1,462.05 ÷ $503.96 ≈ 2.90 |
| Author-calculated dollar expectancy | $958.09 ÷ 19 ≈ +$50.43 per trade |
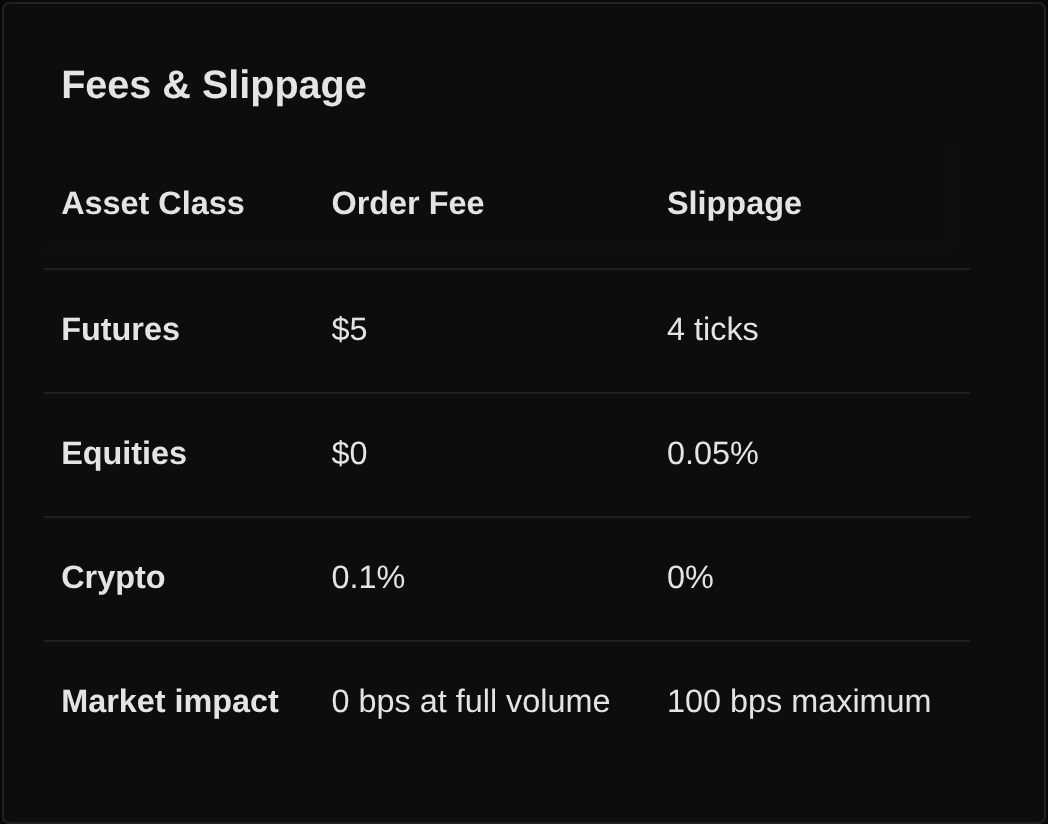
The unrounded trade total differs from the reported total by less than $0.000000000002. Price P&L, reported net P&L and the account change agree because no additional commission deduction appears in this reconciliation. The saved commission setting alone does not establish that it was charged. Our calculation uses returned fill-price P&L without deducting an additional estimated slippage charge. Whether the configured slippage was correctly applied remains unverified.
Mean winning P&L is $1,462.05 ÷ 7 = $208.86; mean negative-loss magnitude is $503.96 ÷ 12 = $42.00. The dollar payoff ratio is about 4.97. Weighting those conditional averages by their frequencies gives the same expectancy:
(7 / 19 × $208.8639496) − (12 / 19 × $41.9967230)≈ +$50.4256300 per completed tradeThese are author calculations in dollars. The native report’s expectancyPct averages per-trade percentage returns; it is a different unit and denominator. Dollar and percentage payoff ratios also need not match when entry notionals differ, even with a fixed BTC quantity.
Inspect one row before trusting the totals
The first chronological trade reports entry $84,052.005, exit $82,713.912355 and quantity 0.05 BTC. For this long position:
($82,713.912355 − $84,052.005) × 0.05 BTC= −$66.90463225Its returned fee is zero. That agrees with the trade table’s −$66.90, but does not verify the missing configured commission.

Matching prices, quantities and totals checks the arithmetic. It does not establish that the underlying signal or fill was correct: this retained run has an unresolved chart-replay/fill discrepancy. Nineteen trades from one selected period also cannot establish a stable future expectancy.
Hypothetical 80% wins: losing before and after fees
Return to the fictional ten-trade worksheet. Eight trades earn $50 each before fees; two lose $300 each. Assume a made-up $5 total round-trip fee per trade, no separate slippage deduction, no open positions and no other cash flows.
| Outcome group | Count | Price P&L per trade | Fee per trade | Net P&L per trade |
|---|---|---|---|---|
| Winners | 8 | +$50 | $5 | +$45 |
| Losses | 2 | −$300 | $5 | −$305 |
| Exactly breakeven | 0 | — | — | — |
Before fees, gains total $400 and losses total $600: −$200, profit factor 0.67 and expectancy −$20. Fees total $50. After fees, gains total $360 and negative-loss magnitude totals $610: −$250, profit factor 0.59 and expectancy −$25. The win rate remains 8 ÷ 10 = 80% on both bases.
Eight small wins cannot cover two large losses
Hypothetical arithmetic · ten completed trades · $5 round-trip fee each
View example data
| Outcome group | Net P&L ($) |
|---|---|
| Eight winners | 360 |
| Two losses | -610 |
For this two-outcome illustration, the win rate needed to break even after fees is $305 ÷ ($45 + $305) = 87.14%. That threshold assumes these same conditional payoff amounts and no zero rows; it is not a target estimated from market evidence. Alternatively, the strategy would need larger winners, smaller losses or lower costs—each requiring a new test with explicitly changed rules or assumptions.
A price-flat trade with a fee is a net loss, not a net breakeven. Reclassify on the chosen after-cost basis; do not subtract fees from expectancy while keeping a before-fee win count and calling the two measures comparable. The crypto cost worksheet expands that accounting check.
Read the three metrics as one audit
- Count every completed row. Record winners, negative losses and exact-zero outcomes; keep zero rows in the overall denominator.
- Reconcile dollars and charges. Sum positive and negative rows, check charged entry/exit fees and other costs, then match the result to account equity. Identify any remaining open exposure.
- Inspect the payoff distribution. Compare typical winner and loss size, then open unusually large contributors. A positive average can still accompany uncomfortable drawdowns or dependence on a few trades.
- Freeze sizing before comparing strategies. Dollar expectancy can rise simply because positions are larger. Check fixed versus risk-based sizing before attributing the change to a better signal.
Use your next Stratifyre backtest to produce one completed trade list you can reconcile. Read its win rate beside profit factor and cost-consistent expectancy, then inspect the trades that explain the difference.
Put your strategy rules to the test
Build your strategy, inspect historical trades, and review the assumptions behind your results.
Build and test your strategy