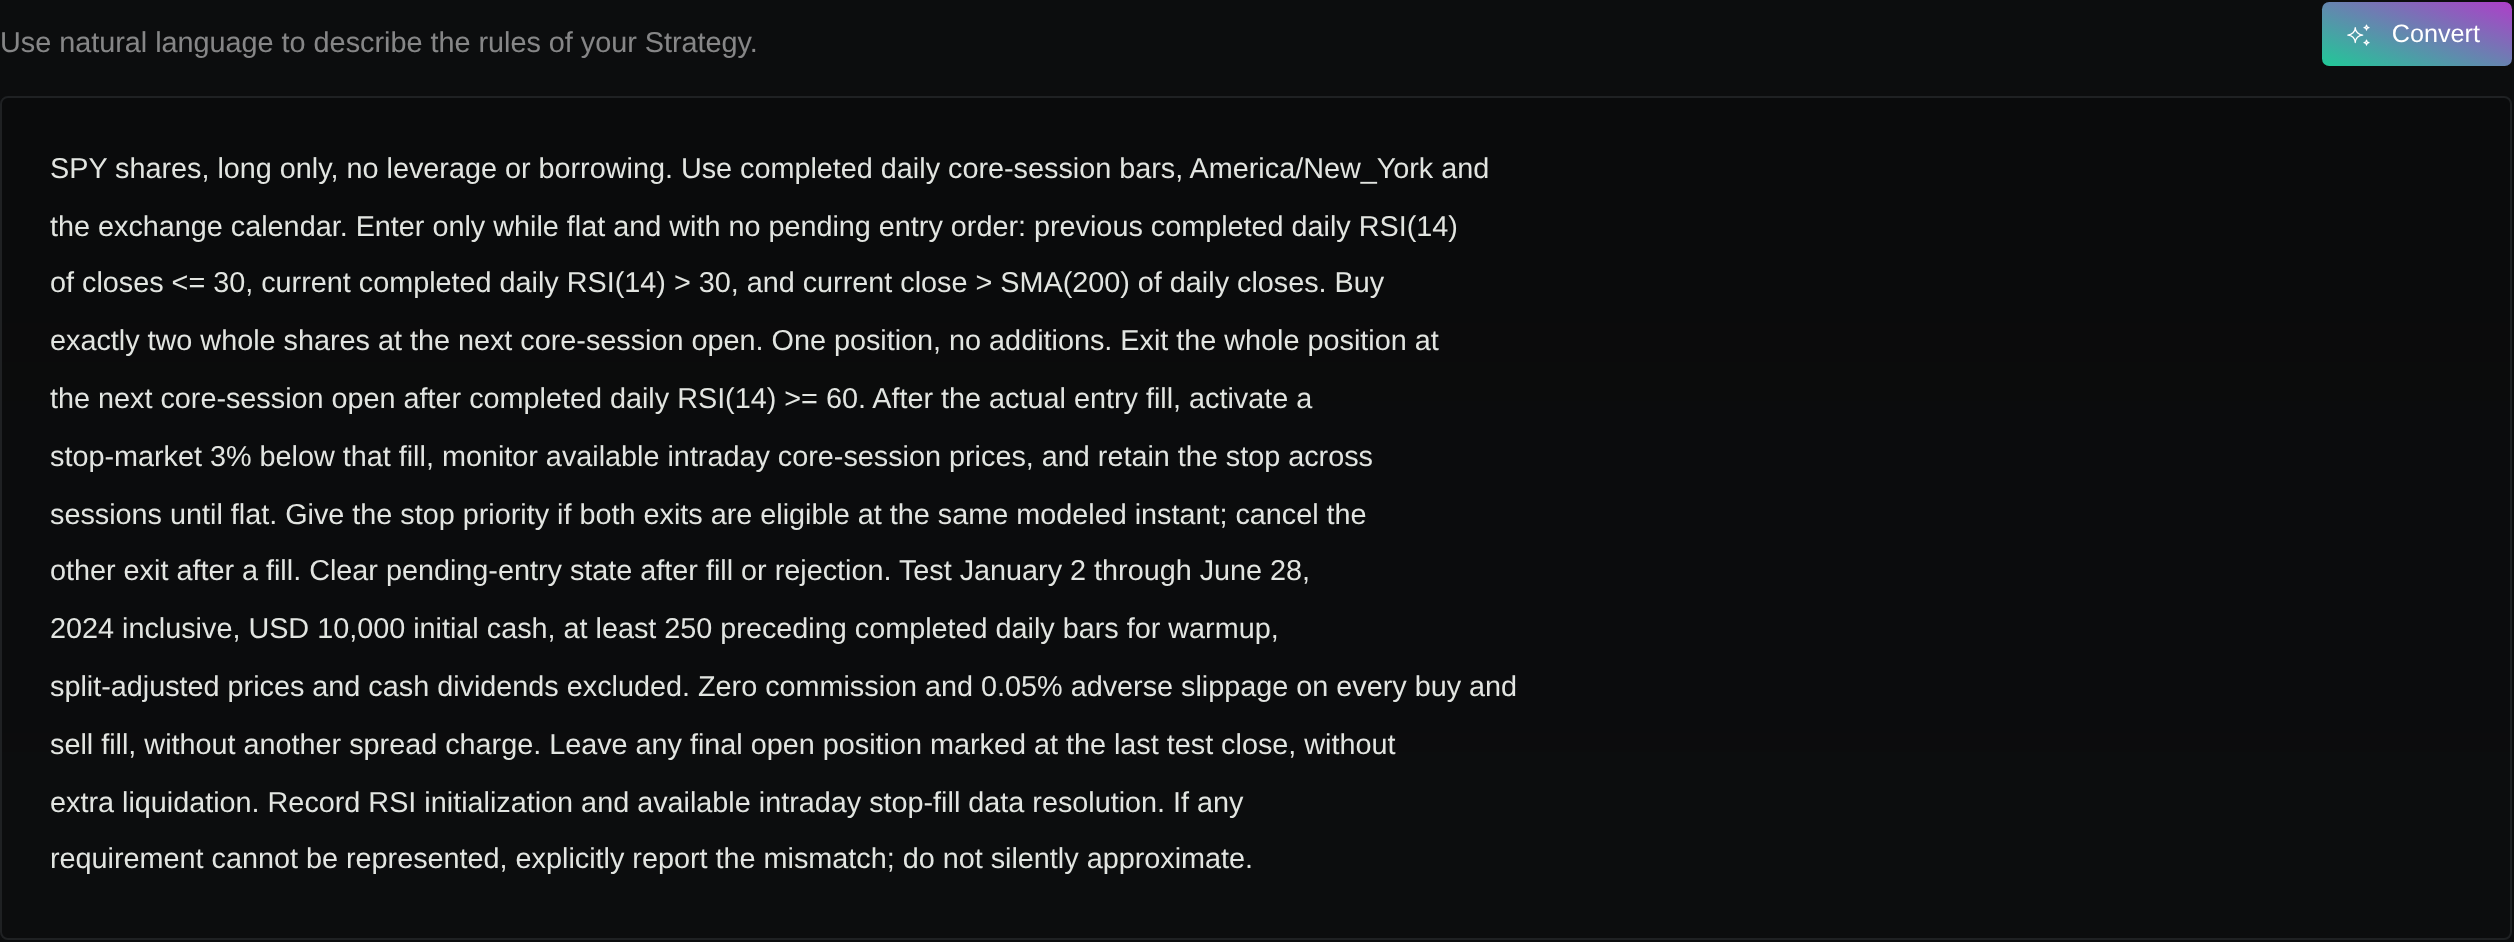
How to backtest a trading strategy: your first run and what to check
Define a small first backtest, save its assumptions, inspect the report and one trade, then choose the next check using a real Bitcoin example.
To backtest a trading strategy, write down its rules, choose the market and historical period, set sizing and execution costs, run the simulation, then inspect both the account report and individual trades.
Your first useful result is a saved test you can explain. A profitable headline with unclear assumptions gives you less to work with than a losing run whose orders and numbers you can inspect.
This guide follows a real completed Stratifyre demo backtest: an hourly Bitcoin moving-average strategy that turned a $10,000 simulated account into $9,324.21. We reuse that recorded run to show the workflow; it is a learning example, with unresolved fee and replay checks, rather than a strategy recommendation.
Decide what the first run should answer
Choose one question: “What happened when these entry and exit rules traded this market during this period?” Keep a note of what you expect to see, such as one position at a time and an exit on a downward cross.
Select the exact instrument and venue, not just “Bitcoin” or “stocks.” Binance BTC/USDT spot, a Bitcoin perpetual contract, and a stock ETF require different assumptions. Choose a period for which the required data exists, and retain the reason you chose it before inspecting the result.
If your rules still contain phrases such as “strong trend” or “small position,” start with turning a plain-English idea into backtest rules. This guide begins once you have rules precise enough to save. CME’s trade-plan guidance similarly calls for explicit entry, exit, and position-management decisions.
Write a setup you can repeat
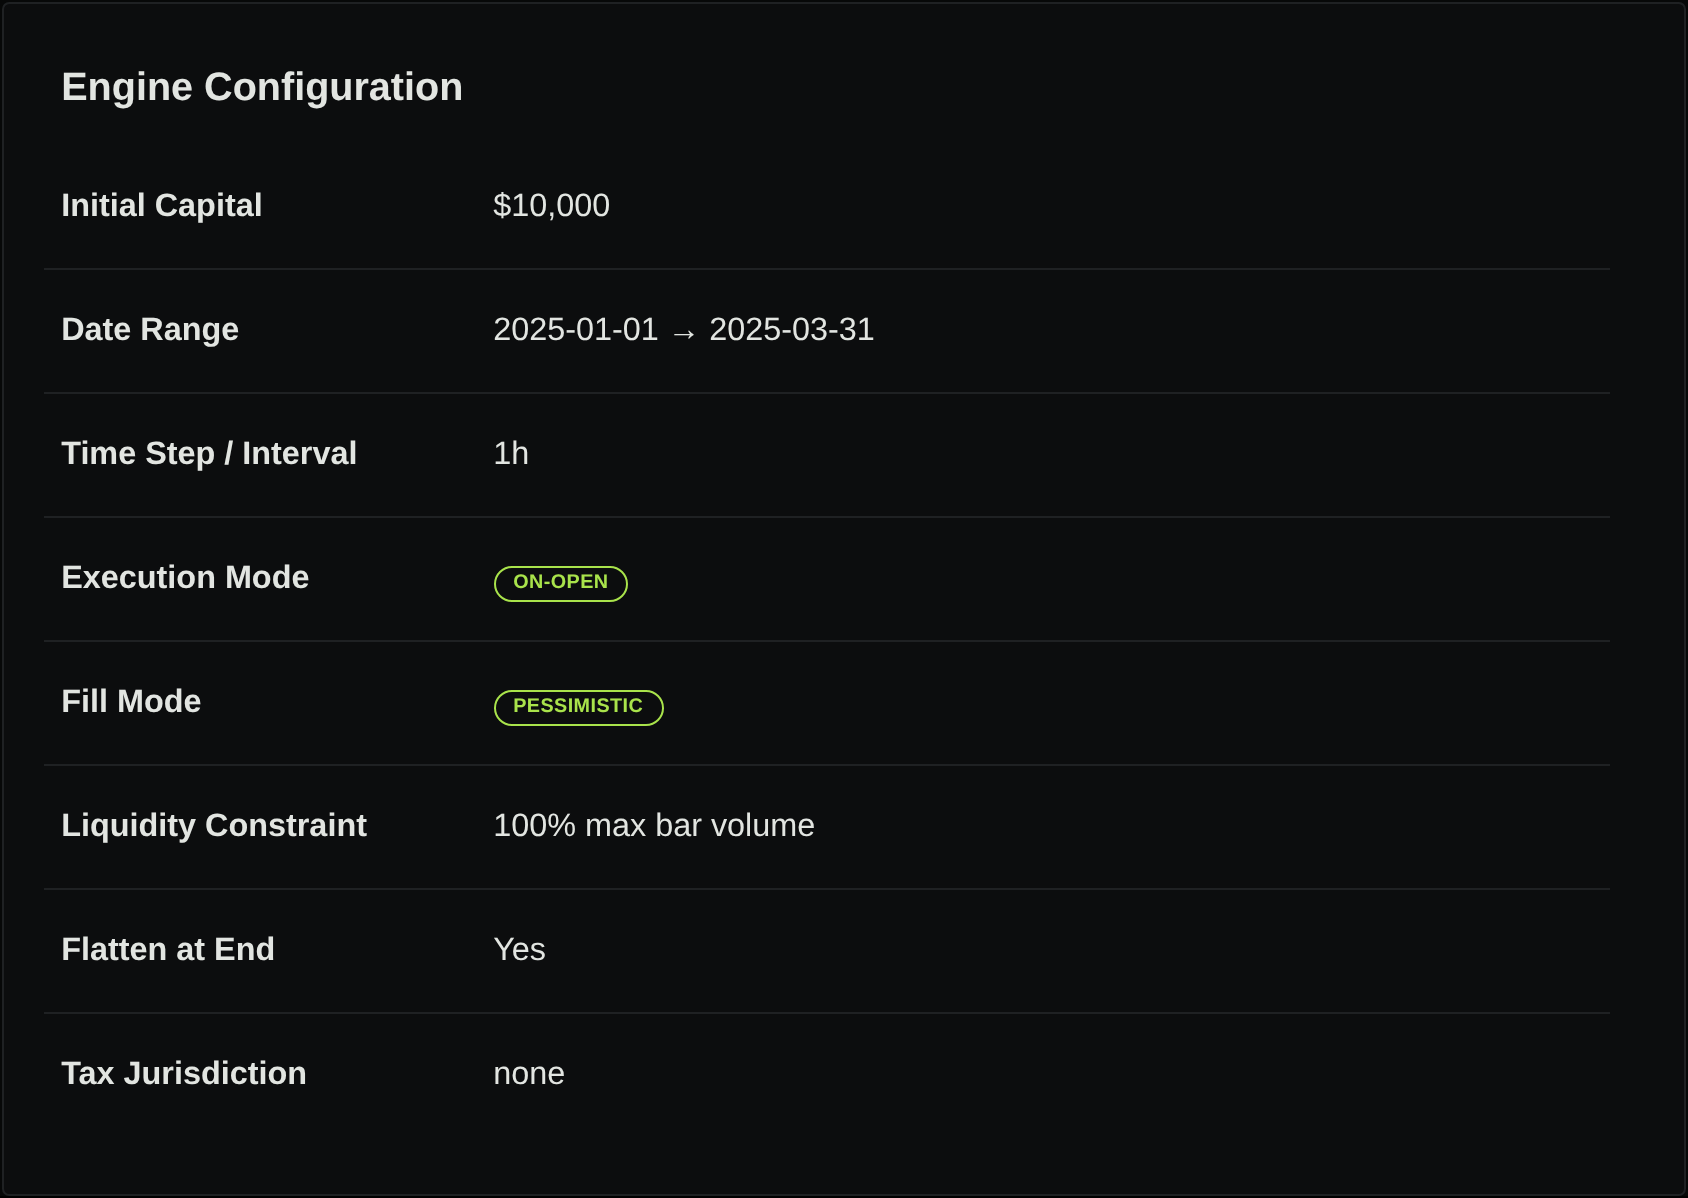
Before pressing Run, record the instrument, bar interval, date range, entry and exit, position size, starting cash, order timing, fees, and slippage. For stocks or futures, also record trading hours and the relevant corporate-action or contract assumptions.
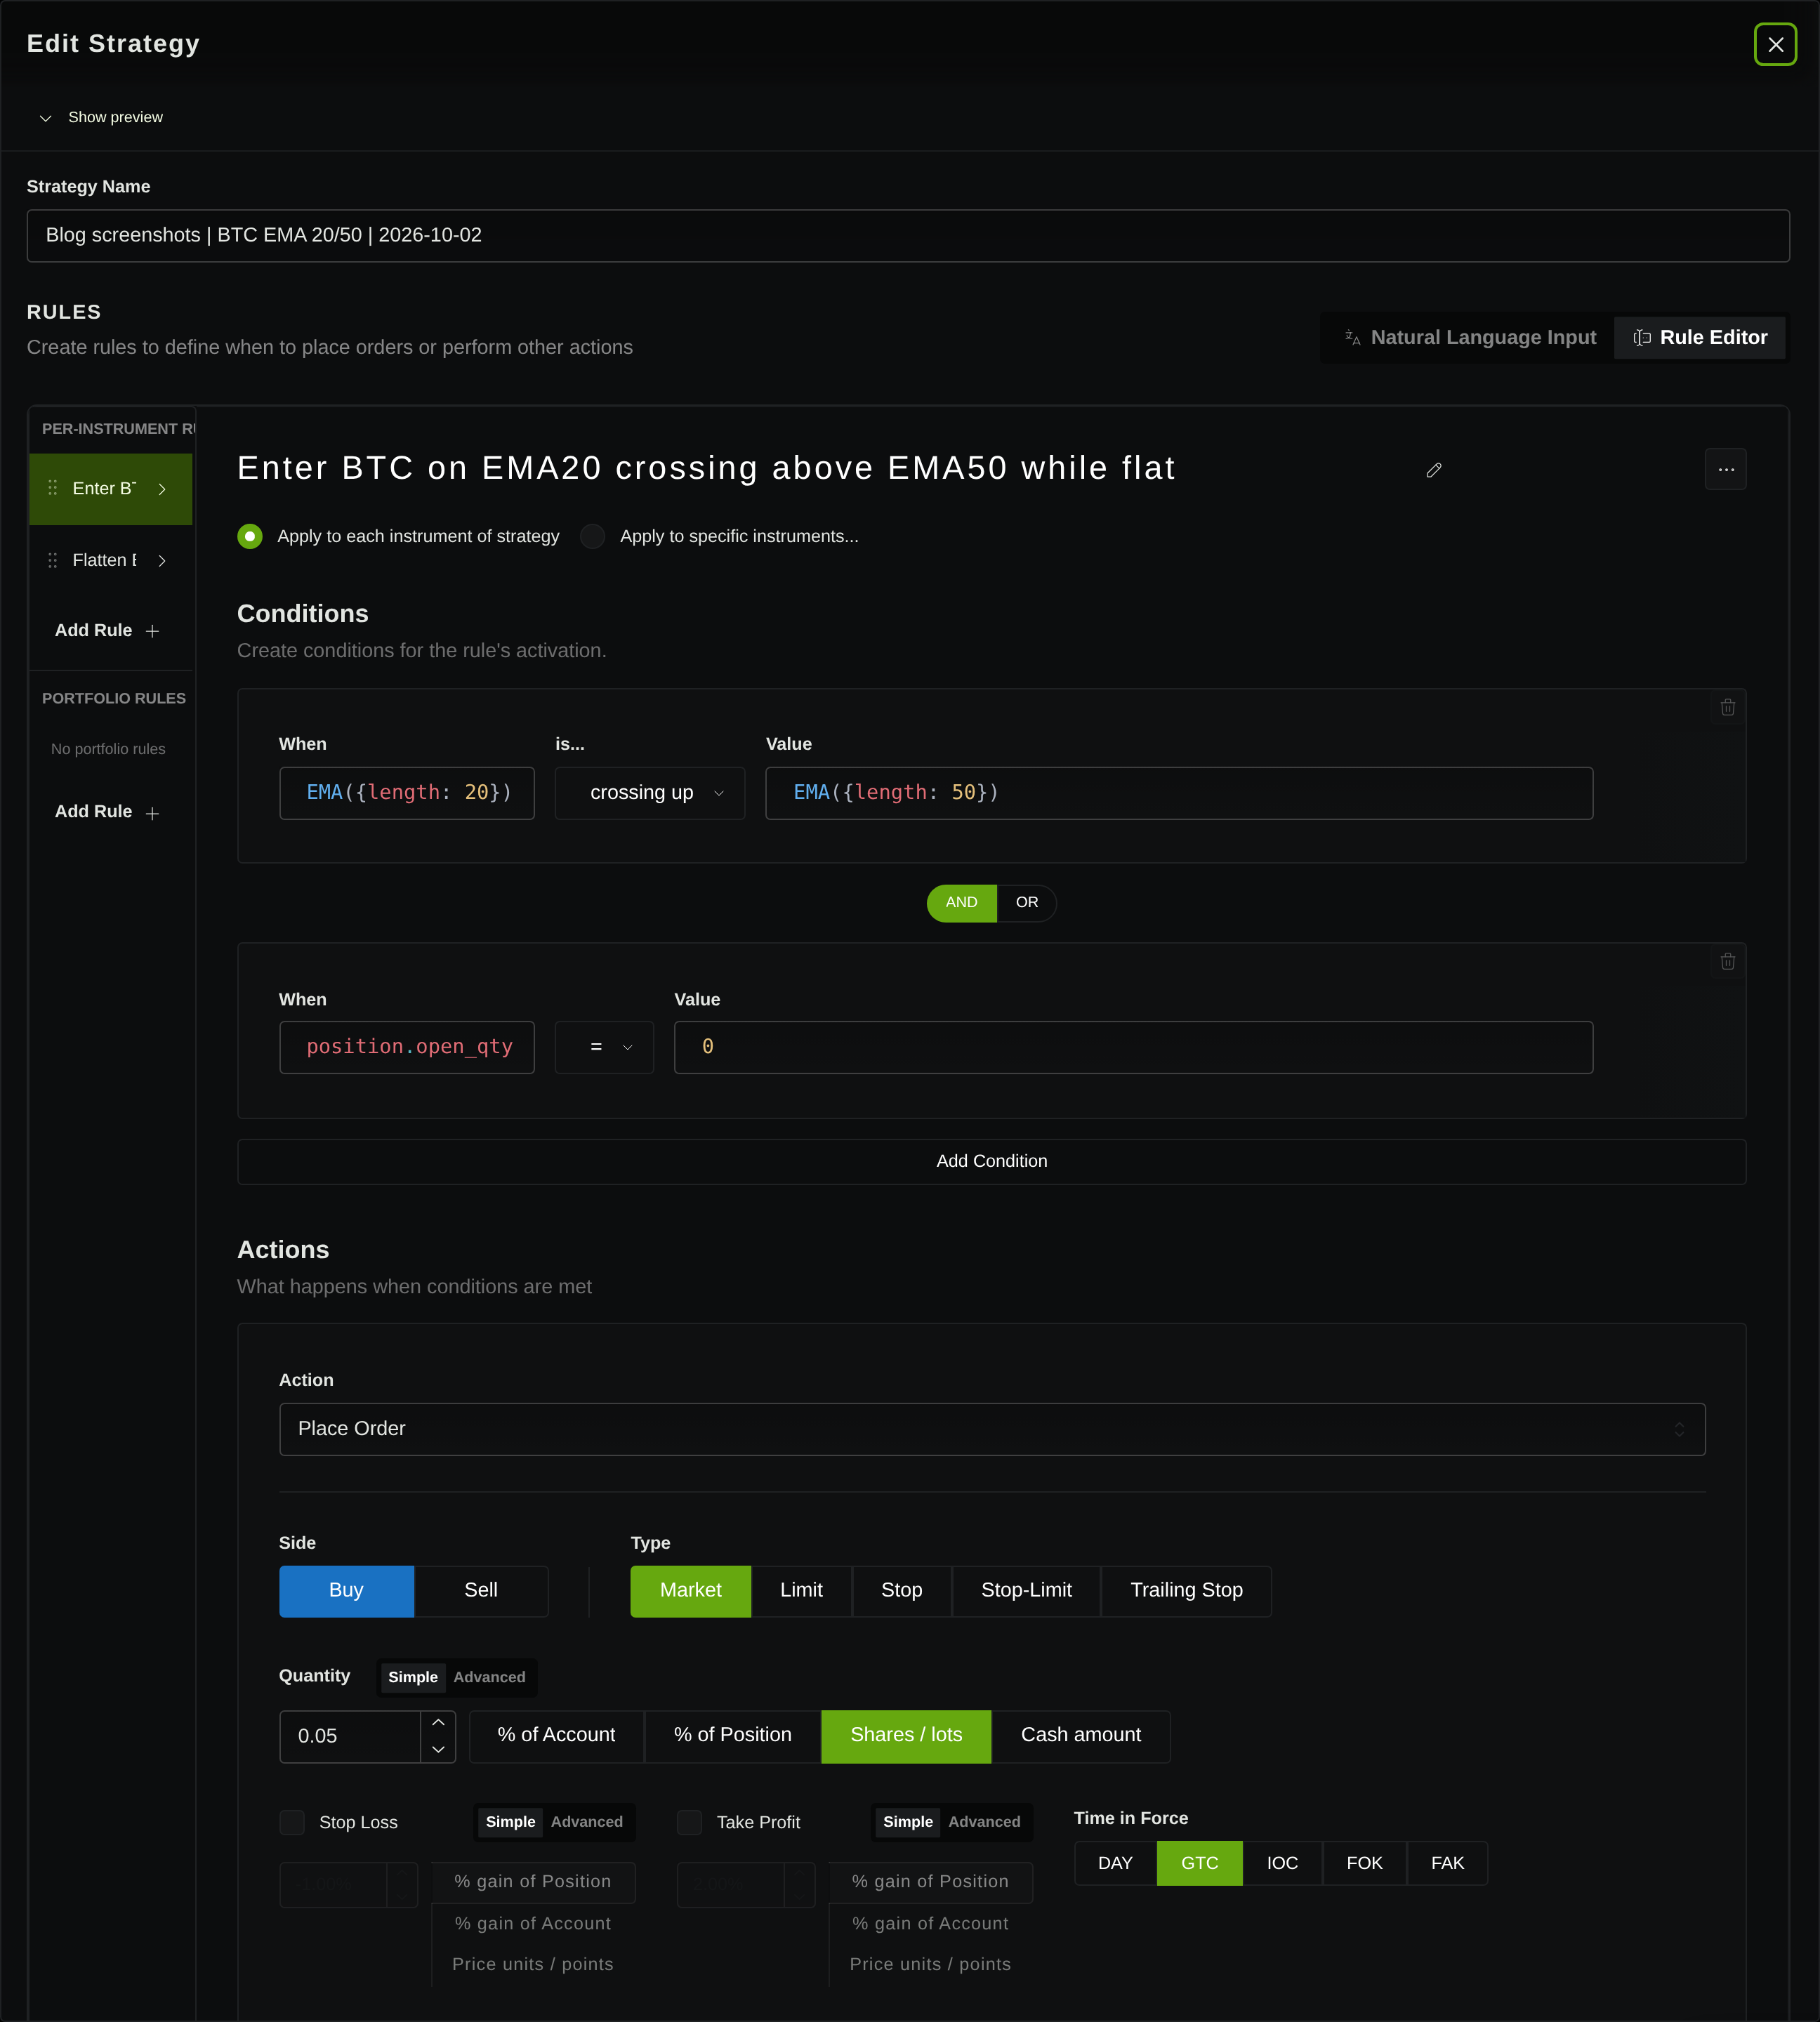
Here is the saved setup behind our example. The EMAs are exponential moving averages; 20 and 50 refer to hourly bars. The Bitcoin crossover recipe covers the full rule construction.
| Decision | Recorded example |
|---|---|
| Market | Binance BTC/USDT spot; CRYPTO:BINANCE:BTCUSDT |
| Period and interval | January 1–March 31, 2025, inclusive; hourly |
| Entry | EMA20 crosses above EMA50 while position quantity is zero |
| Size | Market buy of 0.05 BTC; one long position, no additions |
| Exit | EMA20 crosses below EMA50 while holding; flatten the position |
| Starting account | $10,000 |
| Execution | On-open; pessimistic fill mode; flatten at end |
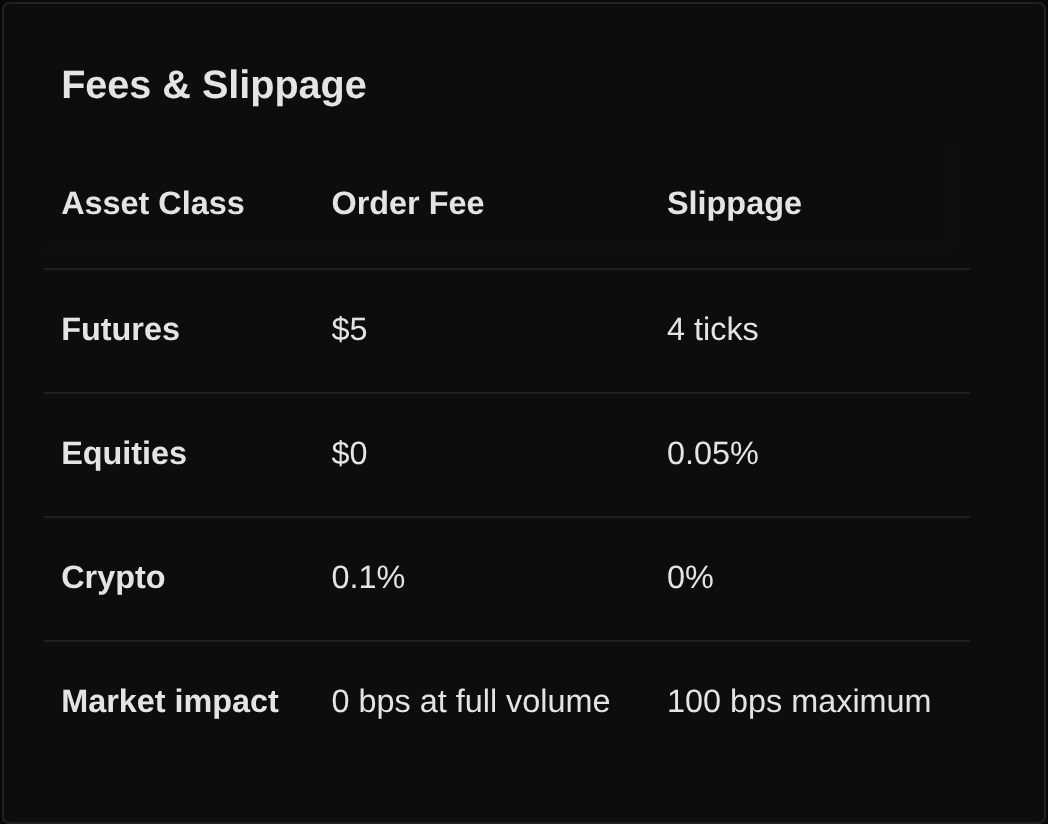
| Requested costs | Crypto commission 0.10%; crypto slippage 0.05% |
| Other settings | No short selling; no taxes; no stop-loss or profit target |
“Crosses above” identifies a change from at-or-below to above. “Is above” can stay true for many bars. That difference, and the flat-position check, matter when inspecting whether a rule can keep adding entries.
Keep warmup and timing on your checklist. Indicators need initialization, and a completed-bar signal must not assume information unavailable when the order was submitted. We have not independently reconciled this example’s EMA initialization or its exact signal-to-fill sequence; the saved execution label alone does not settle either question.
Save the settings, then wait for completion
In Stratifyre, save your strategy and select it in the backtest form. Set Initial Capital, Date Range, and Time Step, then inspect the relevant execution and cost settings in Advanced. Keep a copy of the saved configuration alongside the rules.
Start one run and wait for a terminal result. A queued or running job is not a completed backtest. If it fails or returns no trades, retain that outcome and check the error, data window, and conditions before changing the strategy.
For the recorded example, we reopened the completed job and checked that its saved configuration still matched the original execution. These are actual product captures from the matching demo account, not preloaded strategy statistics.
Read the account result before adding more metrics
Begin with starting cash, ending equity, trade count, and drawdown. Drawdown describes a decline from a previous account peak; the final result does not show how uncomfortable the path may have been.
This run returned 24 completed trades: six winners and eighteen losers. Its account lost $675.79, a 6.76% decline, and its reported maximum drawdown was 12.14%.
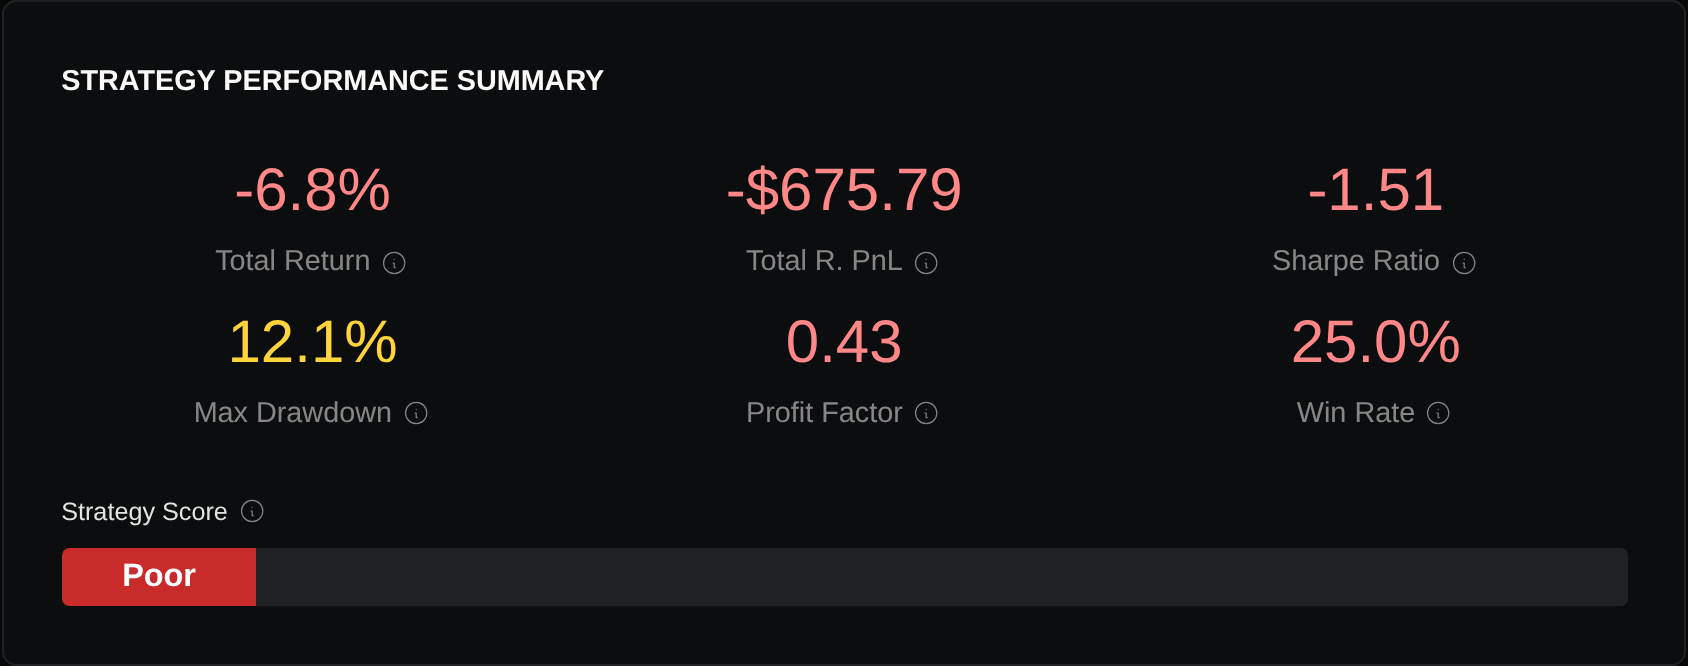
Check that the pieces agree: $10,000 minus $675.79 is $9,324.21, and the returned trade P&Ls sum to the same loss. Do not compare this fixed 0.05 BTC position directly with a fully invested Bitcoin price chart. The account also held cash, so those are different exposures.
Open a trade and check the arithmetic
Choose a trade to inspect, including a loss. Record its instrument, entry and exit times, prices, quantity, and fees. Then compare the order with the rule and available chart information; a matching P&L calculation is only one part of that check.
One recorded trade entered at 94,988.220375, exited at 94,276.688075, and held 0.05 BTC for ten hours. Its returned loss was $35.58:
(94,276.688075 − 94,988.220375) × 0.05= −35.576615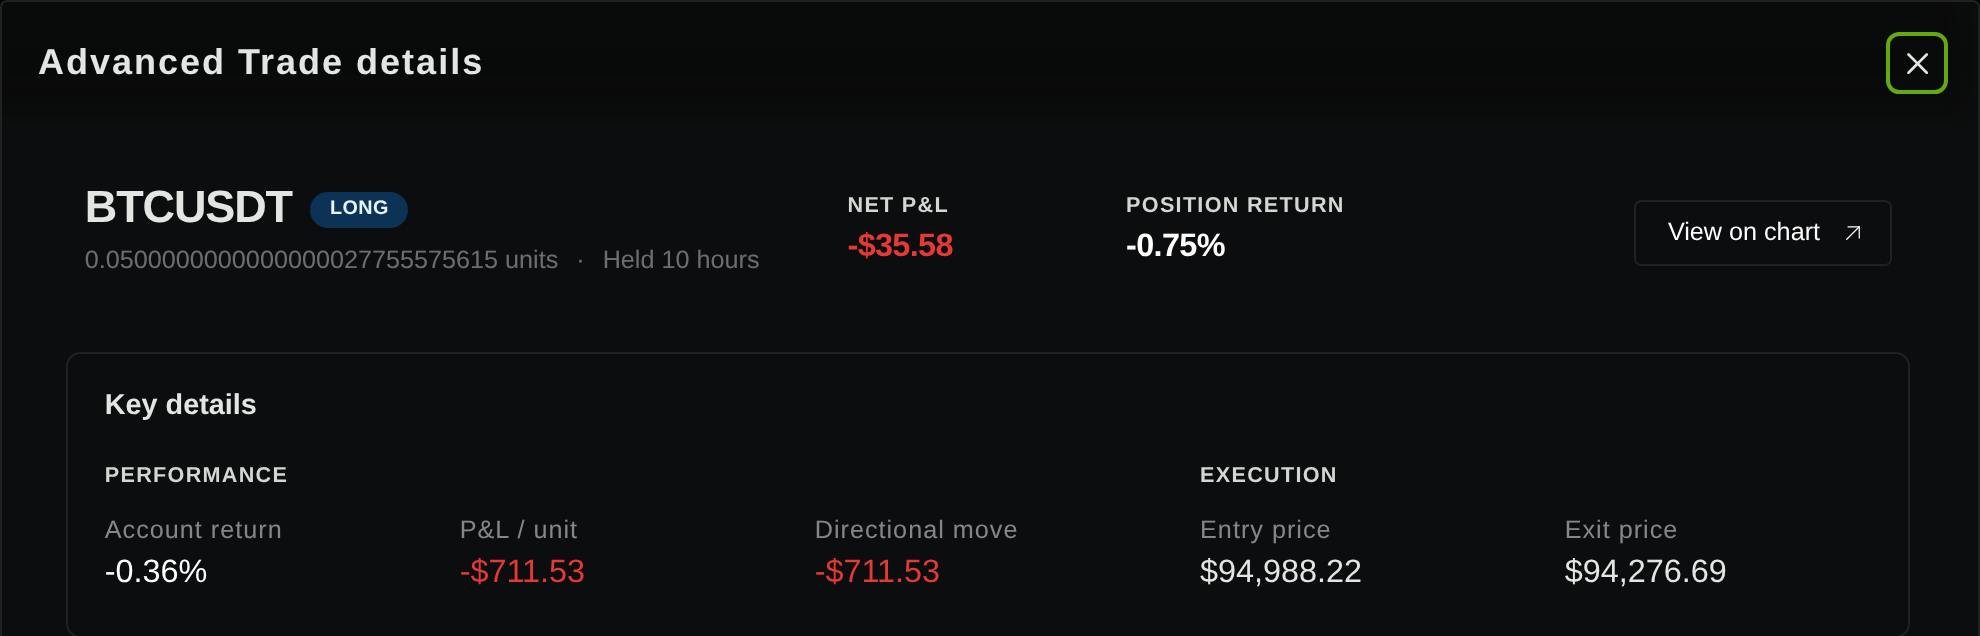
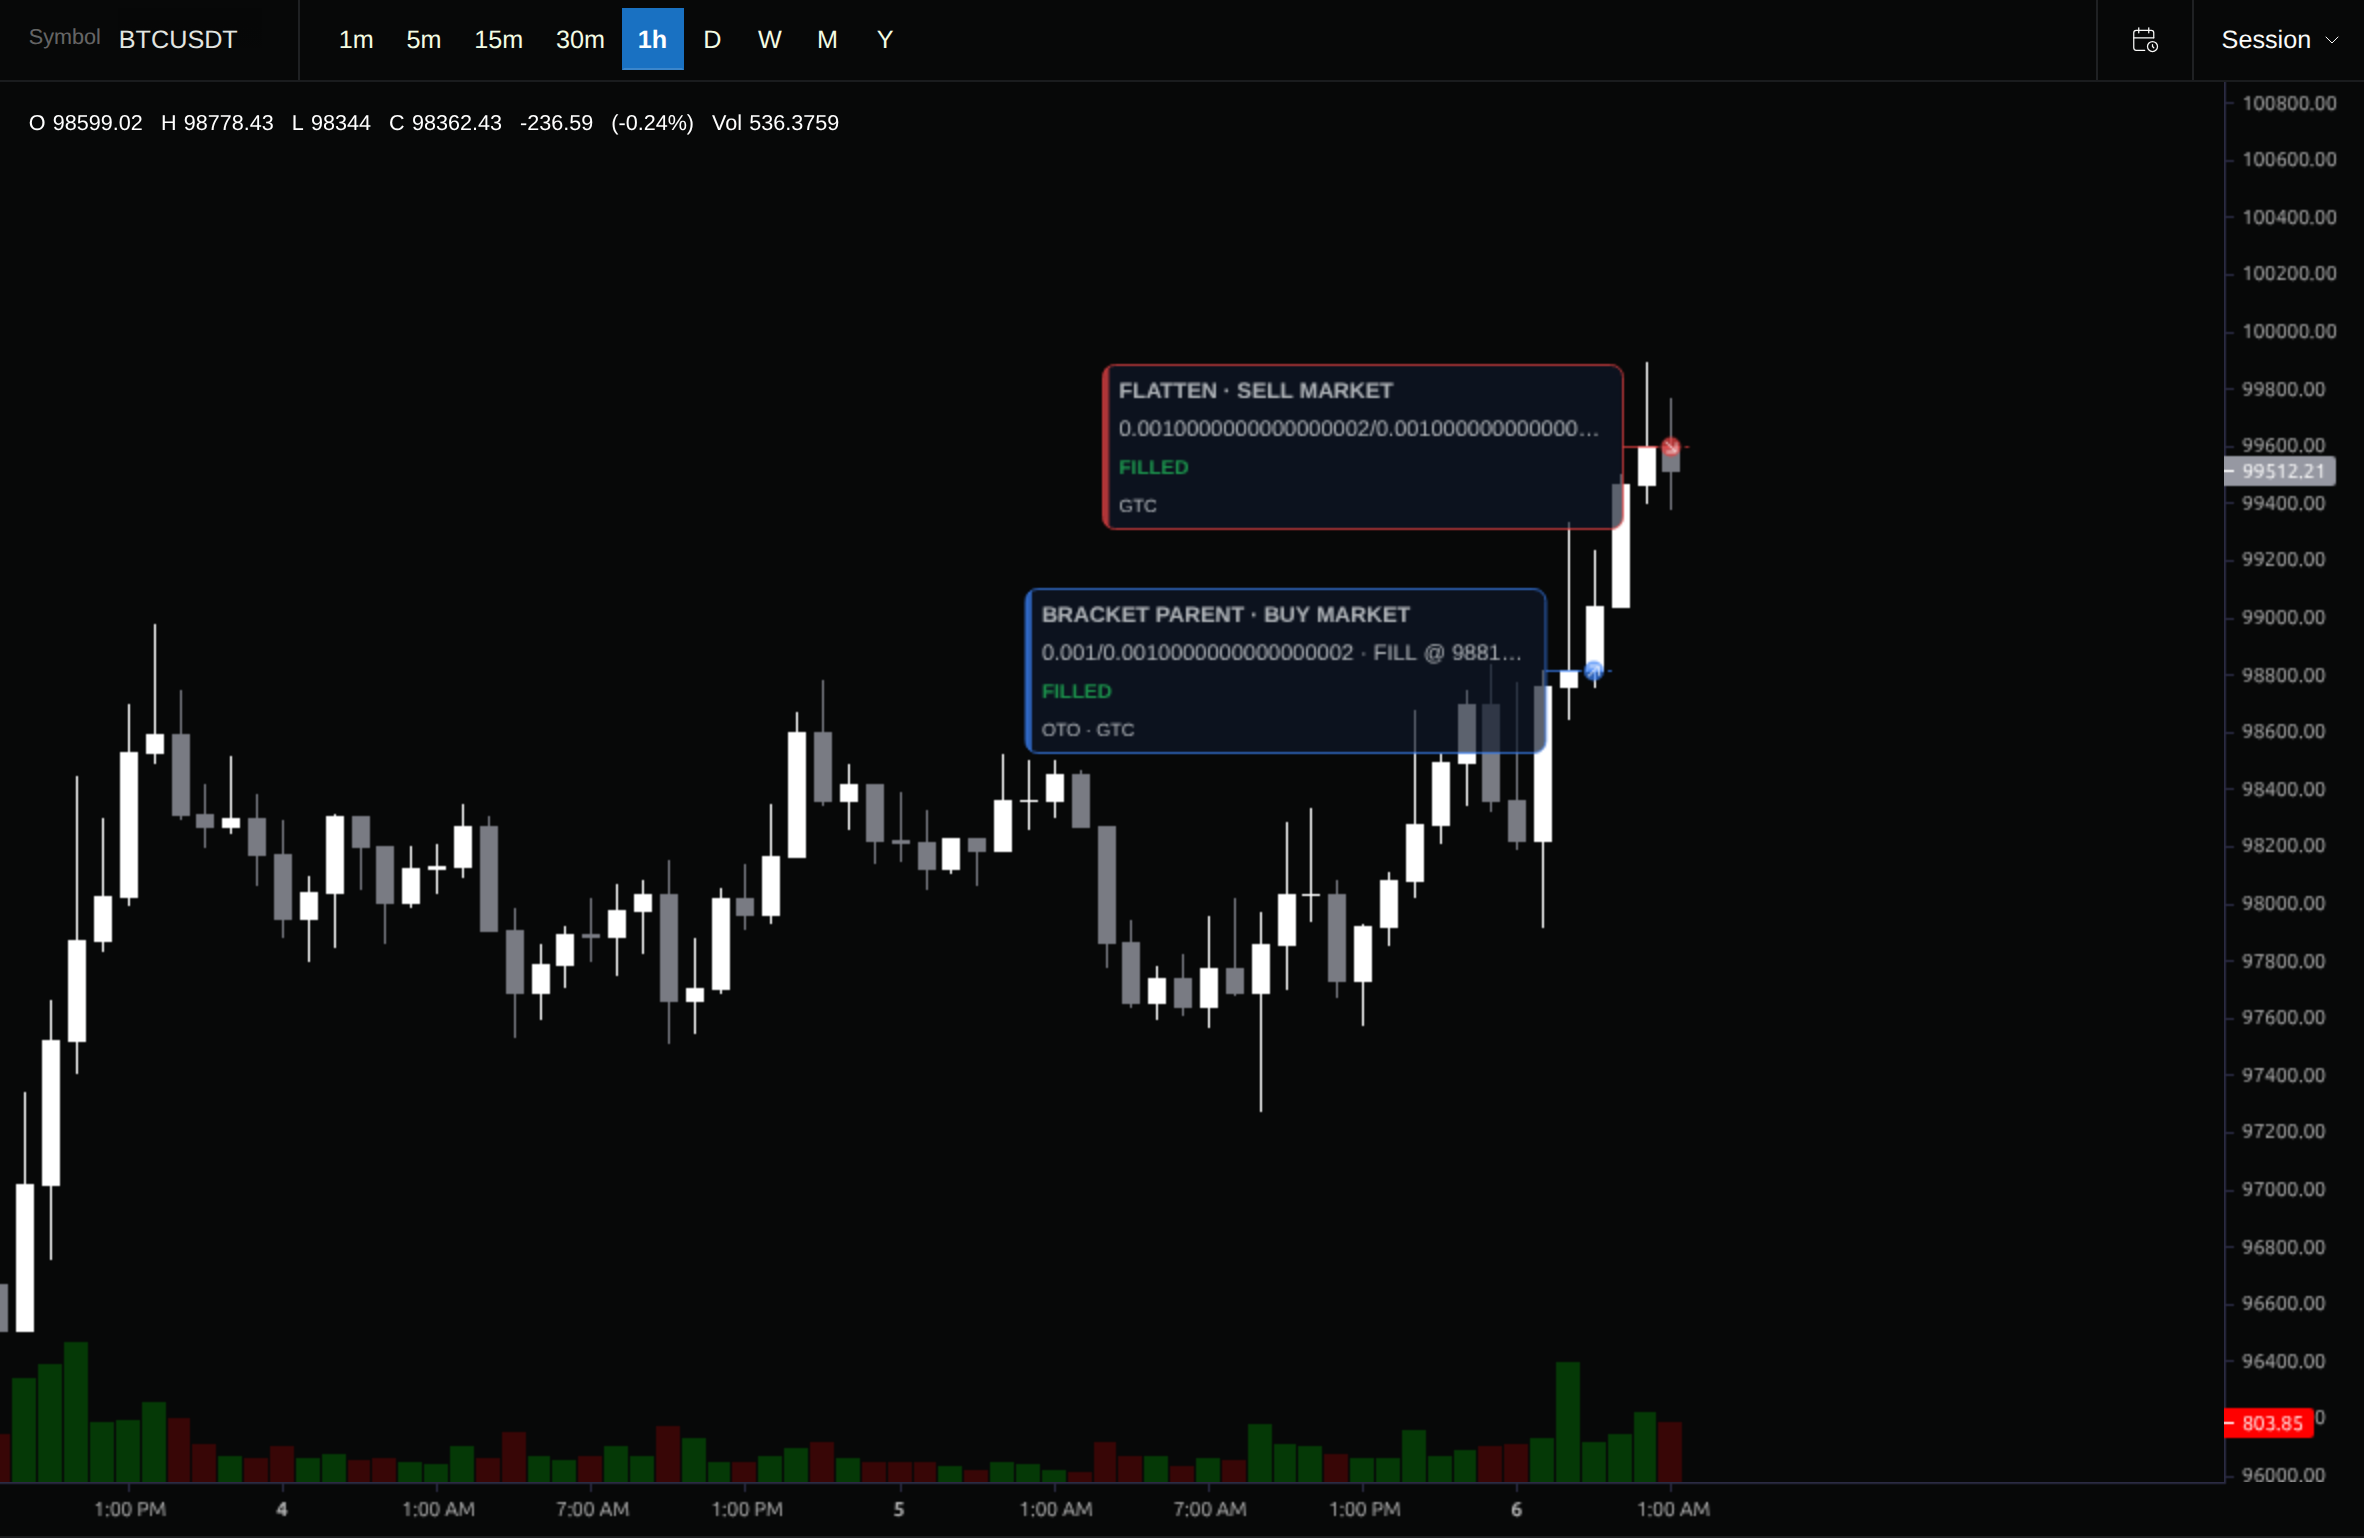
Two checks remain open in this example. Returned trade fees were zero despite the saved 0.10% crypto commission setting. Also, the original replay inspection at the selected entry timestamp displayed a different order price and an upward-cross condition marked false. The cause has not been reconciled. Keep those discrepancies with the result; do not call it a verified after-commission outcome or proof of correct signal timing.
Choose the next check from the result
Write one next action before adjusting parameters. For this example, verify fee application and reconcile the selected signal and fill first. Improving the headline return would leave those questions unanswered.
Use the guide that matches your remaining question:
- Costs are unclear: inspect crypto commission and break-even costs and slippage sensitivity.
- You need an asset-specific starting setup: follow the Bitcoin crossover, SPY RSI pullback, or ES opening-range recipe, with its stated limitations.
- The result depends on one parameter choice: test nearby settings using parameter sensitivity.
- You changed rules after seeing the result: freeze the new rules and reserve another period for evaluation; the walk-forward example explains that separation.
- You are considering execution next: work through the backtest-to-paper checklist after resolving the historical test’s gaps.
Keep your first deliverable small: saved rules and settings, a completed outcome, one inspected trade, and a written next check. Use Stratifyre backtesting to create that record for your own defined idea.
Put your strategy rules to the test
Build your strategy, inspect historical trades, and review the assumptions behind your results.
Build and test your strategy